If you have opened a footprint chart, you know the first feeling. Every candle turns into a grid of numbers, two at every price, and it is not obvious what any of them mean. Most people close it and go back to normal candles.
Even the ones who stay often get stuck one step later. A NinjaScript coder on futures.io described it well. He had learned “stacked imbalances, unfinished auctions, p / b patterns and delta divergences” from free sources. He backtested them. Then he wrote this: “I know why this concepts theoretically work, but my original plan to develop a price action strategy […] didn’t work.” (debleded, August 2021). You can know the definition and still not know what to do with it. This article is about the second part.
That is a shame, because one of the most useful things a footprint can show you takes about ten seconds to learn. You only need to look at one row: the very top of the bar, or the very bottom. That row tells you whether the market finished its business at that price or just walked away from it. Traders call the second case an unfinished auction.
In this article, I’ll show you what those two numbers at the top of a bar mean, and how to tell a finished auction from an unfinished one. Then I’ll give you the part most explanations leave out: a written plan. It uses the level as a target, on a real chart, with an entry price, a stop measured in ticks, and the outcomes where you do nothing. By the end, you’ll be able to read the top row of any bar and know exactly what to do with it.
Think of the market as an auction that never stops. Price goes up until buyers refuse to pay more. Then it goes down until sellers refuse to accept less. Every swing is one auction, and an auction ends when one side gives up.
A footprint chart lets you see that moment at the exact price where it happens. It splits every bar into rows, one row per price. Each row shows two numbers: how many contracts traded at the bid, and how many traded at the ask. Trades at the ask are buyers stepping in. Trades at the bid are sellers stepping in.
Now think about the last trade at the very top of a bar. A buyer pays the ask, and nobody sells into the bid at that price, because price is already turning down. So the top row of a finished high shows a zero on the bid side. At a bar low it is the reverse: a zero on the ask side. When both numbers in the extreme row are still healthy and there is simply no row beyond them, the auction didn’t finish. Buyers and sellers were both still busy at that price, and the market left before anyone won.
Here are two bar tops from the same instrument, side by side. Read only the top row in each. Bar A is a finished auction at the high: 0 at the bid, 3 at the ask. Bar B is an unfinished auction at the high: 14 at the bid, 11 at the ask, and nothing above.
| Bar A — finished | ||
|---|---|---|
| Bid | Price | Ask |
| 0 | 7,607.00 | 3 |
| 21 | 7,606.75 | 18 |
| 64 | 7,606.50 | 47 |
| Bar B — unfinished | ||
|---|---|---|
| Bid | Price | Ask |
| 14 | 7,613.50 | 11 |
| 39 | 7,613.25 | 44 |
| 71 | 7,613.00 | 66 |
These numbers are an example, not a recorded session. The shape is what matters. Bar A has a clean edge at the top: the last buyers paid up at 7,607.00, nobody sold into a bid there, and price fell away. Bar B has a cut: at 7,613.50 sellers were still hitting bids and buyers were still lifting offers, and then the bar just ended. On your own chart, you scan the top and bottom rows of swing highs and lows looking for that second shape.
Here is where most explanations stop, and where the trouble starts. They tell you an unfinished auction means “price will come back to finish it.” It often does. That is the whole reason you mark these levels: the market left a price where both sides were still busy, and it tends to come back and settle the argument. But “often” is not “always”, and a futures.io regular who had backtested these setups with tick replay put the catch better than any textbook.
Then comes the part that matters to you: “So as soon as you add a stop to the strategy it becomes break even.” He is saying two things at once. Yes, price does tend to come back. And no, betting on the return by itself is not a trade, because the stop you need to survive the wait eats the edge. Even the vendor whose indicator draws these levels says the same in its own guide. There is no guarantee of a return, and during a long trend the level can stay untested for a very long time.
So I don’t treat the unfinished print as an entry signal. I treat it as a price the market still owes a visit. That makes it a target first, and a level to read second. The plan below uses it in exactly that order.
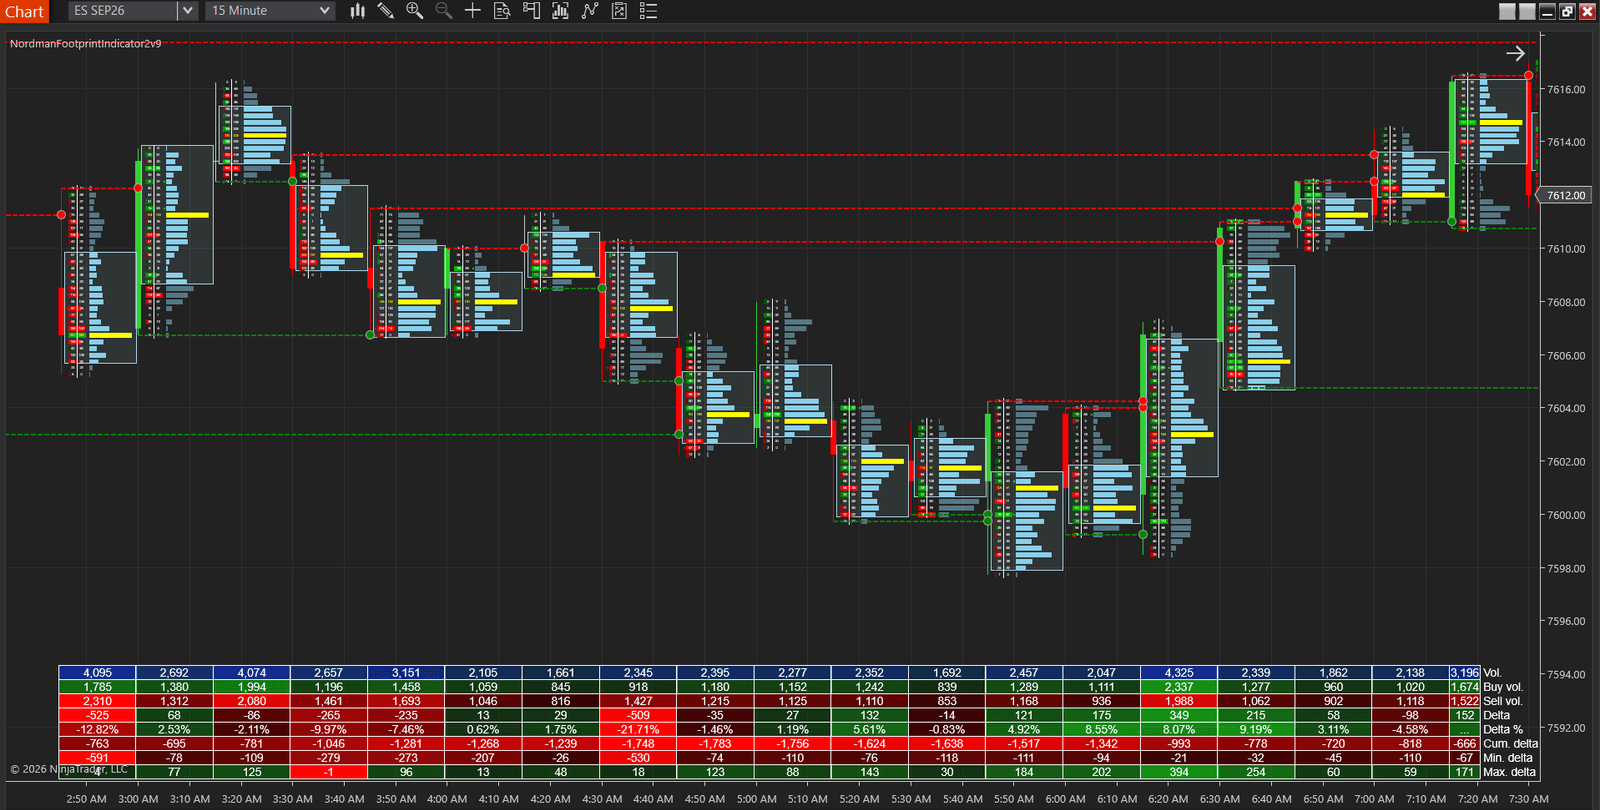
The chart at the top of this article is the one the plan below is built on: ES SEP26 on a 15-minute footprint. The indicator draws a red dashed line to the right of every high where the top row was still two-sided, and a green one under every low of the same kind. Look at the line at 7,613.50. It was left early in the session. Price then spent hours about fifteen points lower, and only came back to it in the last two bars on the screen. When it did, it went straight through by about three points before closing back under, at 7,612.00.
That is the whole behaviour you are trading. The level pulled price back to itself after several hours. It did not hold price when it got there. Both halves matter, and the second one is why the plan below takes profit at the level instead of trading against it.
Take the level from that chart. The unfinished high sits at 7,613.50 on the 15-minute ES chart, and price is working its way back up to it from below. What follows is the full sequence, from the moment you draw the line to the moment you are flat again. The level is the one on the screenshot. The entry and the stop are an example of how the plan uses it, because those come from your own setup. The rules are what you keep.
This next table is the part that saves you money, so read it twice. Most unfinished auctions never turn into the clean version above, so you need a rule for every version you might see, not just the good one.
| What you see | What you do |
|---|---|
| Unfinished high above you, price working back up to it, your own long setup fires below. | Long. Target the level. Stop under the pullback low. |
| Price returns and trades straight through the level, the way it does on the chart at the top. | Nothing new. Half came off at the level. Trail the rest. There is nothing here to fade. |
| Price returns and stalls at the level for several bars. | Still nothing from this level. A short needs a reason that isn’t the unfinished print. Take the target and wait for your own setup. |
| Price never comes back. A trend day walks away from it. | Nothing. This happens a lot. Delete the line at the end of the session. |
An unfinished low is the mirror image, and the green dashed lines on that chart are exactly that. Price left a bottom row with both sides still trading, so that low is a price the market tends to come back down to. You use it as the target for a short you take on your own setup above it, and you take at least half when price gets there. You don’t turn around and buy the level because the auction finished. The arrival is the payout, not the next entry.
Three settings let the chart do the watching for you, and you only set them once. On the NinjaTrader FootPrint OrderFlow Indicator, set the calculation to BidAsk with Tick Replay on, so the two numbers in each row are real fills and not a guess from tick direction. Set Ticks Per Level to 1 on ES, so the top row you read is one price and not a bundle of prices. Then you turn on the stacked imbalance alert. It is the alert that fires on the pullback setup in step 3, so you are not staring at 7,613.50 all morning waiting for an entry below it. It fires on other imbalances too, so you treat it as a prompt to look at your level, not as your trade.
One more thing about the calculation method, because it decides whether you will ever see this pattern at all. With UpDownTick, NinjaTrader assigns every trade at the bar high to the buy side by rule: the first trade there is an up tick, and trades at the same price inherit the previous label. So the bid column at the high is always zero, every high looks finished, and an unfinished auction cannot print. That is a classification artifact, not a market fact. BidAsk with Tick Replay is the only one of the three methods that shows real fills on both sides of the extreme row.
If a Volume Profile supplies your target or your pullback level, run it on the same calculation method as the footprint. A footprint on BidAsk next to a profile on UpDownTick puts the same volume at two different prices, and then your target and your trigger disagree about where the level even is. The same two-tool logic works for a Virgin POC, which is a close cousin of this idea. There is a worked plan for that in What Is a Virgin POC.
Try this now. Find the last five unfinished highs or lows on your chart. For each one, write down whether price came back, and if it did, what the top row printed on the return. Five levels take you ten minutes, and the ratio you get is your number, worth more than any percentage in an article.
| Before you place the order | The mistake it prevents |
|---|---|
| You are reading the top or bottom row only, on one fixed timeframe, with BidAsk and Tick Replay on. | Calling a mid-bar imbalance an auction, or a classification artifact a signal. |
| Both numbers in that row are clearly non-zero, and there is nothing beyond it. | Mistaking a thin print for an unfinished one. |
| The level sits in the direction the market is leaning, not behind a one-way trend. | Waiting all day for a return that never comes. |
| Your entry comes from your own setup. The unfinished level is the target. | Trading a level alone, with no reason to be in. |
| You only fade the level after the return finishes the auction and the rows below show the other side. | Shorting a high that is still being bought. |
| Stop two ticks past the swing that would prove you wrong, reward at least twice the risk. | A stop in the wrong place and a target picked on hope. |
Everything in this plan runs on three settings and one alert inside the FootPrint OrderFlow Indicator. Five days of trial covers a full week of unfinished levels on your own instrument.
See the FootPrint OrderFlow Indicator — 5-Day Free Trial →
Need something custom built, like an unfinished-auction detector with your own rules? We develop to order → NinjaTrader Developers
Nordman Algorithms provides algorithmic software tools for technical analysis and does not offer financial advice, trading signals, or managed trading services. Footprint values shown above are illustrative examples, not recorded market data. The trade plan is an educational example of how the indicator’s readings can be combined with a trader’s own setup and is not a recommendation. Visual markers and alerts reflect predefined mathematical conditions and do not constitute a recommendation to buy, sell, or hold any instrument. Forum quotations are reproduced verbatim from public sources for illustration and do not constitute endorsement. Futures trading carries a high level of risk. Only risk capital should be used. Full Risk Disclosure: https://www.nordman-algorithms.com/risk-disclosure/


