ICT traders often say a Market Structure Shift (MSS) only counts when price leaves with force: displacement. A big, decisive candle, or a move that leaves a fair value gap behind. Without it, the shift is supposed to be weak. We wanted to know whether that rule holds up in the data, so we measured it on 15,817 MSS signals across four futures markets and three years.
The short answer: no. With or without displacement, price went about as far against the trade as in its favour. None of the three versions of displacement we tested made the signal measurably better. On 15-minute charts one version showed a small hint worth retesting, and we explain it at the end.
A Market Structure Shift is the moment price breaks the last swing against the current direction. In a move down, price makes lower highs; when a candle closes above the last of those swing highs, structure has shifted up. The mirror applies after a move up. If you are unsure how this differs from a break of structure, our BOS vs CHoCH guide explains the labels.
Displacement is the ICT name for a fast, one-sided move that shows real intent: large candles that close near their extremes, often leaving a fair value gap, a three-candle gap where the first and third candles don’t overlap. Many ICT traders only trust a structure shift that comes with displacement, and skip the rest.
“Displacement” has no single official threshold, so we turned it into three rules a computer can check:
Every signal without the selected kind of displacement is the comparison group. Here is what each case looks like on a real ES 5-minute chart from the study:
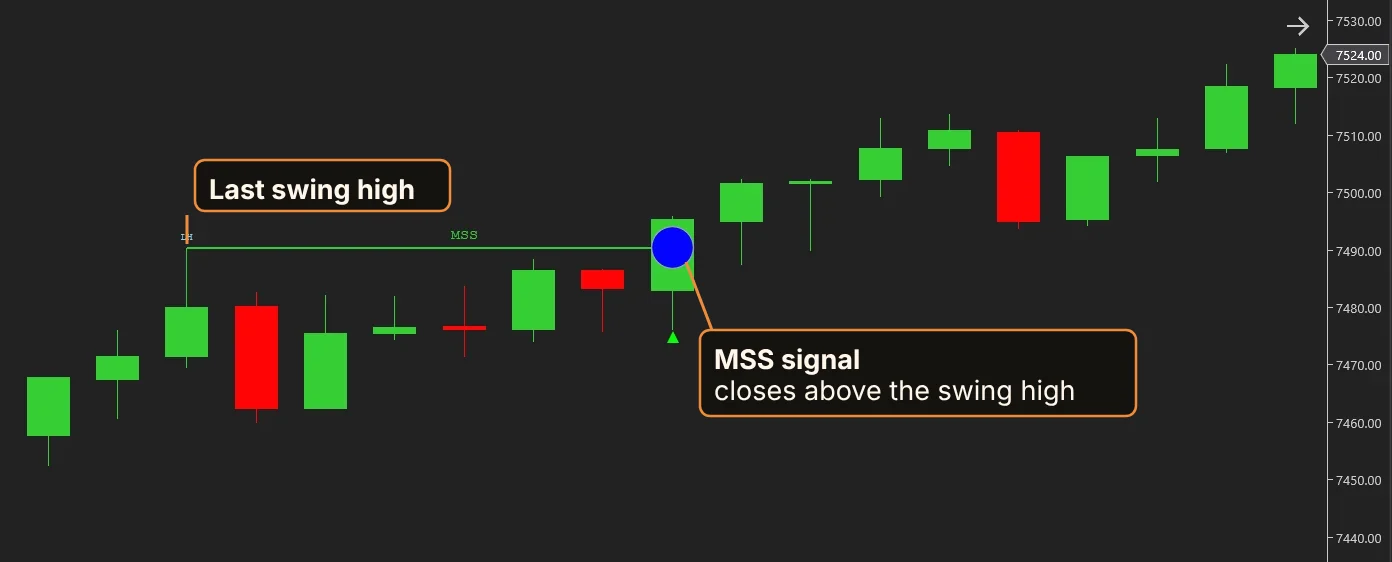
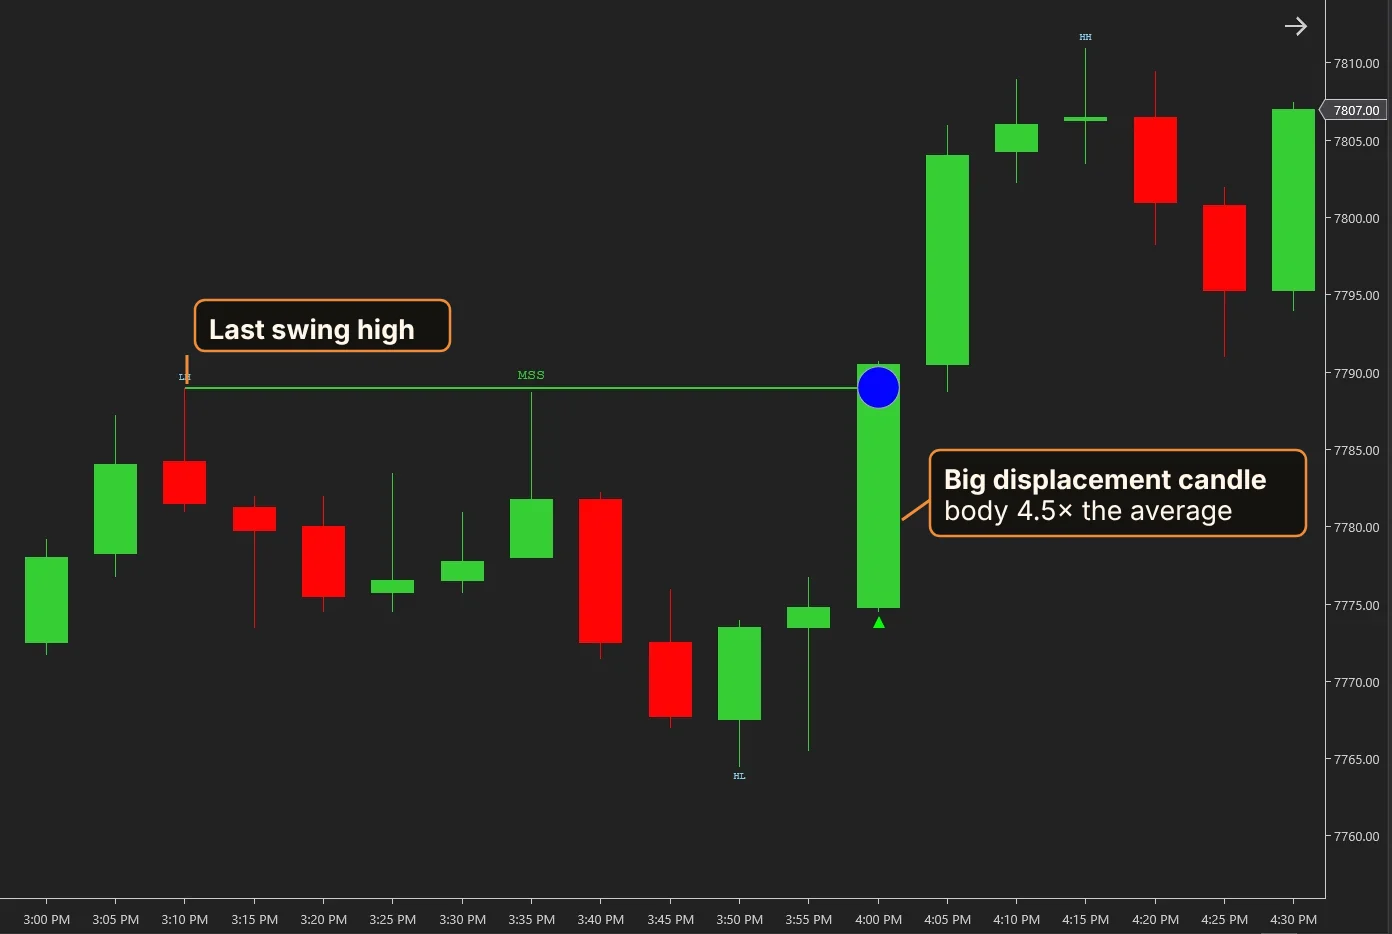
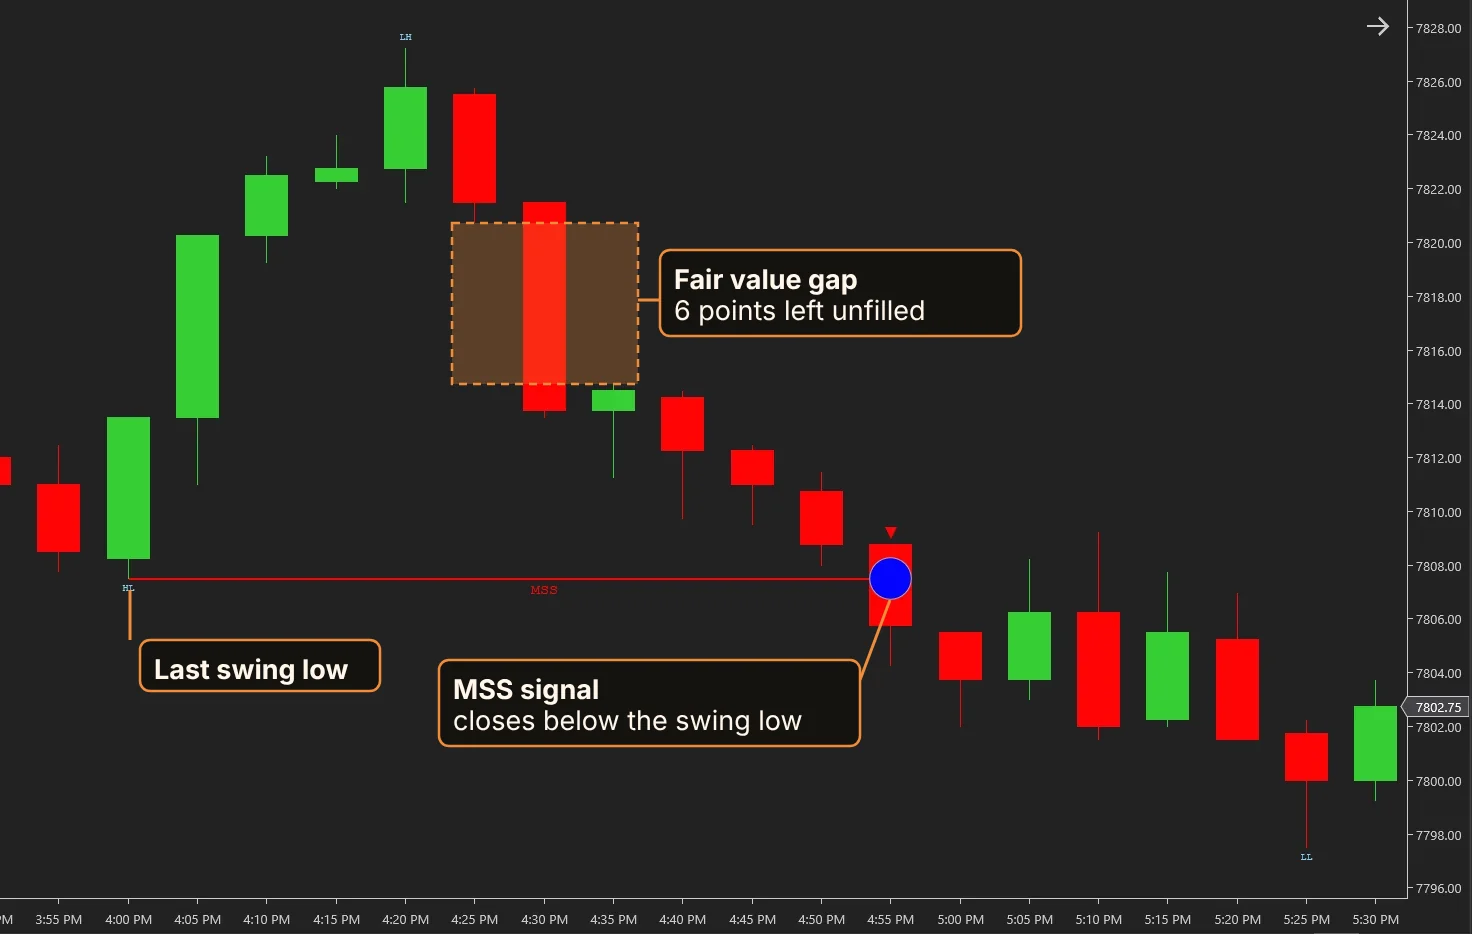
All signals came from our Market Structure Shift indicator for NinjaTrader 8 with its default settings (swing strength 5), on 5-minute charts of the E-mini S&P 500 (ES), E-mini Nasdaq-100 (NQ), Euro FX (6E) and Australian dollar (6A) futures, from October 2023 to September 2026. Each signal is entered at the open of the next candle.
A normal backtest needs a stop loss and a target, and the result then depends on those choices as much as on the signal. We wanted to judge the entry alone, so for every signal we measured two things:
We measure both over the first 5 minutes, 15 minutes, 1 hour and 1 day after entry, on 1-minute data, in units of ATR (the market’s normal bar size), so a move in the S&P and a move in the euro can be compared fairly. Then we combine them into one number:
edge ratio = average MFE ÷ average MAE
An edge ratio of 1.0 is a coin toss: price went as far against you as for you. Above 1.0, the signals offered more potential than risk. Every signal counts, including the ones that went nowhere.
Move the stop a little and a backtest winner can become a loser. MFE and MAE use no exit at all: they measure how much opportunity and how much risk each entry offered, so the entry is judged on its own. An exit can be designed later, on top of an entry that has shown potential.
The rule for a “yes” is strict on purpose. Displacement only counts as useful if, at 3 of the 4 checkpoints, its edge ratio is higher than without it on all markets pooled, on at least 3 of the 4 markets, in most months, and in at least 95% of 1,000 random redraws of trading days, so the difference can’t be explained by luck.
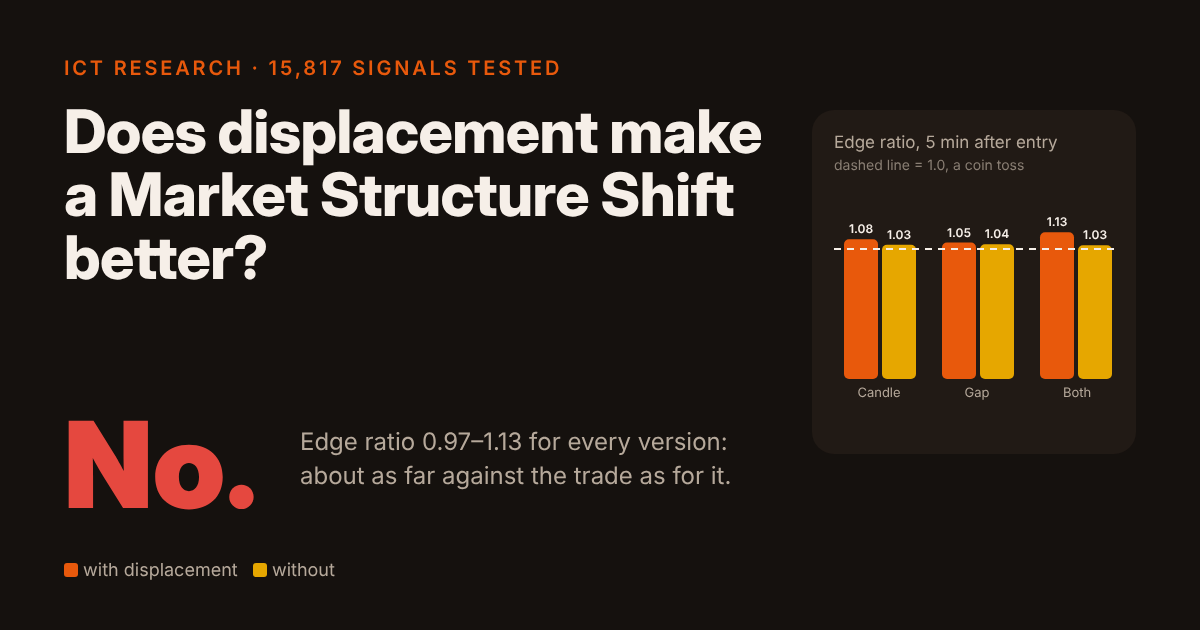
No. The chart compares signals with the selected kind of displacement (orange) against signals without it (yellow). Switch between the three versions:
Every bar sits close to the coin-toss line: between 0.99 and 1.08. With this kind of displacement the edge ratio is higher at 2 of 4 checkpoints and lower at 2, never by more than 0.04.
Across all three versions and all four checkpoints, every edge ratio lands between about 0.97 and 1.13. The full numbers:
| Edge ratio (with / without displacement) | 5 min | 15 min | 1 hour | 1 day | Checkpoints passed |
|---|---|---|---|---|---|
| Big candle | 1.08 / 1.03 | 1.04 / 1.04 | 1.00 / 1.00 | 0.99 / 1.00 | 0 of 4 |
| Fair value gap | 1.05 / 1.04 | 1.06 / 1.00 | 1.02 / 0.97 | 1.00 / 1.01 | 2 of 4 |
| Both | 1.13 / 1.03 | 1.08 / 1.03 | 1.02 / 1.00 | 0.99 / 1.00 | 1 of 4 |
Against that rule, the big candle passed at 0 of 4 checkpoints, the fair value gap at 2 and both together at 1. A “yes” needed 3. The strongest single number, 1.13 for big candle and gap 5 minutes after entry, faded to 1.02 within an hour and fell below the signals without displacement after a day.
Averages can hide a lot, so here is every signal on its own. Each dot is one signal: up means price went further your way (MFE), right means it went further against you (MAE).
One hour after entry, the two clouds lie on top of each other, spread evenly on both sides of the coin-toss line. The average signals sit right next to each other, almost on the line.
A random sample of 300 signals per group. The version follows the selection above. Dots above the dashed line offered more potential than risk; the few largest moves run off the edges.
It came closest, but no. A fair value gap is far more common than most traders expect: 66% of all MSS signals already had one in the move into the break, against 27% with a big candle. With a gap, the edge ratio was higher 15 minutes and 1 hour after entry (1.06 and 1.02, against 1.00 and 0.97 without), and those two checkpoints passed the rule. At 5 minutes the difference was too small to rule out luck, and after a day the signals without a gap were slightly ahead. Two checkpoints out of four is not enough for a “yes”, and even the best gap number is only a few percent above a coin toss.
A common objection is that 2× the average isn’t “real” displacement. So we tested every threshold from 1× to 3× the average body. A stricter rule gives far fewer signals, but not better ones:
One hour after entry, the edge ratio of signals with a big candle stays between 0.99 and 1.02 however big the candle must be, while the share of signals that qualify falls from 36% to 16%.
Big-candle version on 5-minute charts. The horizontal axis is how big the breakout candle’s body must be compared with the average of the last 20 candles; the study itself used 2×.
Maybe displacement works on some markets, or in some periods? Here is every market and every month. Green means displacement gave the higher edge ratio, red the lower one.
One hour after entry, it is close to a coin toss, leaning slightly towards displacement. Across all three versions, displacement gave the higher edge ratio in 60 month windows and the lower one in 48. By market: higher in 8, lower in 4 of 12.
In the first minutes after entry there is a slight lean towards displacement: across all three versions it had the higher edge ratio in 64 month windows and the lower one in 44. Follow it through the day and the lean fades; one day after entry it has flipped, 44 to 64. It is a useful lesson on its own: in one market or one good month you can find a story for almost anything. Over three years and four markets, the story disappears.
To make sure the result wasn’t an accident of one setting, we repeated the whole test on 15-minute charts and with smaller swings (swing strength 3). Every version again failed the rule. But on 15-minute charts, signals with a big displacement candle came out ahead at every checkpoint:
With a big candle, the edge ratio was higher at all four checkpoints, by 1% to 13%: from about 0.96–1.02 without it to 1.03–1.08 with it.
We treat this as a hint, not a finding. The effect is small, and it showed up while we were looking at many settings at once, which is exactly how chance patterns appear: look in enough places and something always looks good. The right test is to repeat it on data this study never touched, from October 2020 to September 2023.
A structure shift with displacement looks convincing on a chart. Measured on 15,817 signals, it doesn’t pick better entries than one without displacement: price went about as far against the trade as in its favour, either way. So if you skip every MSS without a big candle or a gap, you are not filtering for quality, you are mostly just taking fewer trades.
A signal is not a strategy. If there is an edge, it more likely comes from context: where the signal happens, when it happens, and what happened right before, such as a liquidity sweep. That is what we will keep testing, one piece at a time.
Test it on your own market. Every signal in this study came from the Nordman Market Structure Shift indicator for NinjaTrader 8, with its default settings.
See the Market Structure Shift Indicator →Not in this study. Across 15,817 MSS signals on ES, NQ, 6E and 6A futures, signals with displacement had about the same edge ratio as signals without it, between 0.97 and 1.13 for every version and checkpoint. None of the three versions passed the study’s rule for a “yes”.
There is no official threshold. We used a body at least 2× the average of the previous 20 candles, closing near its extreme, and also tested 1× to 3×. Larger thresholds gave fewer signals (36% of all signals at 1×, 16% at 3×) without raising the edge ratio.
Many traders treat a fair value gap as part of displacement. In our data, 66% of MSS signals already left a gap. Signals with a gap did slightly better 15 minutes and 1 hour after entry, but not at 5 minutes or after a day, so the gap did not pass the rule either.
The average maximum favourable excursion (MFE) divided by the average maximum adverse excursion (MAE), over every signal, measured in ATR units. 1.0 means price went as far against the trade as for it, a coin toss; above 1.0, the entries offered more potential than risk.
No. A break of structure (or a Market Structure Shift) is about where price closes relative to the last swing. Displacement describes how price got there: fast, one-sided, with large candles or a gap. A break can happen with or without displacement, which is exactly the comparison this study makes.
Data. E-mini S&P 500 (ES), E-mini Nasdaq-100 (NQ), Euro FX (6E) and Australian dollar (6A) futures from Kinetick, back-adjusted continuous contracts, full electronic session, 1 October 2023 to 30 September 2026. Signals per market: ES 3,863, NQ 3,981, 6E 3,921, 6A 4,052.
Signal. Market Structure Shift on 5-minute charts from the Nordman MSS indicator for NinjaTrader 8 with default settings: swing points with strength 5, a close beyond the last swing, at least one lower high (or higher low) before the break. Entry at the open of the next bar. All signals counted, including overlapping ones.
Displacement. Big candle: the breakout candle closes in the direction of the break, its body is at least 2× the average body of the previous 20 candles and at least 80% of the candle. Fair value gap: a three-candle gap in the direction of the break, at least 0.1 ATR wide, formed between the most extreme price after the broken swing and the signal candle.
Measurement. On 1-minute data, over 5 minutes, 15 minutes, 1 hour and 1 day after entry: MFE and MAE over the whole window, in ATR(14) units of the chart at the signal bar. Edge ratio: average MFE divided by average MAE, over all signals.
Rule. Displacement counts as useful only if its edge ratio is higher than without it on all markets pooled, on at least 3 of 4 markets, in more than half of the months with enough signals, and in at least 95% of 1,000 redraws of trading days, at 3 of the 4 checkpoints.
Robustness. On 15-minute charts and with swing strength 3, every version again failed the rule. The small lead of big candles on 15-minute charts is reported as a hint to retest, not as a finding.
Research and text by Alexei Kuntysh, founder of Nordman Algorithms, a team that builds indicators, strategies and trade copiers for NinjaTrader, MetaTrader, cTrader and TradingView. Alexei has built trading software since 2008. Signals were generated with the Nordman Market Structure Shift indicator and measured with our own analysis code on historical data.
Nordman Algorithms provides software infrastructure for trade automation and does not offer financial advice, trading signals, or managed trading services. The results in this study are hypothetical: they are calculated from historical market data by fixed rules, don’t include costs or slippage, don’t represent actual trading and don’t guarantee future results. Market Structure Shift signals and displacement filters do not constitute a recommendation to buy, sell, or hold any instrument. This article is for informational and educational purposes only. Trading futures involves substantial risk of loss. See our risk disclosure.