NinjaTrader FootPrint OrderFlow Indicator
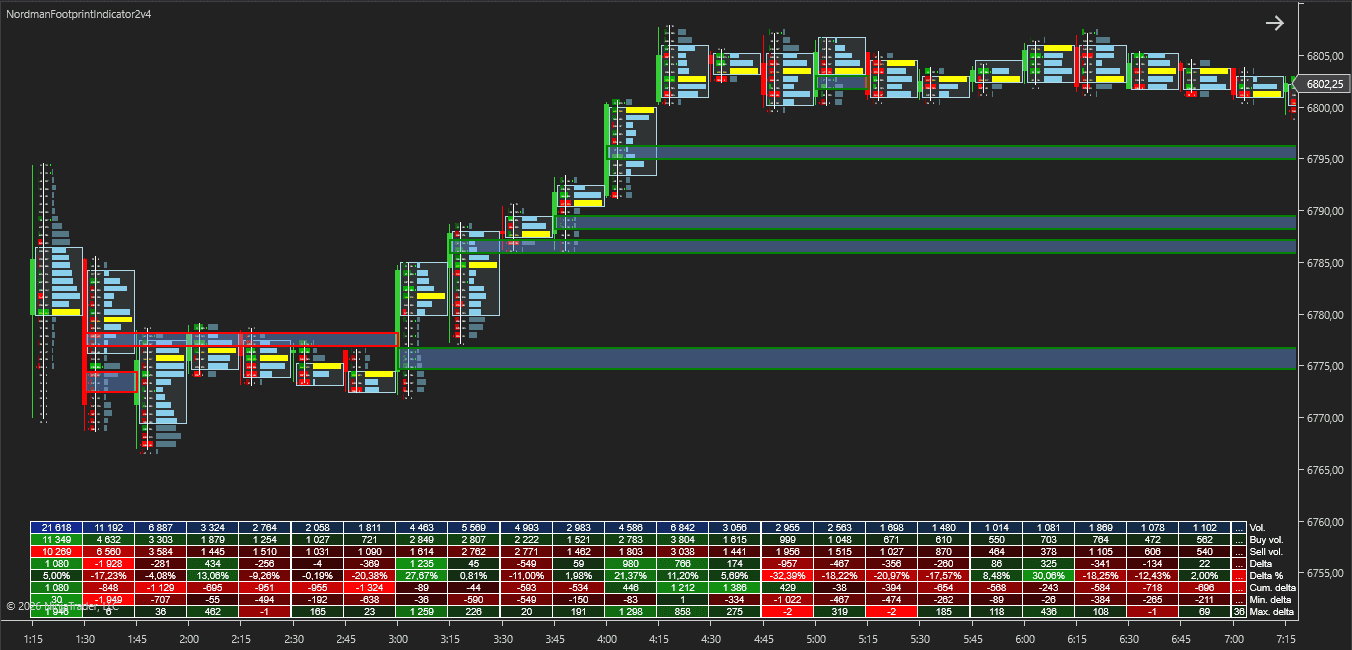
The NinjaTrader FootPrint OrderFlow Indicator shows buy and sell volume at every price level inside each bar, calculated from tick, bid/ask (Tick Replay) or 1-minute data. It adds a per-bar Volume Profile with POC and Value Area, horizontal or diagonal imbalances, stacked imbalance zones with retest or breakout markers, unfinished auction levels, bar statistics, tick aggregation and an MFE/MAE Tracker.
Already a subscriber or have purchased a product?
What the FootPrint OrderFlow Indicator Does
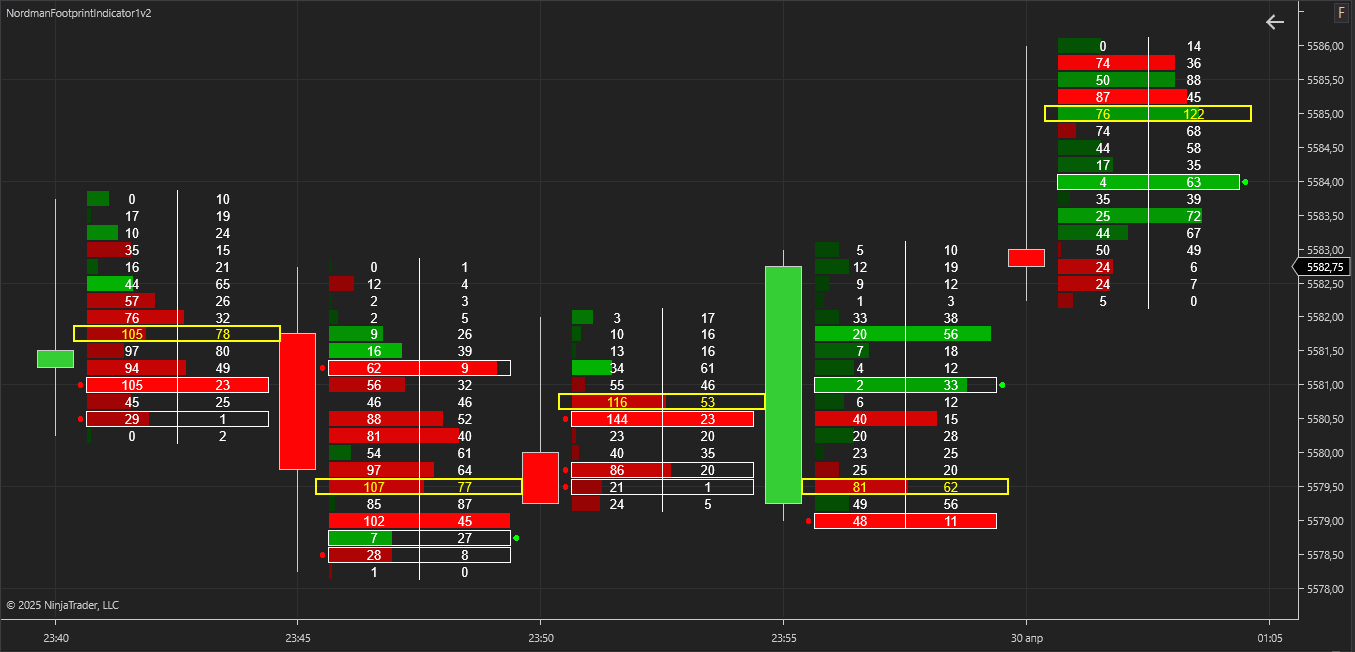
The FootPrint OrderFlow Indicator for NinjaTrader 8 shows buy and sell volume at each price level inside every bar. A standard candle reduces a bar to its open, high, low and close; the footprint shows how volume was distributed between those prices.
What Is a Virgin POC? How to Read an Untouched Point of Control →
NinjaTrader 8 Volume Indicators Bundle: Building a Complete Volume Setup →
On top of the footprint grid, the indicator adds a per-bar Volume Profile with POC and Value Area, horizontal or diagonal imbalance detection, stacked imbalance zone tracking with retest or breakout markers, unfinished auction tracking, per-bar statistics, tick aggregation and an MFE/MAE Tracker. Each of these can be enabled and configured separately.
Imbalance detection is the core of the order flow layer. An imbalance is a price level where volume on one side of the market is significantly larger than on the other.
- A level is marked as an imbalance when the larger side exceeds the smaller one by the set ratio and the absolute difference between them is not below the set minimum.
- Imbalanced levels are highlighted directly in the footprint grid, at the price where the one-sided activity occurred.
- Consecutive imbalanced levels can be tracked as a stacked imbalance zone that stays on the chart after the bar closes.
- The per-level detail is intended for short-term and intraday order flow analysis on instruments with sufficient tick data.
FootPrint Indicator — Key Functional Components
Calculation Type
The indicator supports three methods for classifying volume as buying or selling.
Up Down Tick
Volume is classified by tick direction: a trade at a higher price than the previous trade counts as buying, a trade at a lower price counts as selling. When the price is unchanged, volume is assigned to the same side as the previous trade. The indicator loads its own 1-tick data series, so Tick Replay is not required, but historical tick data must be available for the instrument.
Bid Ask
Volume traded at the ask or above counts as buying; volume traded at the bid or below counts as selling. Trades between the bid and the ask are assigned to the same side as the previous trade. This is the only mode based on actual bid and ask data.
Note: Bid Ask mode requires Tick Replay to be enabled in the chart’s Data Series settings. Without Tick Replay, the indicator shows a message and does not calculate.
Minute Bar Based
Volume is classified by 1-minute bars: an up bar counts as buying, a down bar counts as selling. If a 1-minute bar closes at the same price as the previous one, volume is assigned to the same side as the previous bar. The indicator loads its own 1-minute data series.
In Up Down Tick and Minute Bar Based modes, buy and sell volume is a classification by price direction rather than recorded bid and ask volume. If the required tick or minute history is not available, the indicator shows a message asking to check the data for the instrument.
FootPrint Chart
The footprint grid shows sell and buy volume side by side at every price level of each bar.
Cell colors reflect which side dominated at the level, and imbalanced levels are highlighted within the grid.
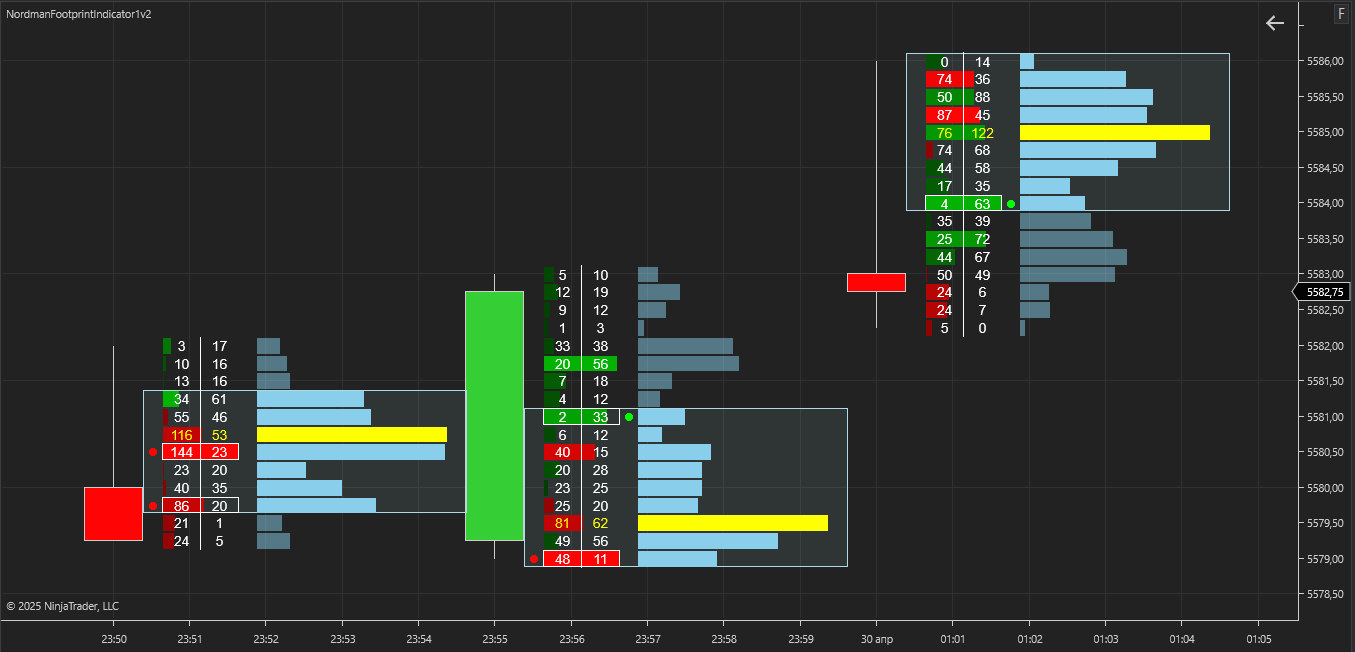
Built-in Volume Profile with POC and Value Area
Each bar gets its own Volume Profile, drawn next to the footprint grid.
The Point of Control (POC) marks the price level with the highest traded volume in the bar, and the Value Area marks the range that contains the set share of the bar’s volume (68% by default). Together with imbalance highlighting, the profile shows both where volume concentrated and where one side dominated within that range.
Imbalance Detection
The comparison method is selected with Imbalance Type: horizontal or diagonal.
Horizontal imbalance
Diagonal imbalance
Stacked imbalance
- Horizontal compares ask volume and bid volume at the same price level.
- Diagonal compares ask volume at a price level with bid volume one level lower, the standard way footprint charts compare aggressive buyers and sellers across adjacent prices.
A level is marked as an imbalance when two conditions are met: the larger side is at least Imbalance Ratio times the smaller side (3:1 by default), and the absolute difference between the two sides is at least Imbalance Min. Absolute Difference (30 by default). The second condition filters out thin levels where a high ratio comes from very small volumes. Alerts can be enabled separately for bullish and bearish imbalances.
Stacked Imbalance Zone Tracking
With Track Stacked Imbalances enabled, the indicator checks every completed bar for consecutive imbalanced levels.
When their number reaches Stacked Imbalances Threshold (3 by default), a zone is created around them:
- a bullish zone is created from stacked buying imbalances when the bar closes above the zone;
- a bearish zone is created from stacked selling imbalances when the bar closes below the zone.
A zone stays on the chart until a bar closes beyond its opposite boundary: below the lower boundary for a bullish zone, above the upper boundary for a bearish zone.
Stacked Imbalance Strategy selects which price interaction with the zone is marked on the chart:
- Retest: a marker is plotted when price returns to the zone, that is, when the bar’s low reaches the upper boundary of a bullish zone or the bar’s high reaches the lower boundary of a bearish zone. A zone can produce several retest markers until it is broken.
- Breakout: a marker is plotted when price closes beyond the opposite boundary of the zone. A bullish zone broken to the downside produces a bearish marker; a bearish zone broken to the upside produces a bullish marker. The zone ends at that point.
Retest and breakout markers, the zone plots, zone alerts and the MFE/MAE Tracker work only when Draw Stacked Imbalances Zone is enabled.
With Calculate set to On Each Tick (the default), markers on the forming bar are evaluated as price updates and can appear or disappear before the bar closes.
Unfinished Auction Tracking
At a bar’s high or low, an auction is usually considered finished when trading at that price was one-sided, for example when there was no bid volume at the high.
When both bid and ask volume are present at the extreme, the auction is treated as unfinished: price turned at that level while two-sided trading was still taking place there.
With Track Unfinished Auctions enabled, the indicator checks the high and low of every completed bar. An unfinished auction is registered when both bid and ask volume are present at the extreme and each is at least Minimum Volume (1 by default). If either side is zero, the auction is treated as finished and no level is created.
Each unfinished auction is drawn as a dashed horizontal line from the extreme: red from a high, green from a low. The line extends to the right until price touches the level for the first time. On the first touch:
- the line stops extending and a dot is drawn at its end;
- the Upper or Lower Unfinished Auction Close plot receives the level price on that bar;
- a text message and an alert are generated.
Two more plots report the nearest levels that have not been touched yet: Nearest Unfinished Auction Above (above the current bar’s high) and Nearest Unfinished Auction Below (below the current bar’s low).
Recommended settings: Calculation Type = Bid Ask and Ticks Per Level = 1.
With Ticks Per Level above 1, the volume check covers the aggregated row that contains the extreme rather than the exact price. In Up Down Tick and Minute Bar Based modes, the two sides of volume are a direction-based classification rather than recorded bid and ask, so unfinished auctions are approximate. When Track Unfinished Auctions is enabled with other settings, the indicator shows a warning that names the parameter to change; if both differ, both are listed in one warning.
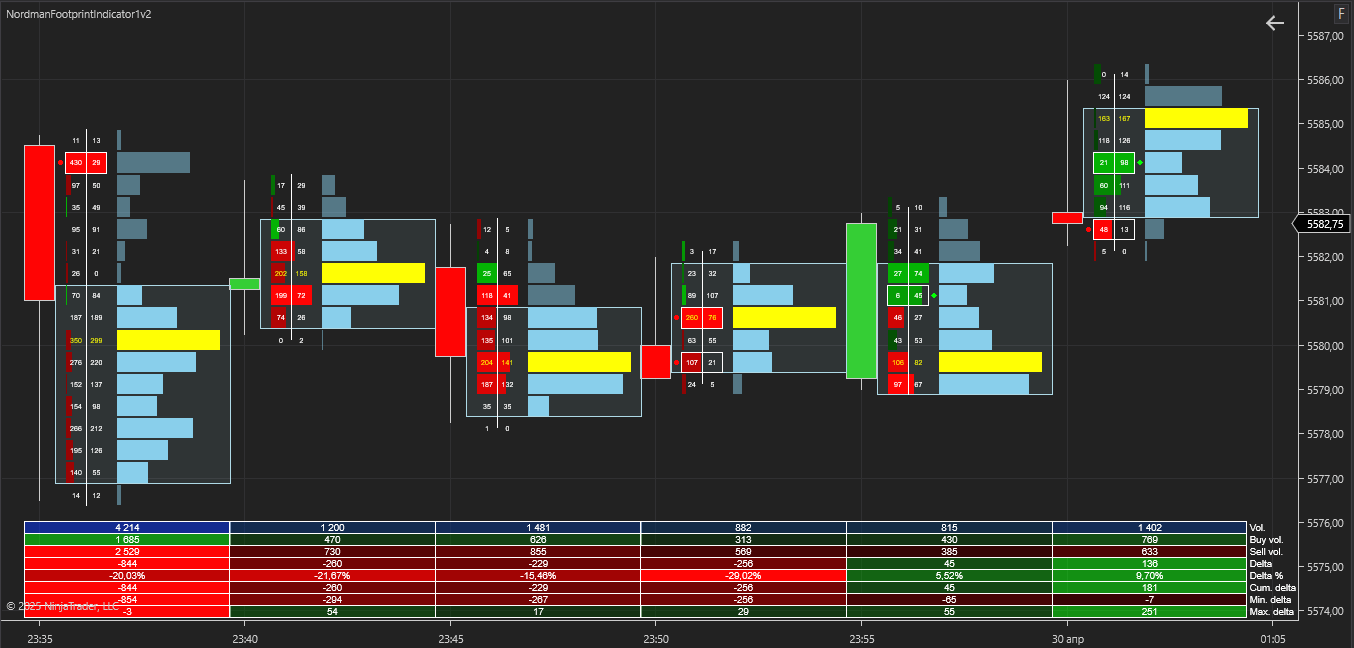
Summary Statistical Data
A statistics table below the bars shows the main metrics for each bar.
- Total volume;
- Buy and sell volume;
- Delta (buy volume minus sell volume);
- Delta % (delta as a share of total volume);
- Cumulative delta;
- Minimum and maximum delta reached within the bar.
Each row can be shown or hidden individually.
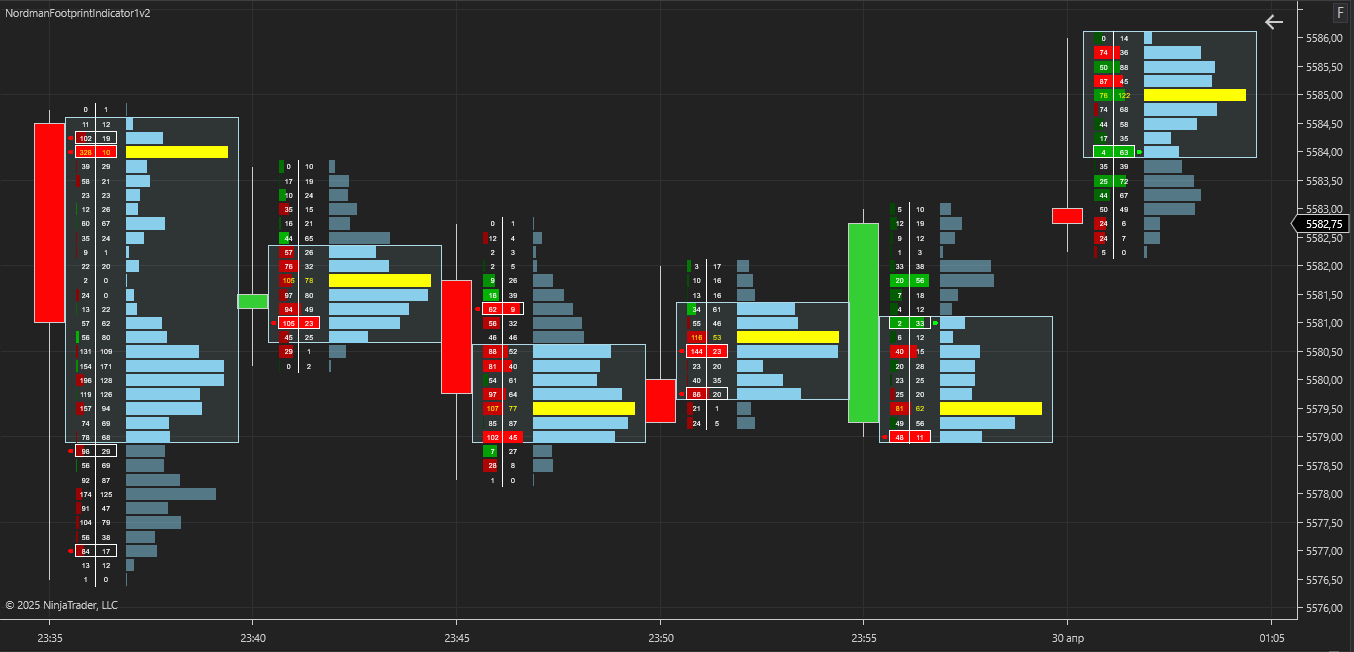
Tick Aggregation
For instruments with many price levels per bar, Ticks Per Level combines several ticks into one footprint row (2 by default).
This reduces the number of rows on the chart; volume, delta and imbalance calculations then run on the combined rows. Set Ticks Per Level to 1 to display every price separately.
Tick aggregation on the chart
Tick aggregation settings
Built-In MFE/MAE Tracker
The MFE/MAE Tracker measures how price moved after each stacked imbalance zone marker.
For every marker, it records the maximum favorable excursion (MFE) and the maximum adverse excursion (MAE) over up to four time windows set in seconds, minutes or days, plus an optional window that lasts until the next marker in the opposite direction.
Results are shown in an on-chart table as the median MFE/MAE ratio for long and short markers, and the table can be exported to CSV. The tracker describes how markers behaved on the loaded history; it does not forecast future price movement. It uses the markers from Stacked Imbalance Zone Tracking, so Track Stacked Imbalances and Draw Stacked Imbalances Zone must be enabled.
See how the MFE/MAE Tracker is calculated and how to read the dashboard →
Alerts
Alerts are available for imbalances, stacked imbalance zones and unfinished auction touches.
- individual bullish and bearish imbalances;
- formation of a stacked imbalance zone;
- zone retests or breakouts, depending on Stacked Imbalance Strategy;
- the first touch of an unfinished auction level.
Alerts can be delivered as a pop-up window, a sound (a custom .wav file can be selected) or an email; email alerts require the NinjaTrader email share service to be configured. Alerts are generated in real time only; historical bars do not trigger them.
Indicator Settings & Parameters
Full parameter reference, grouped by configuration area.
| Parameter | Description |
|---|---|
| Calculation & Volume Profile | |
| Calculation Type | Selects the method used to classify volume as buying or selling.
|
| Show Volume Profile | Enables or disables the per-bar Volume Profile display. |
| Show Value Area | Enables or disables the Value Area display. |
| Value Area (%) | Sets the share of the bar’s volume included in the Value Area. Available when Show Value Area is enabled. |
| Show POC | Enables or disables the Point of Control (POC) display. |
| Ticks Per Level | Sets how many ticks are combined into one footprint row. A value of 1 displays every price separately. |
| Imbalances | |
| Imbalance Type | Selects the imbalance comparison method.
|
| Imbalance Ratio | Defines the minimum volume ratio (e.g., 2:1, 3:1) between the larger and the smaller side for a level to be classified as an imbalance. |
| Imbalance Min. Absolute Difference | Specifies the minimum absolute volume difference between the two sides for an imbalance to be considered valid. This filters out levels where a high ratio comes from very small volumes. |
| Stacked Imbalances | |
| Track Stacked Imbalances | Enables detection and tracking of stacked imbalance zones on the chart. |
| Stacked Imbalances Threshold | Sets the minimum number of consecutive imbalanced levels required to form a stacked imbalance zone (2 or more). |
| Draw Stacked Imbalances Zone | Enables visual display of the zone drawn around a detected stacked imbalance. Also required for retest and breakout markers, zone plots, zone alerts and the MFE/MAE Tracker. |
| Stacked Imbalance Strategy | Selects which zone interaction is marked on the chart. Available when Draw Stacked Imbalances Zone is enabled.
|
| Unfinished Auctions | |
| Track Unfinished Auctions | Enables detection of unfinished auctions at bar highs and lows. Touch alerts are delivered through the selected alert channels. |
| Minimum Volume | Sets the minimum bid volume and ask volume required at the bar extreme to register an unfinished auction. Available when Track Unfinished Auctions is enabled. |
| Alerts | |
| Enable Imbalance Alerts | Enables or disables alerts for individual imbalances. |
| Enable Bullish Imbalance Alerts / Enable Bearish Imbalance Alerts | Enable alerts for bullish and bearish imbalances separately. The same direction filter applies to stacked imbalance alerts. Available when Enable Imbalance Alerts is enabled. |
| Enable Stacked Imbalance Alerts | Enables or disables alerts for stacked imbalance zone formation, retests and breakouts. Available when Track Stacked Imbalances is enabled. |
| Enable pop up alert | Shows alerts in a pop-up window. |
| Enable sound alert | Plays a sound when an alert is generated. |
| Alert sound file | Selects the sound file played on alerts. Available when Enable sound alert is enabled. |
| Enable email alert | Sends alerts by email through the NinjaTrader email share service. |
| Email to | Sets the recipient address for email alerts. Available when Enable email alert is enabled. |
| Statistics | |
| Show Statistics | Enables or disables the on-screen summary table with per-bar metrics. |
| Show Volume, Show Buy Volume, Show Sell Volume, Show Delta, Show Delta %, Show Cumulative Delta, Show Min. Delta, Show Max. Delta | Show or hide individual rows of the statistics table. Available when Show Statistics is enabled. |
| MFE/MAE Tracker | |
| Enable Tracker | Enables the MFE/MAE Tracker and its on-chart table. Available when Track Stacked Imbalances and Draw Stacked Imbalances Zone are enabled. |
| Enable Opposite Signal | Adds a measurement window that lasts until the next marker in the opposite direction. |
| Calculation Precision | Selects the price data used to measure excursions.
|
| Enable Period 1–4 | Turns each of the four measurement windows on or off. |
| Period 1–4 Type | Selects the unit of the window length.
|
| Period 1–4 Seconds / Minutes / Days | Sets the window length in the selected unit. |
| Track Long Signals / Track Short Signals | Include bullish or bearish markers in the tracker statistics. |
| Show Indicator Name | Shows the indicator name in the table header. |
| Table Width (%) | Sets the width of the tracker table relative to the chart. |
| Table Font Size | Sets the font size of the tracker table, in pixels. |
| Colors | |
| Font Color Chart | Sets the color of the numbers in the footprint grid. |
| Font Color Statistics (values) / Font Color Statistics (labels) | Set the colors of the values and row labels in the statistics table. Available when Show Statistics is enabled. |
Plot Outputs for Strategy Builder & Automation
The indicator exposes a set of analytical plot outputs for structured integration with third-party strategy builders and automation tools such as BloodHound and BlackBird (SharkIndicators), as well as other algorithmic trading environments.
Bar Statistics
- Vol.Value
- Buy vol.Value
- Sell vol.Value
- DeltaValue
- Delta %Value
- Cum. deltaValue
- Min. deltaValue
- Max. deltaValue
Stacked Imbalance Zones
- Bullish Imbalance Zone> 0
- Bearish Imbalance Zone> 0
- Bullish Imbalance Zone Upper BoundaryValue
- Bullish Imbalance Zone Lower BoundaryValue
- Bearish Imbalance Zone Upper BoundaryValue
- Bearish Imbalance Zone Lower BoundaryValue
Unfinished Auctions
- Upper Unfinished Auction Close> 0
- Lower Unfinished Auction Close> 0
- Nearest Unfinished Auction AboveValue
- Nearest Unfinished Auction BelowValue
MFE/MAE Tracker
- Long MFE/MAE Period 1Value
- Short MFE/MAE Period 1Value
- Long MFE/MAE Period 2Value
- Short MFE/MAE Period 2Value
- Long MFE/MAE Period 3Value
- Short MFE/MAE Period 3Value
- Long MFE/MAE Period 4Value
- Short MFE/MAE Period 4Value
- Long MFE/MAE OppositeValue
- Short MFE/MAE OppositeValue
Delta % is returned as a ratio from −1 to +1 and shown as a percentage on the chart. Zone marker and Unfinished Auction Close plots hold a price only on the bar where the event occurs. Nearest Unfinished Auction Above and Below return the nearest untouched level above the current bar’s high and below its low. MFE/MAE plots return the median MFE/MAE ratio for the corresponding window.
Plot output names are technical identifiers intended solely for software integration purposes and do not constitute trading advice, signals, or recommendations.
System Requirements & Installation
What you need to run the indicator, how to download and install it in NinjaTrader 8, and how the license works.
System Requirements
- Platform
- NinjaTrader 8 (Desktop)
- Operating system
- Windows 10 or Windows 11
- Instruments
- Futures, forex, stocks and ETFs supported by NinjaTrader
- Data
- NinjaTrader’s native data connections
Not available on NinjaTrader Web or Mobile. NinjaScript indicators run in NinjaTrader Desktop only.
License Terms
- Lifetime License
- This indicator only, 1 PC, one-time payment, free updates included.
- All-Access Subscription
- All indicators and trade copiers, billed monthly, cancel anytime, updates included while the subscription is active.
- Free trial
- 5 days on the subscription plan. If not cancelled, the subscription starts automatically.
- License binding
- Linked to your email and to the computer on which it was first activated.
- Moving to another computer
- Available on request through support.
Installation
- Get access
Start the free trial, subscribe, or buy a lifetime license on this page.
- Download
The indicator is not sent by email. Open (top right of this page) and enter the email you used for your trial, subscription or purchase. The installation file (.zip) downloads to your computer.
- Import into NinjaTrader 8
In the Control Center, go to
Tools → Import → NinjaScript Add-Onand select the downloaded .zip file. Do not unzip it. - Add to a chart
Open a chart, click Indicators, select the indicator from the list and apply it.
- Activate the license
In the indicator settings, enter the same email. On first activation, the license is linked to that email and to your computer.
Updating: When a new version is released, download it again through and import it the same way over the existing version.
Installation questions? Contact support, Monday to Friday.
Related Products
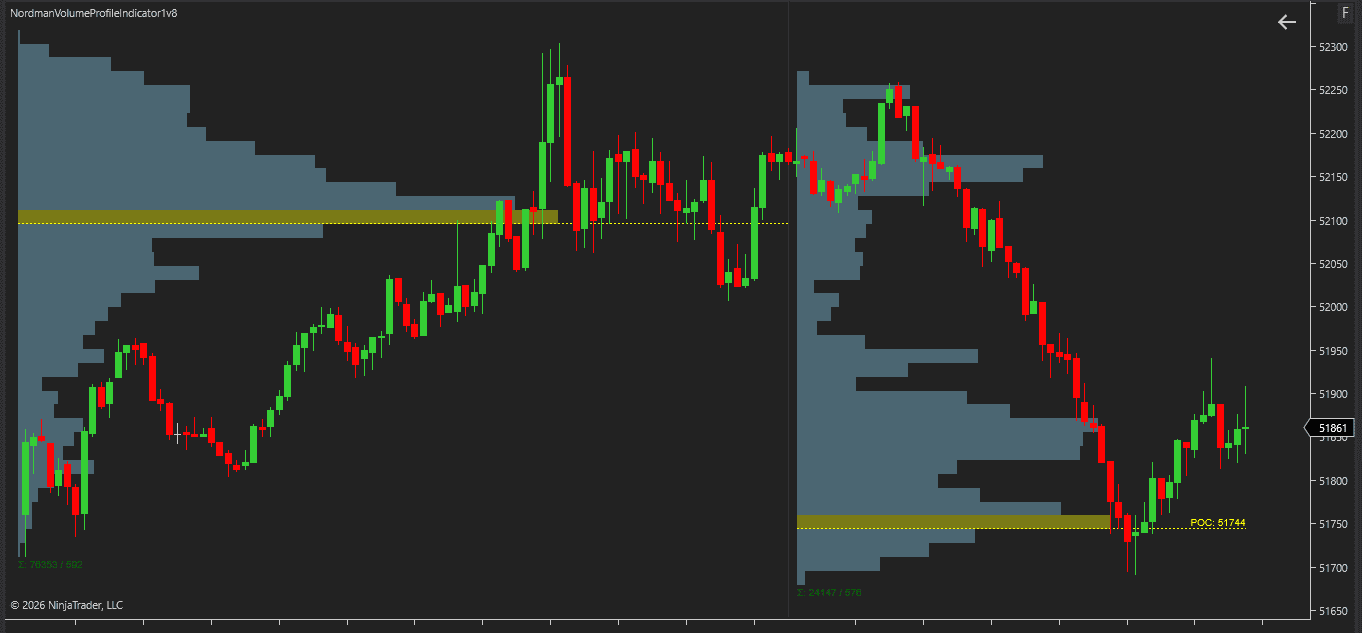
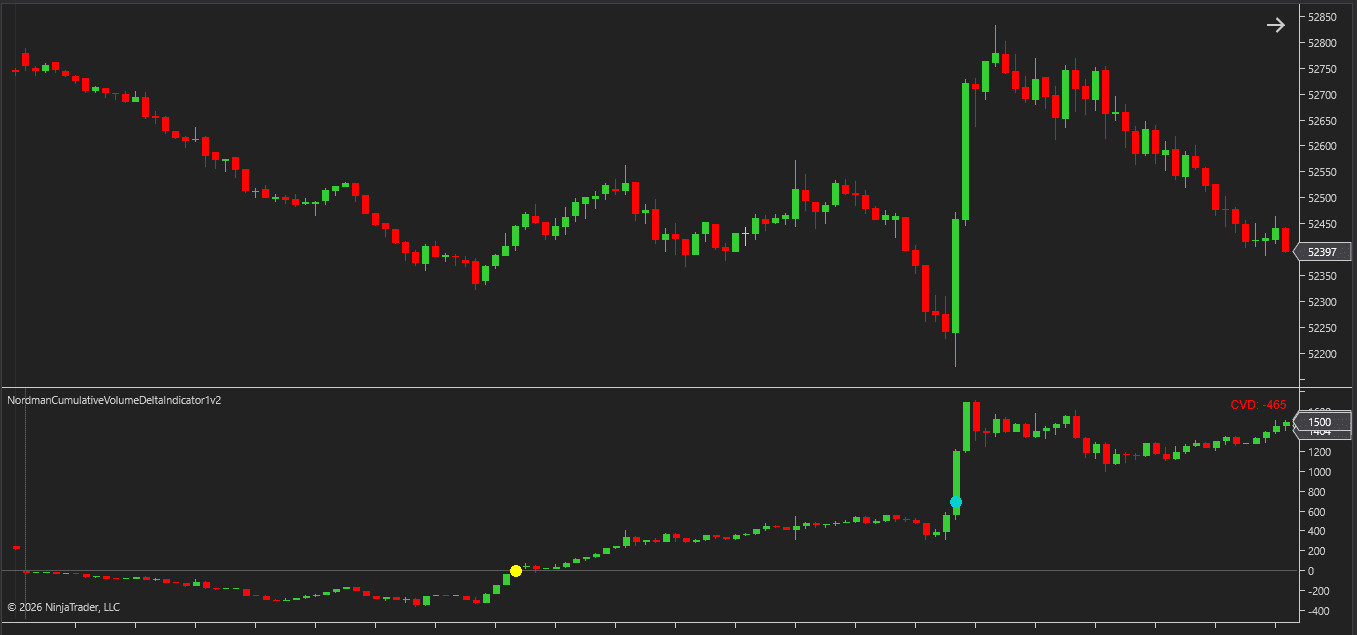
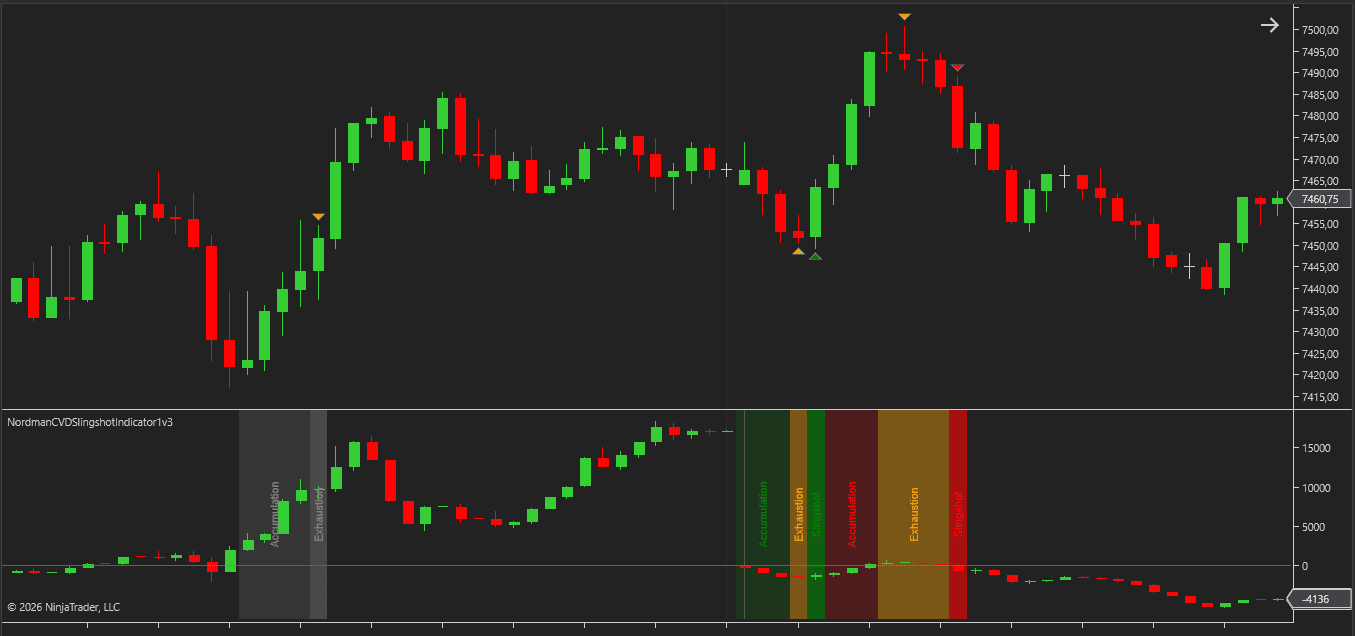
"Best Seller" and "Trending" reflect Nordman Algorithms sales and usage data, January–September 2026.
Disclaimer — Software Use & Risk Disclosure
Nordman Algorithms is a trade name of Nordman Algorithms OÜ (Reg. No. 14435535), registered in Tallinn, Estonia.
Software Use
Software Nature & User Responsibility — Nordman Algorithms provides algorithmic software tools for technical analysis. Nordman Algorithms is not a financial advisor and is not liable for any losses. All trades conducted based on the software’s output are executed at the user’s sole discretion and risk.
Visual Markers & Signal Disclosure — This software may display visual markers (such as arrows, dots, or alerts) when predefined mathematical conditions are met. These markers are provided for educational and analytical purposes only, must not be interpreted as financial guidance, and do not constitute a recommendation to buy, sell, or hold any financial instrument. Users must independently validate all visual cues within their own trading methodology.
No Financial Advice — Nordman Algorithms does not provide discretionary trading signals, investment advice, or managed signal services. Our software represents a mathematical visualization of historical and real-time data. The appearance of a visual marker does not guarantee a profitable trade or predict future market behavior.
Read the full Terms of Service →Risk Disclosure
Trading Risk Warning — Futures, Forex, and options trading involve significant risk. Risk capital is money that can be lost without jeopardizing financial security. Only risk capital should be used for trading. Past performance is not indicative of future results. An investor could potentially lose all or more than the initial amount committed.
ESMA Risk Warning — Financial instruments, especially those involving leverage such as CFDs and Forex, are complex and carry a high risk of rapid financial loss. Our software provides analytical outputs and visual markers based on predefined mathematical conditions and does not mitigate or reduce inherent market risks. You should carefully consider whether you understand how leveraged financial instruments work and whether you can afford the high risk of losing your capital.
CFTC Rule 4.41 — Hypothetical or simulated performance results have inherent limitations. Unlike actual performance records, simulated results do not represent real trading. Because trades have not actually been executed, these results may under- or over-compensate for the impact of market factors such as liquidity. Simulated results are also subject to the benefit of hindsight. No representation is being made that any account will achieve profits or losses similar to those shown.
Read the full Risk Disclosure →Trademark Notice — NinjaTrader® is a registered trademark of NinjaTrader Group, LLC. No NinjaTrader company has any affiliation with the owner, developer, or provider of the products or services described herein, or any interest, ownership or otherwise, in any such product or service, or endorses, recommends or approves any such product or service.
Need a different setup?
We can customize this indicator to your workflow, or convert it into a fully automated trading strategy with risk management and trailing-stop logic. Fixed-price quote before development begins.