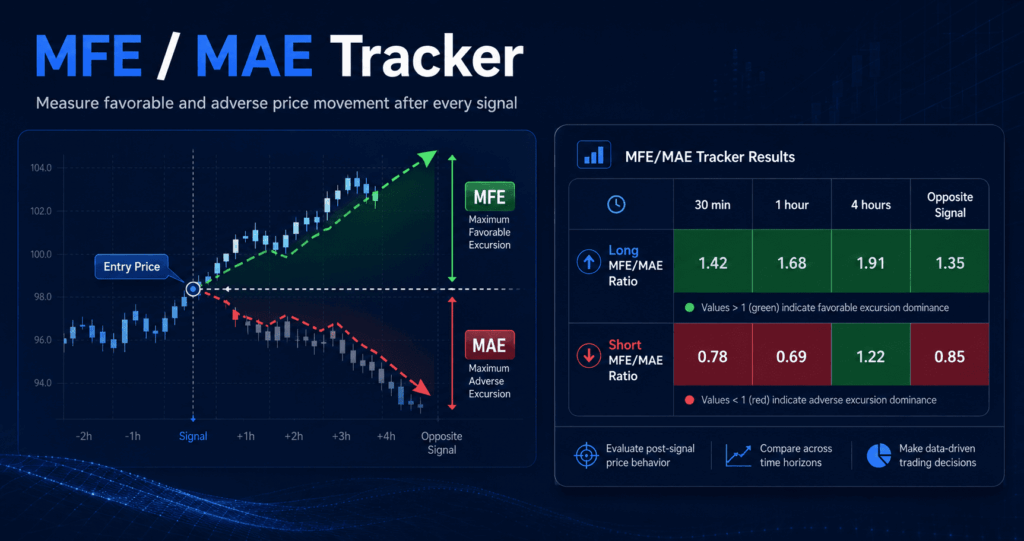
A signal fires. Price moves. Some of that movement works in your favor, some works against you — and by the time you glance back at the chart, all you remember is where price ended up. The MFE/MAE Tracker keeps the part memory skips: how far price swung in each direction, for every signal, across every holding period you care about.
This guide covers what the tracker measures, exactly how it’s calculated, how to read the dashboard, and — just as important — what it doesn’t tell you. It applies to every Nordman Algorithms indicator that includes the module; the settings and dashboard are identical across all of them.
Most indicators tell you when a signal occurred. They rarely tell you what happened to price afterward — how far it moved in your favor, how far it moved against you, and how that balance shifts across different holding periods. MFE/MAE analysis fills that gap.
None of this replaces a full backtest or live testing. It’s a diagnostic layer that shows what price actually did around a signal, so decisions about targets, stops, and holding time are based on observed behavior rather than assumption.
MFE (Maximum Favorable Excursion) is the largest move price makes in the direction of the signal before the observation period ends — the best unrealized outcome the signal produced.
MAE (Maximum Adverse Excursion) is the largest move price makes against the direction of the signal over the same period — the worst unrealized drawdown the signal produced before the observation ends.
Both are measured from the same reference point: the Close of the bar on which the signal is confirmed. Together, they describe the full range price moved through — not just where it ended up, but how far it swung in each direction along the way.
MFE/MAE Ratio = MFE ÷ MAE, for a single observation. A ratio above 1 means the favorable excursion was larger than the adverse one; below 1 means the opposite. Individual ratios are then aggregated using the median across all completed observations — not an average of MFE and MAE (see Dashboard below for why that distinction matters).
Each observation uses the Close of the bar on which the signal is confirmed as its Entry Price. Every subsequent measurement — MFE, MAE, and the resulting ratio — is calculated relative to this single fixed value; it does not shift as the observation progresses.
Once an observation starts, the tracker follows price on every subsequent bar (at minute or tick precision, depending on the Calculation Precision setting). Tracking begins from the moment the signal is confirmed — the signal bar’s own High and Low are not included, since they occurred before the Entry Price was established.
Both values are updated on the same pass, from the same stream of price data, for the entire life of the observation — MFE and MAE are two sides of the same continuously tracked price range, not calculated separately or at different points in time.
Internally, once an observation closes:
MAE is always a non-negative distance regardless of direction — it represents the magnitude of the adverse move, not a signed loss. These raw values are used internally to calculate the ratio; the dashboard and CSV export show the resulting MFE/MAE Ratio, not the underlying distances themselves.
Using the high and low of each bar, rather than only the close, captures intrabar extremes that a close-only calculation would miss. A signal can be followed by a sharp move that reverses before the bar closes — if only closing prices were checked, that excursion would never be recorded, even though it actually happened.
Calculation Precision affects a different part of the picture: Minute precision uses the High and Low of the 1-minute price bar, which already captures the full price range within that bar. Tick precision doesn’t necessarily push MFE or MAE further — its advantage is more exact timing: precise observation boundaries and event order, which matters most for periods shorter than a minute or signals that occur mid-bar.
Every time the indicator produces a signal, the tracker starts a separate observation for each enabled period at once — fully independent observations running in parallel from the same entry point, not one observation checked at different intervals.
Independent observation, own MFE/MAE.
Not an extension of the 30 min observation.
Runs in parallel from the same signal.
Closes on the next opposing signal instead.
This matters because the numbers shown for each period are not cumulative or dependent on each other: a signal can show a strong ratio at 30 minutes and a weak one at 4 hours (or the reverse), and both figures are equally valid, independent readings of the same signal at different time horizons.
This also applies across signals on different bars. If a new signal appears while observations from a previous signal of the same direction are still running, both sets of observations continue independently — the tracker does not merge them, restart them, or let one interrupt the other. For each bar, however, the tracker creates only one set of observations per signal direction — repeated signals in the same direction on that bar do not start another set.
The MFE/MAE Tracker settings appear as a dedicated group in the indicator’s parameters panel. What each field controls, in the order they appear:
| Setting | What it does |
|---|---|
| Enable Tracker | Turns the entire module on or off. When disabled, no observations are created and the dashboard table is not drawn. |
| Enable Opposite Signal | Adds an extra observation type per signal that closes when a signal in the opposite direction appears, instead of after a fixed period. |
| Calculation Precision | Minute or Tick. Tick provides more exact observation boundaries and preserves intrabar event order; Minute is lighter on resources. Historical tick data availability depends on your data provider and may cover a shorter lookback than minute data. |
| Period 1–4 | Up to four independent observation windows, each with Enable, Type (Seconds / Minutes / Days), and a duration field matching the selected Type. |
| Track Long / Track Short Signals | Controls which signal direction the tracker follows. Disabling one stops the tracker from creating observations for that direction, without affecting the other. |
| Table Width (%) / Table Font Size | Visual sizing of the dashboard table drawn on the chart. |
Period duration is calendar elapsed time, not limited to active market hours — a 1-day period started late on a Friday will reach its configured end time during the weekend. Since there’s no price data to check during that gap, the observation closes on the next available price update once the market reopens. With Minute precision, a period shorter than one minute (e.g. 30 seconds) closes on the next available minute update rather than at the exact second — for sub-minute periods, Tick precision gives a more exact result.
Once the tracker is enabled, a table is drawn directly on the chart, showing the aggregated results for all completed observations.
The table has two rows — Long MFE/MAE Ratio and Short MFE/MAE Ratio — populated independently based on the Track Long/Short Signals settings. Each column corresponds to one enabled period, plus an “Opposite Signal” column if enabled. Columns for disabled periods are not shown.
Each cell shows the median MFE/MAE Ratio for that direction and period, color-coded for a quick read:
The calculation is cumulative, with no time limit and no rolling window: every completed observation is added to the running total and stays there — nothing is dropped as new observations come in. The figure keeps building from whatever chart history was loaded when the tracker started, plus everything that happens in real time afterward, until the settings are changed (see FAQ below).
How the ratio is calculated: Ratio = Median(MFE₁/MAE₁, MFE₂/MAE₂, …, MFEₙ/MAEₙ) For every completed observation, an individual MFE/MAE ratio is calculated first — only after that does the tracker take the median across all of those individual ratios. This differs from dividing a median MFE by a median MAE, and makes the displayed value less sensitive to isolated extreme observations than an arithmetic mean would be. If an observation has no adverse movement at all, an internal epsilon value is used as the denominator instead of zero, so the ratio stays a very large finite number rather than becoming undefined — such observations are not excluded from the median. In the rare case where price hasn’t moved in either direction (MFE and MAE both zero), the ratio comes out as zero.
Export. A small export control next to the table saves the current results to a CSV file: the same Ratio values shown on the dashboard (all periods, both directions), together with a full dump of the indicator’s settings at the time of export. The underlying MFE and MAE distances behind each ratio, and individual observations, are not included in the export — the CSV mirrors the dashboard table, not the raw data behind it.
A median MFE/MAE Ratio above 1 means that, across the observations measured, favorable price movement following a signal has tended to be larger than adverse movement, on a median basis. It describes the shape of price behavior after a signal — it does not account for entry timing, exit execution, position management, or trading costs, all of which affect whether that favorable movement is actually captured. See Limitations below.
Looking at the ratio across multiple periods for the same direction shows how the balance between favorable and adverse movement shifts over time. A ratio that is strong at 30 minutes but weaker at 4 hours suggests the balance is stronger earlier in the observation window; further testing would be needed to determine whether a shorter holding period improves actual results. A stronger ratio at longer periods suggests the balance improves as the observation develops, but doesn’t by itself establish an optimal holding time.
Because the two rows are tracked independently, they often don’t move together. A signal type that performs well on the long side isn’t guaranteed to perform the same way on the short side — checking both rows before treating a signal as symmetric across directions avoids relying on an assumption the data may not support.
Unlike the fixed periods, the Opposite Signal column reflects how price behaved from the original signal until the indicator produces a signal in the opposite direction, rather than over a fixed time window. When that opposite signal appears, it closes every still-active Opposite Signal observation of the direction it’s replacing — fixed-period observations are unaffected and keep running independently on their own schedule.
The Ratio doesn’t give you an absolute price distance to set as a target or stop — it only shows the balance between favorable and adverse movement, not how large either one was in price terms. What it’s useful for is a relative read: comparing that balance across periods and directions helps judge whether a longer hold tends to help or hurt, or whether a signal’s profile differs meaningfully between long and short. Sizing an actual target or stop distance still requires your own analysis of price movement on the instrument you’re trading.
A ratio calculated from a small number of completed observations carries less weight than one built on a large sample — treat early or sparse results with proportionally more caution. The calculation is cumulative and has no time limit: it keeps accumulating every completed observation from whenever the tracker started, with nothing aged out or dropped, so the figure you see mixes old and recent signals together rather than reflecting only recent behavior. Ratio values also reflect the instrument, chart data, loaded history, and settings (including Calculation Precision) used at the time; figures from different charts or setups aren’t directly comparable unless that context matches. Neither the dashboard nor the CSV export currently shows the number of observations behind a given ratio.
MFE/MAE analysis measures how price moved after a signal — it does not simulate a trading strategy. To interpret the results correctly, it’s important to understand what the tracker does not account for:
Because of this, MFE/MAE Ratio should be read as a description of price behavior following a signal — useful for comparing signals, periods, and directions against each other — rather than as a projection of what a specific trading strategy, with its own entry, exit, and risk management rules, would have achieved.
Yes. Every enabled period (up to four, plus Opposite Signal if enabled) starts its own observation the moment a signal appears, and all of them run in parallel. They don’t share data or depend on each other.
If it’s on a different bar, both sets of observations continue independently — a new signal of the same direction does not cancel, restart, or merge with observations already running from an earlier signal. On the same bar, only one set of observations per direction is created; a repeated signal of the same direction on that bar does not start another set.
An empty (white) cell means no observations for that direction/period combination have completed yet — expected for longer periods shortly after the tracker is enabled, or for signal types that occur infrequently.
Yes. The tracker processes signals found within the history currently loaded on the chart, using the available historical price data. Available lookback depends on the loaded chart data and, for Tick precision, on how much historical tick data your data provider supplies.
Because the ratio only measures how favorable movement compared to adverse movement after a signal — it says nothing about whether that movement would actually have been captured by a real position, given entry timing, exit rules, commission, slippage, spread, and other execution factors.
No. Only completed observations are included in the median shown. Active observations continue updating internally but don’t affect the displayed value until they close.
The tracker recalculates from scratch using the new settings — results from before the change aren’t mixed in with results after it.
This article describes how the MFE/MAE Tracker module is calculated and displayed. It is provided for informational purposes and does not constitute trading advice. MFE/MAE Ratio reflects historical price behavior around signals and does not account for commission, slippage, spread, or real order execution — see Limitations above. Past price behavior is not indicative of future results.