Most volume setups on NinjaTrader 8 are assembled by accident. A trader arrives from TradingView, the way one did on the NinjaTrader forum last summer: “I’ve been trying to make things work with this on TradingView to no avail. That’s what turned my attention here” (newson, NinjaTrader forum, Jun 2025). He installs a Volume Profile because a thread recommended it. It helps, for a while. Then he notices the profile shows where volume piled up but not who was in control, so he adds a Footprint from another vendor. Then a free VWAP from a community post. Then an Anchored VWAP found somewhere else.
Now your chart has four overlays from three sources, and they disagree. The VWAP classifies volume by UpDownTick while the Footprint runs on BidAsk. The Value Area on the profile doesn’t match the Value Area inside the Footprint because they use different thresholds. CPU load spikes on an NQ tick chart and the free VWAP repaints on rollover day. A year later another member summed up the DIY route in one line: “I got frustrated today, because its not as nice as tradingview. The feel/coding takes time to get it ok” (ChartMechanic, NinjaTrader forum, Jun 2026).
That is the indicator-stack problem, and it costs you more than the licences. In this article I’ll show you the five questions you need answered as an intraday volume trader, and which tool answers each. Then the three hidden costs of assembling them piecemeal. Then how the five layers chain together on one ES session, read on real screenshots. And finally the bundle that packages them, with the price table and an honest “not for you” list.
Intraday volume analysis on futures is not one task. It is five separate questions, each needing its own data layer. Skip one and you trade with a blind spot you can’t see.
If the profile itself is new to you, Volume Profile Explained covers the POC and the Value Area, and What Is a Virgin POC walks through the untouched-level trade on real screenshots.
The obvious cost is your money. Five indicators from five vendors run you from about €500 to over €1,000 depending on licence terms. Three hidden costs are worse.
| Hidden cost | What happens | What it does to your read |
|---|---|---|
| Classification conflicts | One tool classifies volume by BidAsk (trade-level data, needs tick replay), another by UpDownTick (direction inferred from tick movement) | The POC on your profile doesn’t sit where your Footprint shows the heaviest flow. Two maps of the same ground that disagree on where the mountains are. |
| CPU and data overhead | Each vendor’s indicator opens its own data subscription and calculation engine | Three engines on your NQ 5-minute chart push memory up, and rendering lag appears exactly when the tape is fastest. A shared pipeline runs once. |
| No cross-indicator logic | Tools from different vendors can’t reference each other’s series | “Signal a breakout only when VWAP agrees” means writing NinjaScript. Indicators built as a system expose their plots to BloodHound, BlackBird or your own strategy without code. |
| Order Flow+ lock-in | NinjaTrader’s own suite (profile, footprint, VWAP, delta) requires the Lifetime platform licence | Third-party volume tools run on any NT8 licence tier, including Free and Lease, so the platform cost stays your choice. |
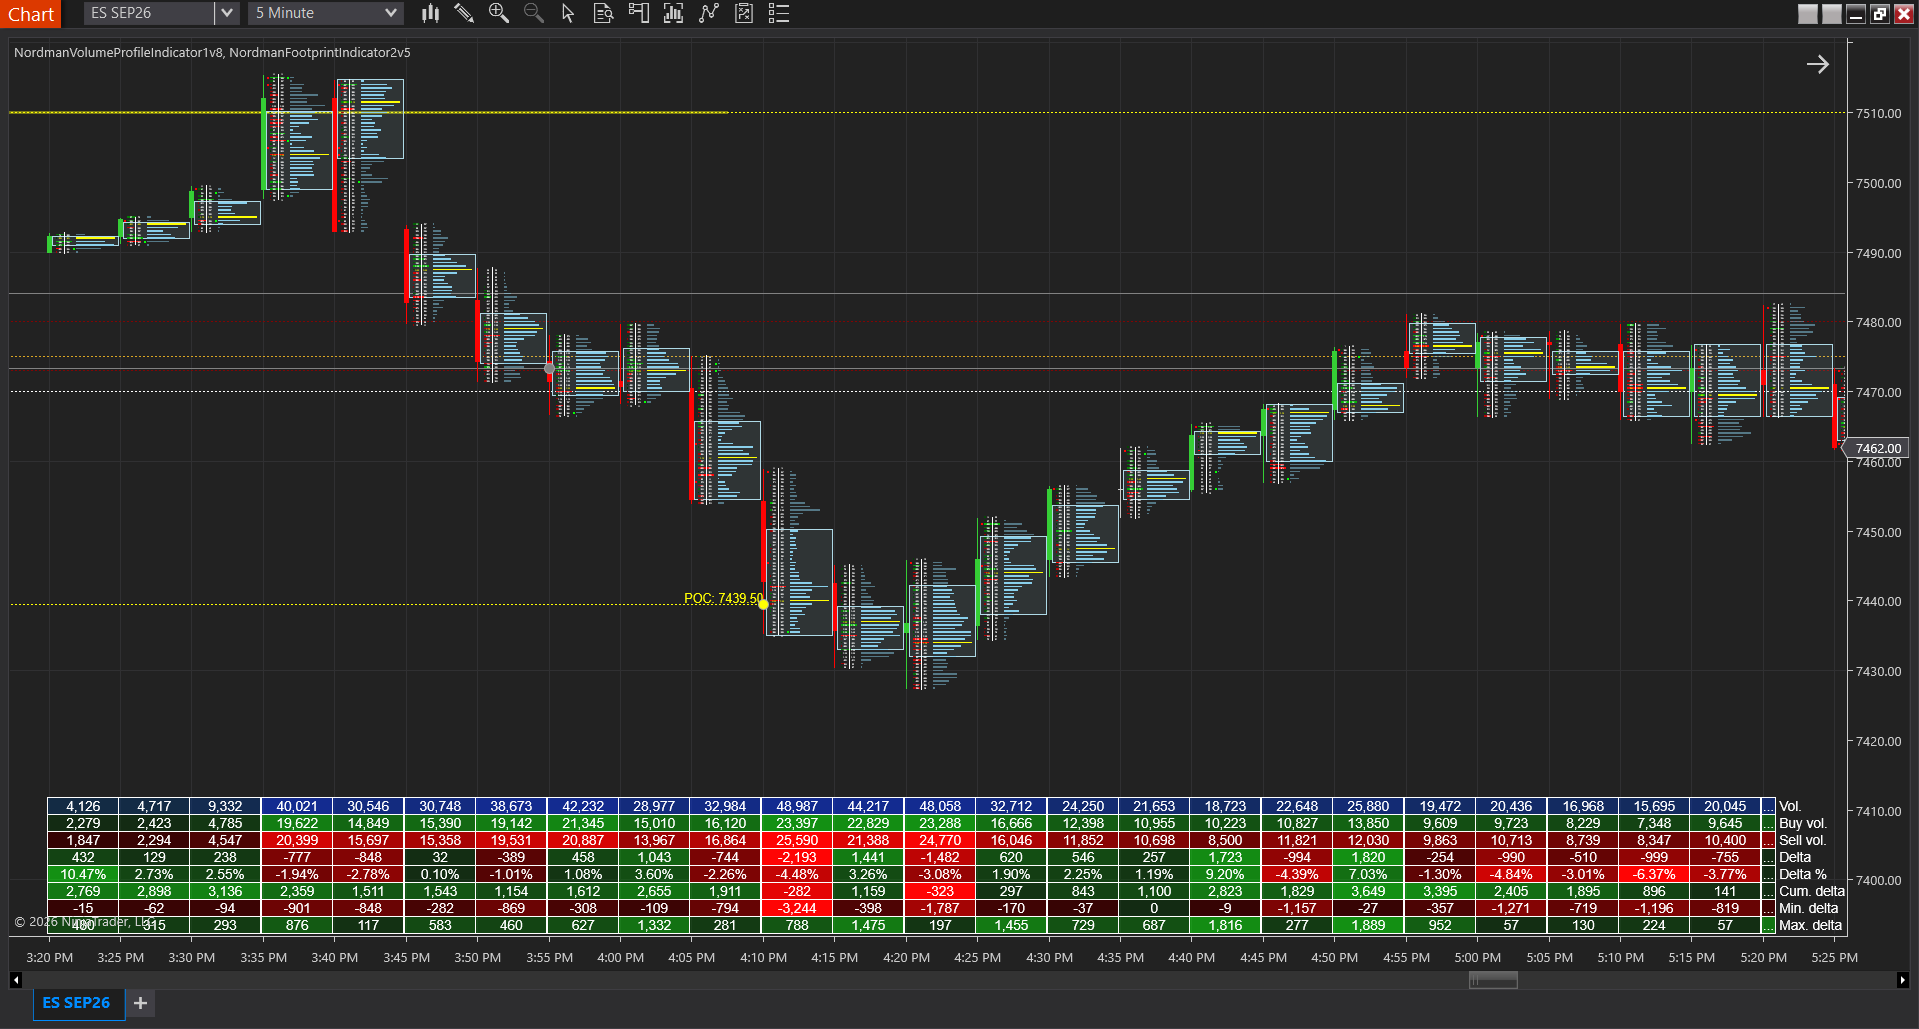
Here is how the five layers chain on an ES 5-minute chart through a regular session. The screenshots are from the indicators below. The prices are the session’s, the rules are what you keep.
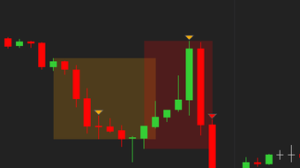
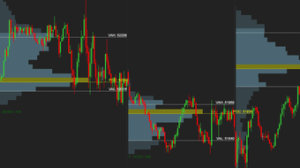
The session opens and your profile starts building the day’s histogram. Inside the first thirty minutes the developing POC and Value Area take shape, and you can see whether the opening range is forming inside yesterday’s value, which suggests balance, or outside it, which suggests intent. Then price comes back to a Virgin POC from a previous session, a heavy level that has never been retested. You don’t act on the touch. You open the Footprint on that bar and read the order distribution at the level.
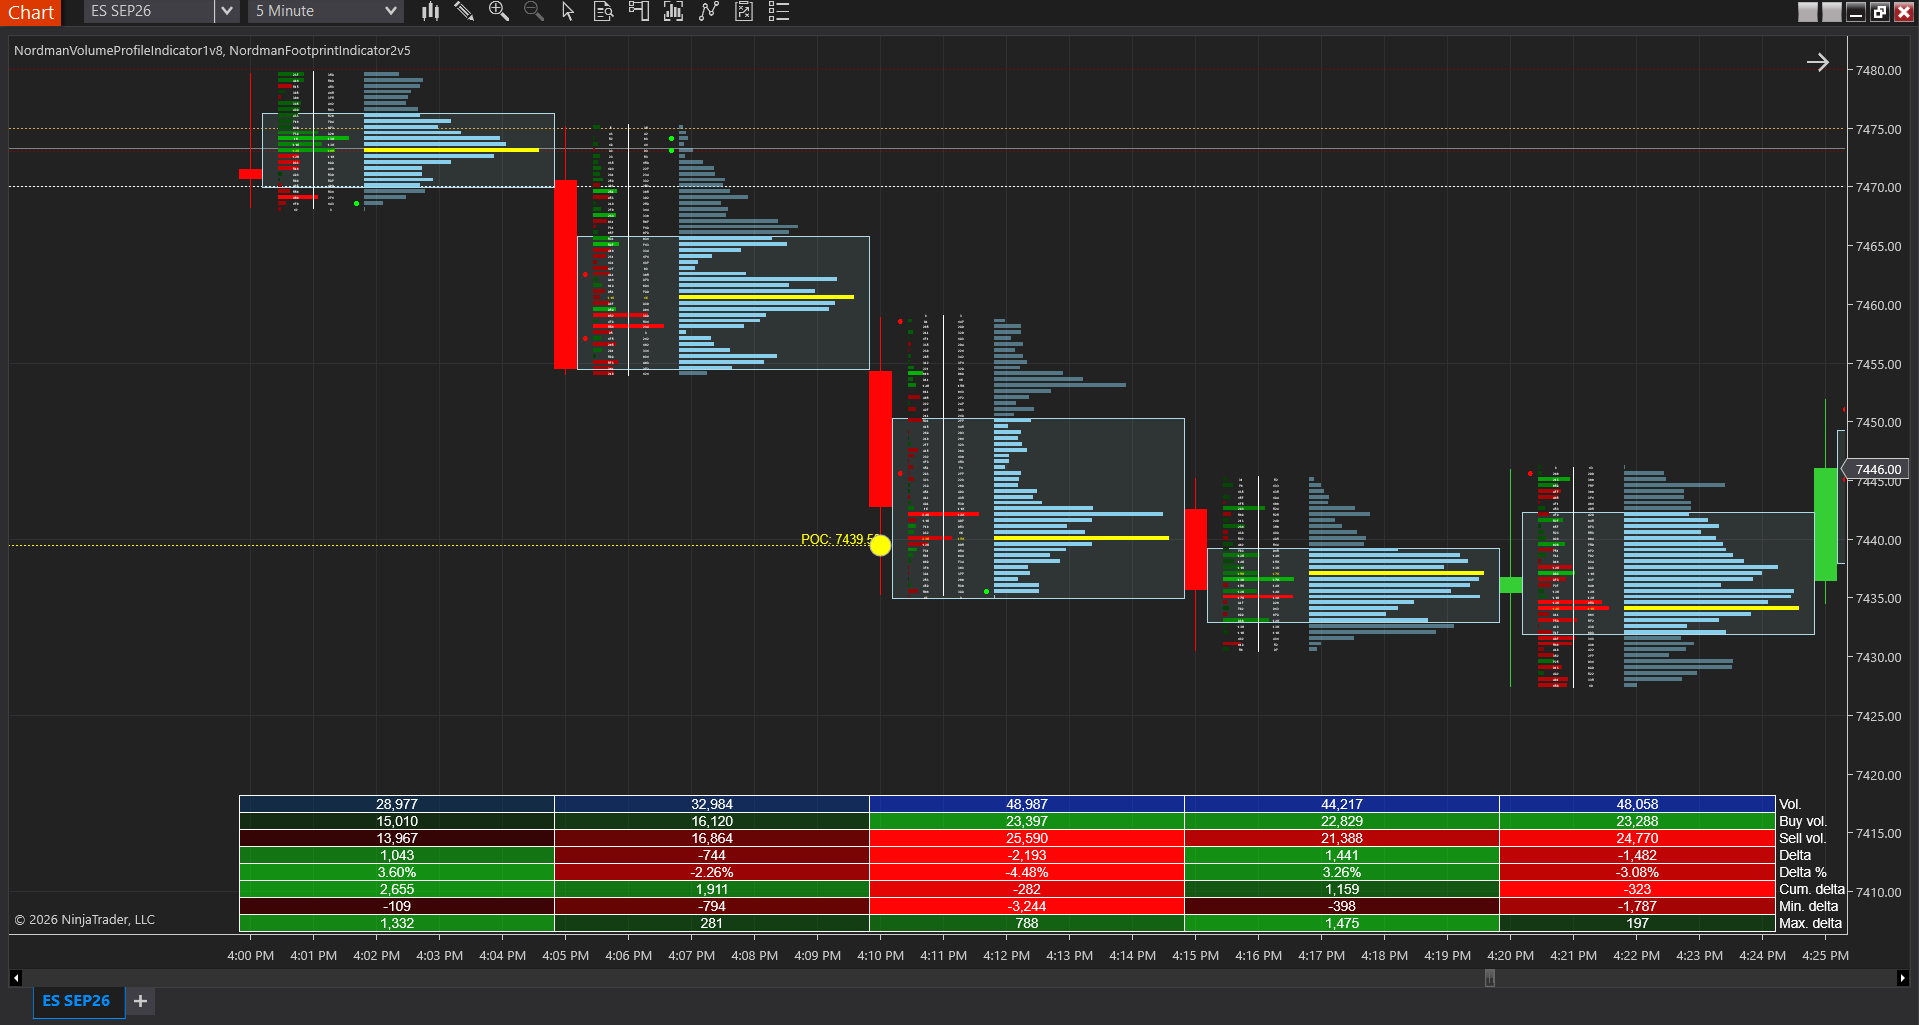
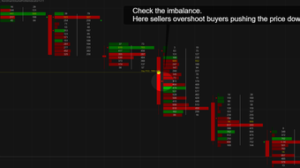
On this chart the Footprint marks diagonal bid imbalances at the level: sellers hitting the bid outnumber buyers lifting the ask, several levels in a row. The Virgin POC is being sold into, not defended. That is your short, with your stop above the imbalance cluster and your first target below, in the low-volume area the profile shows under the level. Had the imbalances been on the ask side, the same touch would have been your long. The tool tells you which. The level alone does not.
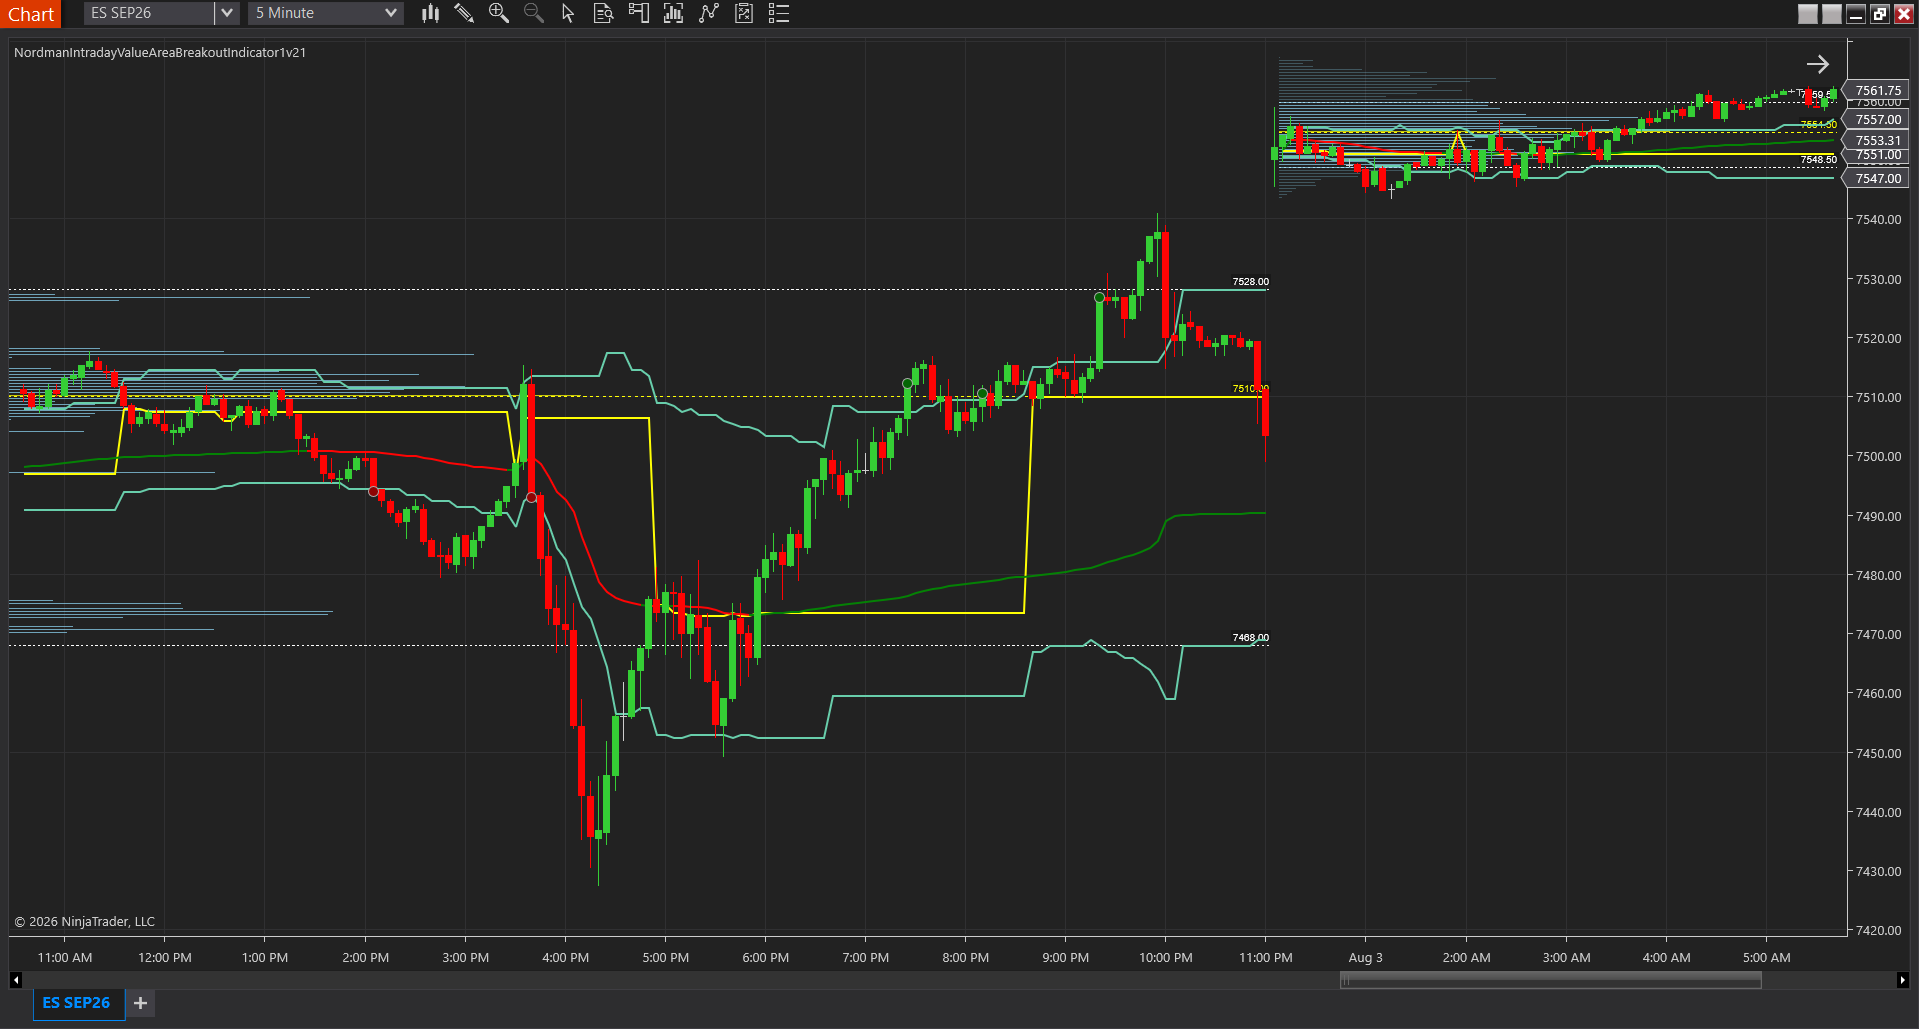
An hour later the Value Area Breakout flags a bar closing below VAL. Before you add, you check VWAP: price is under the volume-weighted average and the line is sloping down, so the break has the session’s participants behind it. In Locked mode the signal waited for the close, which filtered the wick that poked through VAL mid-bar.
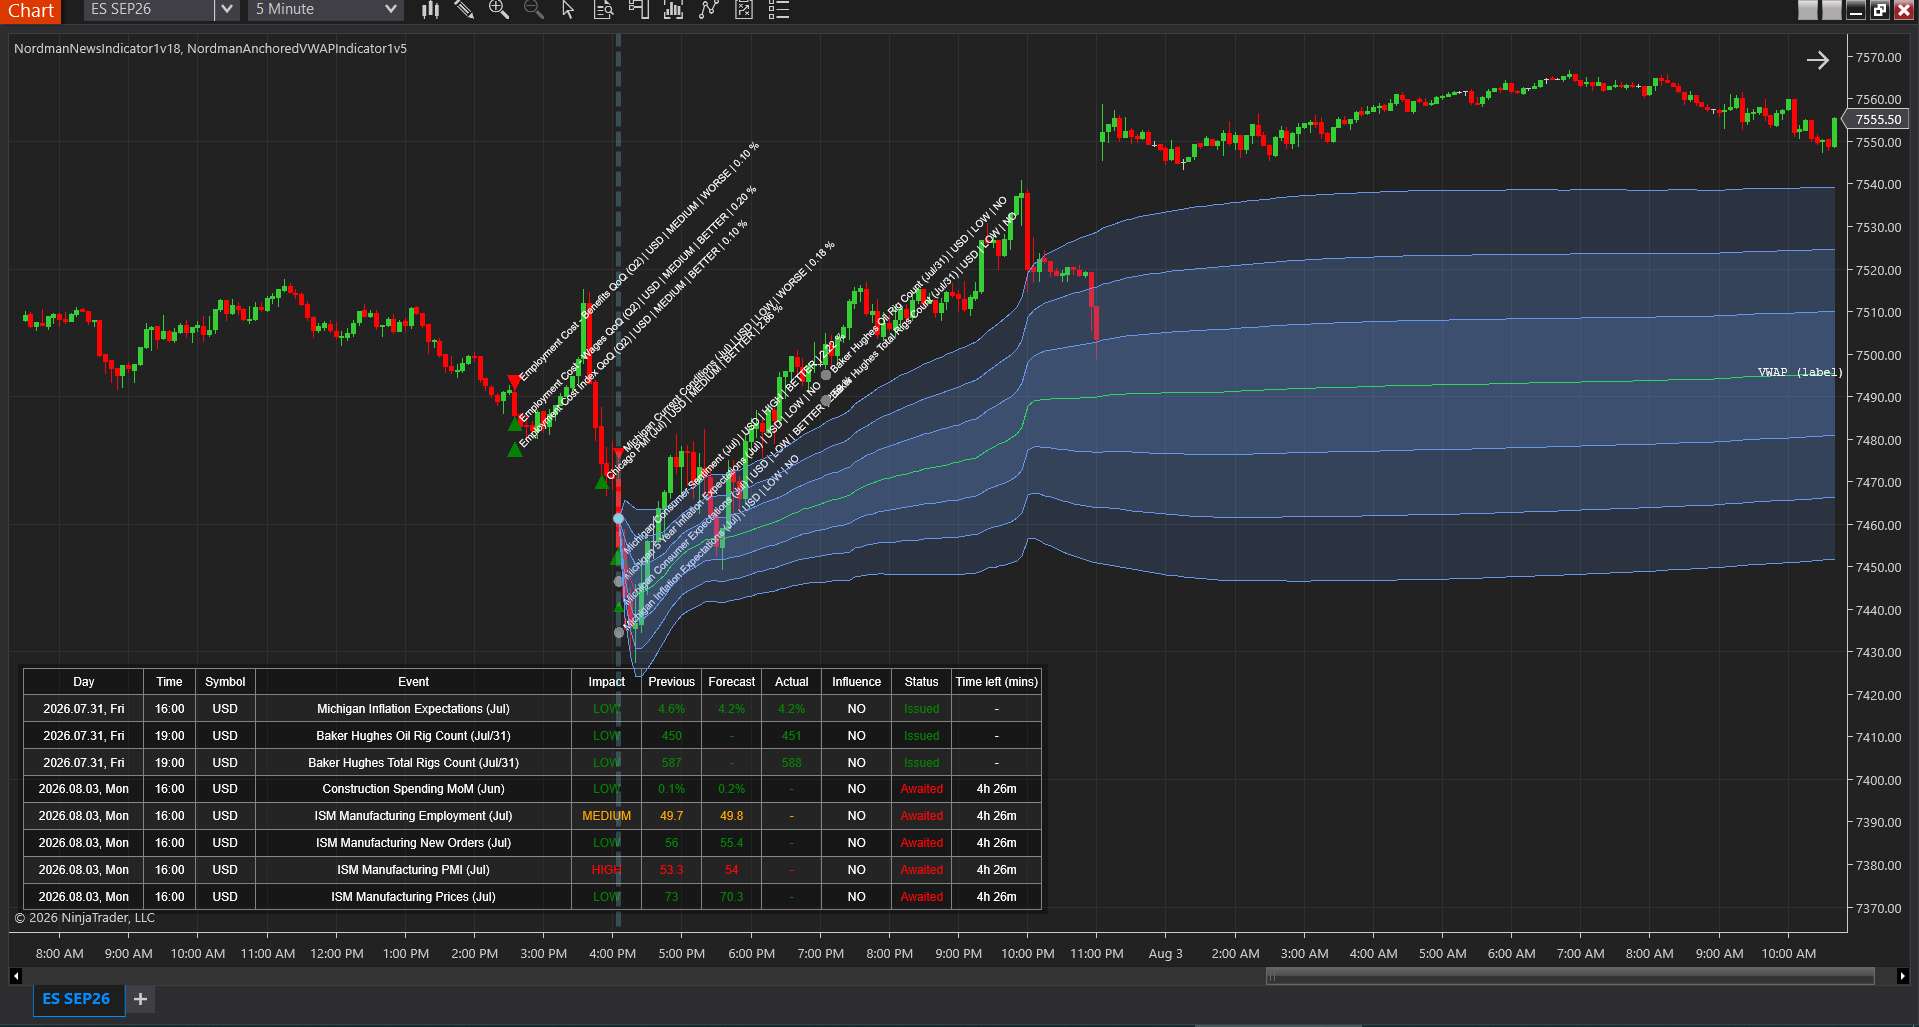
Then a release hits and price moves vertically. You anchor your VWAP to the first bar of the impulse. From now on that line is the average price at which the event’s participants entered. Twenty minutes later price pulls back to it and holds. The traders who came in on the number are still in control, so you stay in and trail the stop to the first deviation band. No trendlines, no shapes. Each of your decisions was confirmed by a different volume layer, and each layer answered a different question.
The Volume Trader Bundle packages the five indicators above under one lifetime licence. They share one volume classification architecture, BidAsk and UpDownTick across the board, so your profile and your Footprint agree. Every one of them exposes its series as analytical plots for BloodHound, BlackBird or your own NinjaScript strategy.
| Indicator | Standalone | In bundle |
|---|---|---|
| Volume Profile — POC, Virgin POC, Value Area, Initial Balance | €225 | €180 |
| FootPrint OrderFlow — cluster volume, bid/ask analysis, delta | €225 | €180 |
| Intraday Value Area Breakout — range-breakout signals, VWAP filter | €200 | €160 |
| Anchored VWAP — event-based volume-weighted average | €150 | €120 |
| VWAP — session average with 3 deviation bands | €150 | €120 |
| Total, all five | €950 | €760 |
One-time purchase, lifetime licence, free updates, priority support. Ready-made chart templates are included. You install all five, load the template, and the layout above is on your chart.
It is built for you if you trade futures intraday on NinjaTrader 8: ES, NQ, MES, MNQ, gold, crude or currencies. You want the five layers to agree with each other instead of assembling them from five sources. It is also for you if you automate with BloodHound or BlackBird and want POC touches, Value Area breaks, VWAP deviations and imbalance signals as inputs without writing calculation code.
It is not for you if you swing trade for days off daily charts. Your broker’s built-in charts already cover that horizon, and tick-level granularity buys you nothing there. It won’t fix your losing strategy. If sizing or discipline is the problem, five more tools on your chart change nothing. And it is a poor fit for spot Forex without exchange volume, where the broker’s tick volume is a proxy that weakens both the deviation bands and the imbalance read compared with CME data.
If that’s you, the five questions above are still the right map. Close the tab and keep the €760.
See the Volume Trader Bundle →
Need a sixth layer, or the five wired into your own strategy? We develop NinjaScript to order → NinjaTrader developers
Nordman Algorithms provides software infrastructure for trade automation and does not offer financial advice, trading signals, or managed trading services. This article is for informational and educational purposes only. The trade sequence above is illustrative and is not a record of results. Forum quotations are reproduced verbatim from public threads for illustration and do not constitute endorsement. Trading leveraged instruments such as Forex, CFDs and futures carries a high level of risk and may not be suitable for all investors. Only risk capital should be used. Full Risk Disclosure: https://www.nordman-algorithms.com/risk-disclosure/