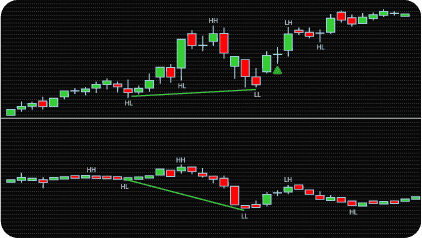
CVD Trapped Traders Concept Explained
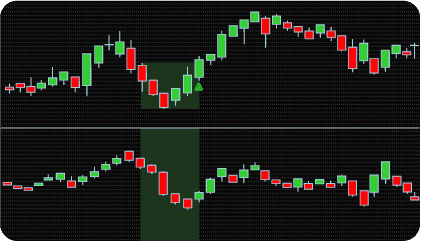
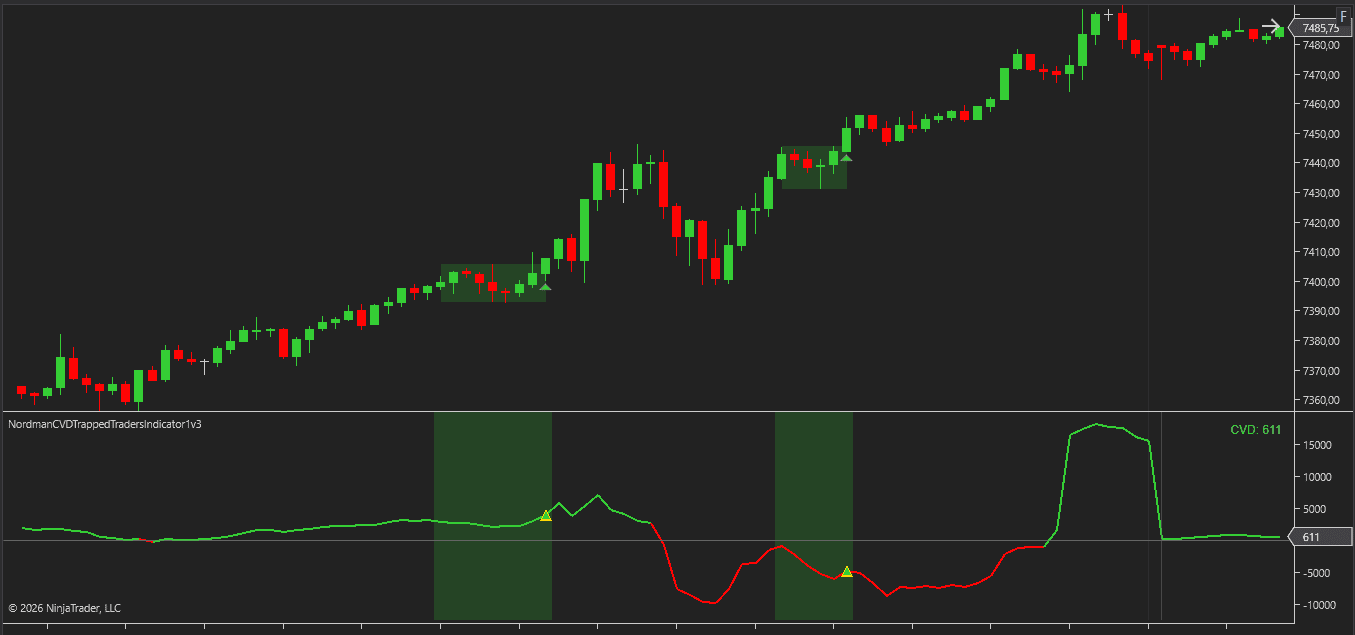
The NinjaTrader CVD Trapped Traders Indicator looks for aggressive CVD pressure that fails to move price with the same strength.
Strong positive delta reflects aggressive buyers; strong negative delta reflects aggressive sellers. The key is how price responds. When directional CVD pressure builds but price makes limited progress, some of those aggressive traders may be trapped.
The indicator first registers a Potential Trap and records the price range where the pressure developed.
Potential Trapped Buyers form when strong buying pressure produces limited upside progress and are confirmed by a later close below the formation range.
Potential Trapped Sellers use the opposite logic: strong selling pressure produces limited downside progress and are confirmed by a close above the formation range.
The result is a two-stage pattern: CVD pressure fails to move price efficiently, then price breaks against the aggressive side.
NinjaTrader CVD Trapped Traders Indicator — Key Features
Trapped Traders Detection & Advanced Detection
The detector combines directional CVD pressure, price response, and a later price break to identify Trapped Buyers and Trapped Sellers setups.
Detect Trapped Sellers (Bullish) and Detect Trapped Buyers (Bearish) can be enabled independently.
Pressure Window defines how many completed bars are analyzed together. Larger windows capture broader pressure sequences; smaller windows focus on more compact formations.
Minimum Normalized Pressure sets how strong net CVD pressure must be relative to recent delta activity. Higher values require stronger pressure before a formation qualifies.
Minimum Directional Consistency filters out formations where buying and selling are too mixed. Higher values require a larger proportion of one-sided delta activity within the Pressure Window.
Maximum Price Response limits how far price can move in the same direction as the CVD pressure. Lower values require a stronger disconnect between CVD pressure and price movement.
Delta Baseline Period defines the recent delta baseline used for pressure normalization, while ATR Period provides the volatility reference for Price Response.
After a Potential Trap appears, Confirmation Max Bars sets how long price has to confirm it. Minimum Formation Break (Ticks) defines how far the closing price must move beyond the Formation Zone before confirmation.
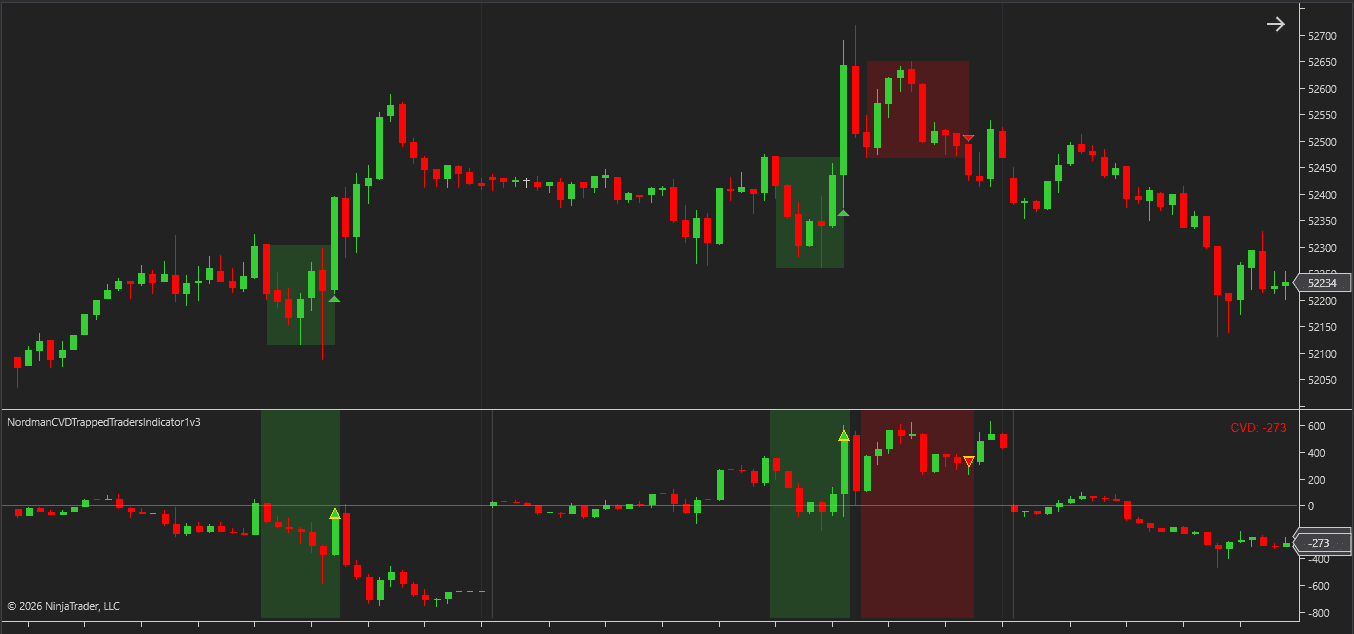
Potential & Confirmed Traps with Formation Zones
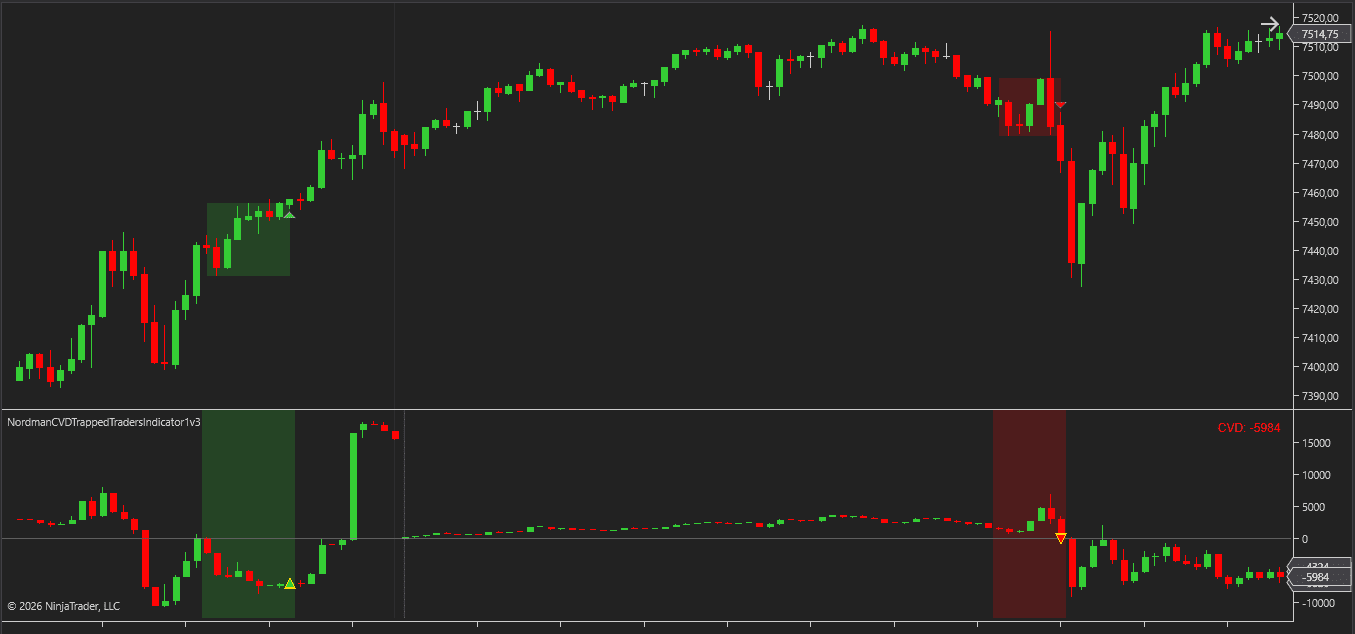
A Potential Trap appears once the required pressure, consistency, and price-response conditions are met. It indicates that aggressive traders may be trapped, but price has not confirmed the setup.
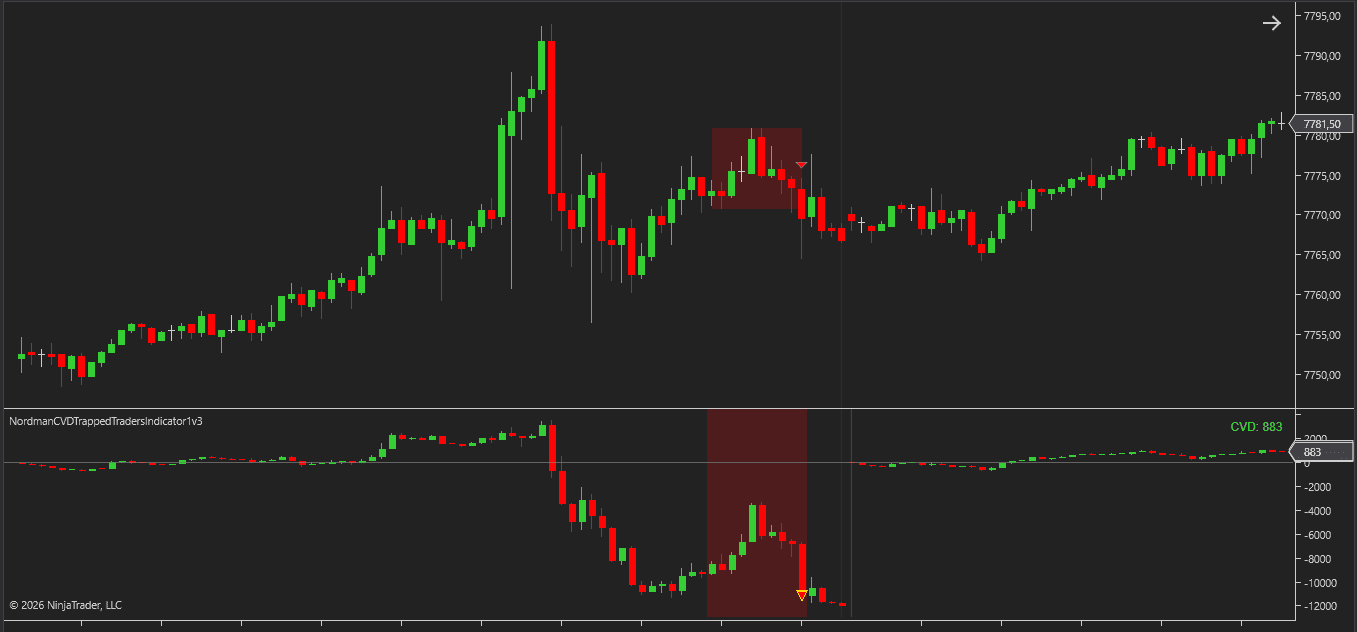
The high and low of the Pressure Window define the Trap Formation Zone.
For Trapped Buyers, confirmation requires a close below the Formation Zone low by the configured Minimum Formation Break (Ticks).
For Trapped Sellers, confirmation requires a close above the Formation Zone high by the same minimum distance.
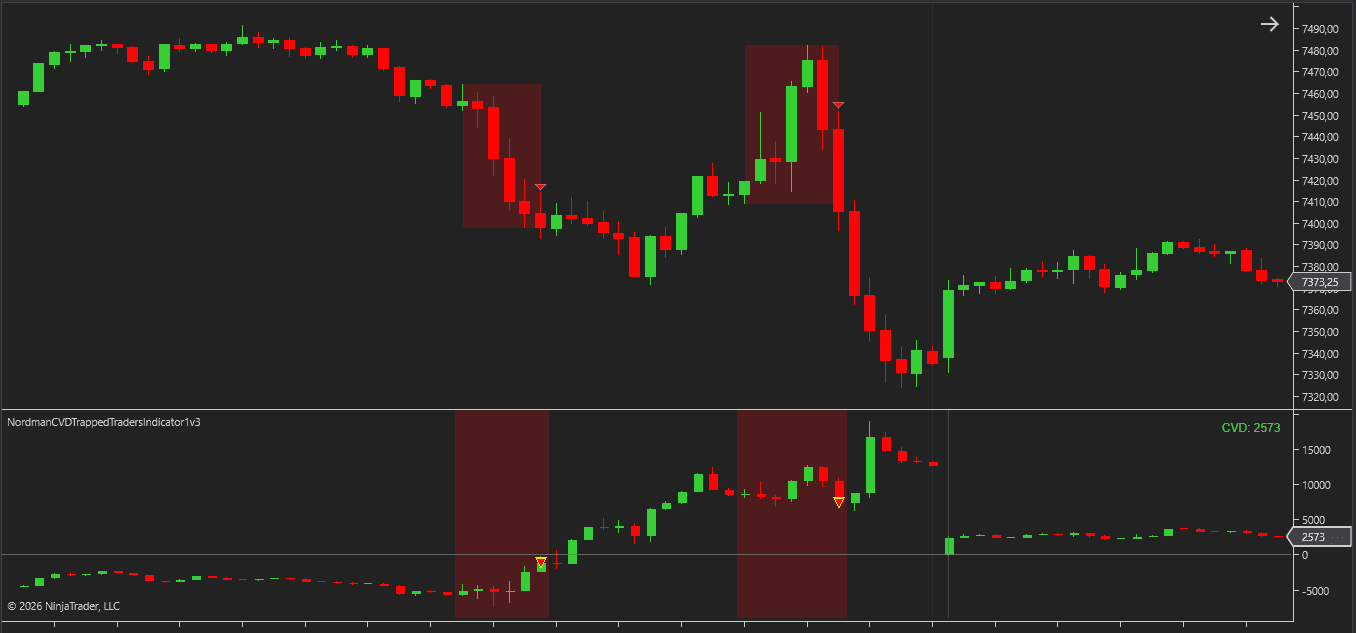
Potential Formation Zones can be displayed while confirmation is pending. Confirmed zones use the bullish or bearish signal color, while cancelled Potential Zones can optionally remain visible for historical review.
A Potential Trap is cancelled if price breaks the zone in the original pressure direction, an opposite trap condition forms, the confirmation window expires, or CVD resets.
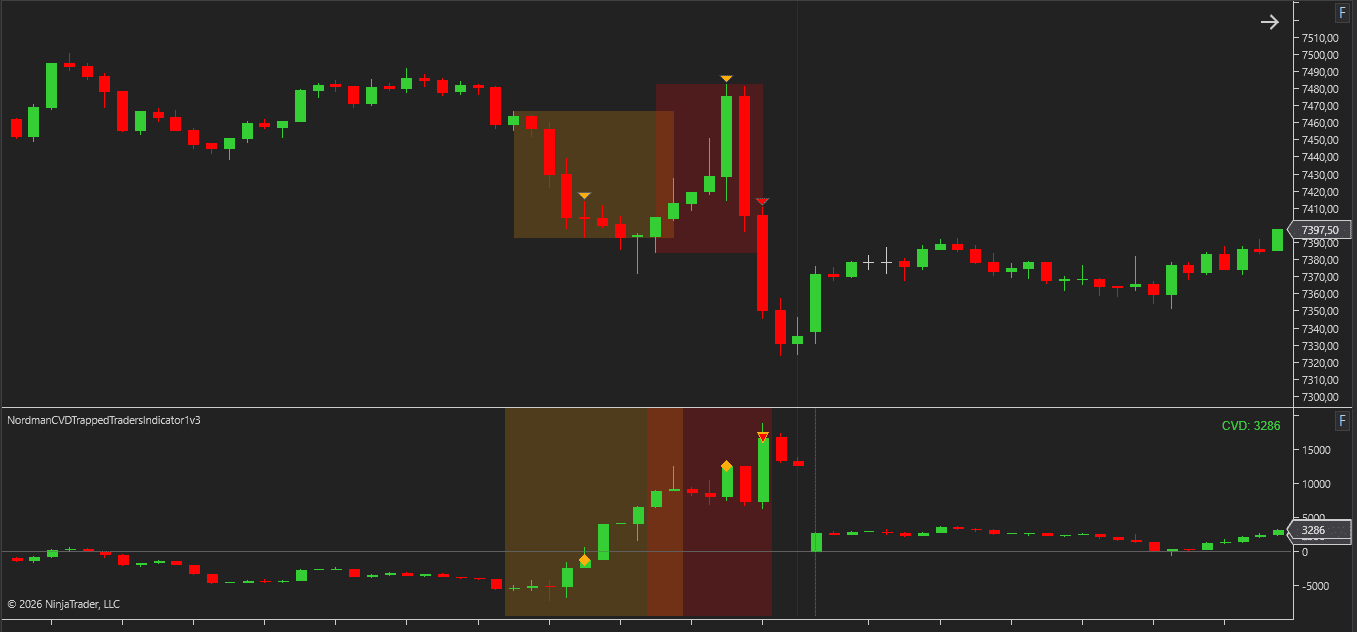
Signals, Alerts & Automation Outputs
Trap signals can appear on both the price chart and the CVD panel.
Confirmed Trapped Sellers use bullish upward markers, while Confirmed Trapped Buyers use bearish downward markers. Potential Trap markers can also be enabled separately.
Potential and Confirmed alerts are independent, with popup, sound, and email delivery available for enabled events.
The indicator provides analytical plot outputs that can be used by NinjaTrader strategies and compatible automation tools without recreating the detection logic.
CVD Calculation
CVD is calculated internally, so no separate CVD indicator is required.
Up Down Tick is the default Delta Type and classifies volume using tick direction.
Bid Ask uses bid/ask transaction data and requires Tick Replay together with suitable bid/ask data from the provider.
CVD accumulation can be set to Session, Day, Week, Custom Session, Fixed Bars Count, or Unlimited. Reset timing can be handled automatically or manually where applicable, and Minimum Trade Size can exclude smaller transactions.
An active Potential Trap is cancelled when CVD accumulation resets.
Visualization & Display
Confirmed and optional Potential Formation Zones show where the original CVD pressure developed.
Signals can appear on the price chart, the CVD panel, or both. Potential Trap markers can also be enabled separately from confirmed signals.
The CVD series can be shown as Candle, Histogram, or Line, with configurable positive and negative colors.
The panel can also display the current CVD value, zero line, and accumulation reset markers. Signal colors, marker size, zone opacity, and the number of historical traps retained on the chart are configurable.
Built-In MFE/MAE Tracker
The built-in MFE/MAE Tracker measures favorable and adverse price movement after detected trap events across configurable holding periods.
Results are displayed directly on the chart and can be exported to CSV, providing a structured view of signal behavior across historical data.
Calculation precision, long/short tracking, and opposite-signal measurement can be configured inside the tracker.
Learn more about the MFE/MAE Tracker →
CVD Trapped Traders vs CVD Slingshot
Both indicators analyze CVD, but they look for different patterns.
CVD Trapped Traders looks for strong buying or selling pressure that produces a weak price response, then waits for price to break against that pressure.
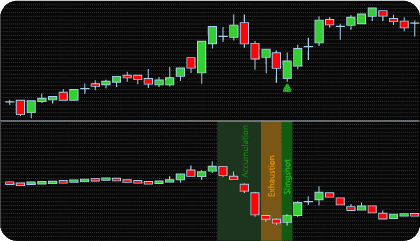
CVD Slingshot follows directional CVD accumulation, slowdown at a CVD extreme, and a later delta reversal.
In short: Trapped Traders focuses on CVD pressure vs price response; Slingshot focuses on exhaustion and reversal inside CVD.
Learn more about the NinjaTrader CVD Slingshot Indicator →
How to Interpret and Use the NinjaTrader CVD Trapped Traders Indicator
Reading a Potential Trap
A Potential Trap means one side has been aggressive in CVD, but price has not responded proportionally.
For Potential Trapped Buyers, the Pressure Window shows strong positive delta with limited upside progress.
For Potential Trapped Sellers, strong negative delta is accompanied by limited downside progress.
At this stage, the indicator has identified ineffective aggression, not a confirmed reversal. Price still needs to move against the aggressive side.
Reading a Confirmed Trap
Confirmation comes from price; no additional CVD condition is required.
For Trapped Buyers, price must close below the Formation Zone low by at least Minimum Formation Break (Ticks).
For Trapped Sellers, price must close above the Formation Zone high.
The Potential Trap identifies the pressure imbalance. The later price break confirms that the market has moved against the aggressive side.
Using the Formation Zone
The Formation Zone covers the price range of the Pressure Window that created the Potential Trap.
It provides a clear reference for three possible outcomes:
- a break against the aggressive side confirms the trap;
- a break in the original pressure direction cancels it;
- if no qualifying break occurs within Confirmation Max Bars, the setup expires.
The zone therefore connects the original CVD pressure with the later price response.
Adjusting Detection Sensitivity
The main detection settings control different parts of the pattern.
Increase Minimum Normalized Pressure to require stronger CVD pressure.
Increase Minimum Directional Consistency to require cleaner one-sided buying or selling.
Reduce Maximum Price Response to require a larger mismatch between CVD pressure and price movement.
Increase Minimum Formation Break (Ticks) to require a stronger price break before confirmation.
These filters can be adjusted independently rather than relying on one general sensitivity setting.
Indicator Settings & Parameters
Alerts
- Enable sound alert — Plays the selected sound for enabled trap alerts.
- Enable email alert — Sends email notifications for enabled trap alerts.
- Enable pop up alert — Displays an on-screen notification.
- Alert sound file — Selects the WAV file used for sound alerts.
- Email to — Defines the email recipient.
CVD Calculation
Delta Type
Defines how volume is classified into buying and selling components.
- Up Down Tick — uses tick direction to classify buying and selling volume; default mode, no Tick Replay required
- Bid Ask — uses bid/ask transaction data; requires Tick Replay and suitable bid/ask data from your provider
Accumulation Period
Defines how long the CVD series accumulates before resetting. An active Potential Trap is cancelled when CVD accumulation resets.
- Session — resets with the trading session
- Day — resets daily
- Week — resets weekly
- Custom Session — uses a custom start and end time
- Fixed Bars Count — resets after a specified number of bars
- Unlimited — accumulates without periodic resets
- Reset Mode — Selects Auto or Manual Time reset handling where applicable.
- Reset Time (HH:mm:ss) — Defines the manual reset time.
- Reset Day Of Week — Defines the day used for manual weekly resets.
- Start Time (HH:mm:ss) — Defines the Custom Session start.
- End Time (HH:mm:ss) — Defines the Custom Session end.
- Bars Count — Defines the Fixed Bars Count accumulation length.
- Minimum Trade Size — Excludes trades below the specified size. Set to 0 to include all trades.
Trapped Traders Detection
- Detect Trapped Sellers (Bullish) — Enables bullish trapped-seller detection.
- Detect Trapped Buyers (Bearish) — Enables bearish trapped-buyer detection.
- Pressure Window — Defines the number of completed bars analyzed as one pressure formation.
- Minimum Normalized Pressure — Sets the minimum CVD pressure required relative to recent delta activity.
- Maximum Price Response — Sets the maximum ATR-normalized price movement allowed in the pressure direction.
- Confirmation Max Bars — Sets how long a Potential Trap can wait for confirmation.
- Minimum Formation Break (Ticks) — Sets the minimum close distance beyond the Formation Zone required for confirmation.
Advanced Detection
- Delta Baseline Period — Defines the recent delta baseline used for Normalized Pressure.
- Minimum Directional Consistency — Sets the minimum level of one-sided delta activity required within the Pressure Window.
- ATR Period — Defines the ATR period used to normalize Price Response.
Alerts — Events
- Enable Confirmed Trap Alert — Enables notifications for Confirmed Traps.
- Enable Potential Trap Alert — Enables notifications when a Potential Trap first appears.
Display — Signals
- Show Confirmed Formation Zones — Displays Formation Zones for confirmed traps.
- Show Potential Formation Zone — Displays the active Potential Formation Zone.
- Show Historical Potential Zones — Keeps cancelled Potential Formation Zones visible when Potential zones are displayed.
- Show Potential Trap Marker — Displays Potential Trap markers.
- Show Signals On Price Panel — Displays trap markers on the price chart.
- Show Signals On CVD Panel — Displays trap markers on the CVD panel.
- Maximum Historical Traps — Limits the number of historical trap events retained.
- Signal Marker Size — Sets marker size on the CVD panel.
- Zone Opacity — Sets Formation Zone transparency.
- Trapped Sellers Color — Sets the bullish trap color.
- Trapped Buyers Color — Sets the bearish trap color.
- Potential Trap Color — Sets the Potential Trap color.
Display — CVD Panel
Display Mode
Selects how the CVD series is visualized on the CVD panel.
- Candle — Open/High/Low/Close candles showing intrabar CVD movement
- Histogram — vertical bars from the zero line showing cumulative CVD close values
- Line — continuous line connecting CVD close values
- Positive Color — Sets the color used for CVD values above zero in Line and Histogram modes, and for candles that close at or above their open in Candle mode.
- Negative Color — Sets the color used for CVD values below zero in Line and Histogram modes, and for candles that close below their open in Candle mode.
- Show Current Value — Displays the current CVD value.
- Show Zero Line — Displays the zero reference line.
- Zero Line Color — Sets the zero-line color.
- Zero Line Size — Sets the zero-line width.
- Show Reset Markers — Displays CVD reset markers.
- Reset Marker Color — Sets the reset-marker color.
- Reset Marker Size — Sets the reset-marker width.
Custom Programming
Need changes to this indicator? We can customize it to your specifications — adding new functions, modifying logic, refining visuals, or integrating it with other NinjaTrader tools.
We also convert indicators into Automated Trading Strategies with advanced features such as trailing stops, position parameter controls, execution filters, and rule-based automation built to your technical specifications.
Request a free consultation to discuss the technical scope, timeline, and available development options.
We Value Your Feedback
We are committed to the ongoing development and refinement of our indicators. If you’ve spotted a bug, feel that something essential is missing, or have ideas that could make the indicator even better, just send us a message. Your feedback helps us improve and deliver tools that truly meet traders’ needs.
Exposed Analytical Plots for Strategy Builder Integration
The indicator provides a set of exposed analytical plot outputs designed for structured integration with third-party strategy builders and automation tools such as BloodHound and BlackBird (SharkIndicators), as well as other algorithmic trading environments.
| Analytical Plot Name |
Output Values |
| CVD Open |
Value |
| CVD High |
Value |
| CVD Low |
Value |
| CVD Close |
Value |
| Trap Signal |
> 0 |
| Potential Trap Signal |
> 0 |
| Long MFE/MAE Period 1 |
Value |
| Short MFE/MAE Period 1 |
Value |
| Long MFE/MAE Period 2 |
Value |
| Short MFE/MAE Period 2 |
Value |
| Long MFE/MAE Period 3 |
Value |
| Short MFE/MAE Period 3 |
Value |
| Long MFE/MAE Period 4 |
Value |
| Short MFE/MAE Period 4 |
Value |
| Long MFE/MAE Opposite |
Value |
| Short MFE/MAE Opposite |
Value |
Plot output names and descriptions are technical identifiers intended solely for software integration purposes and do not constitute trading advice, signals, or recommendations.
FAQ
1. What does the CVD Trapped Traders Indicator detect?
It looks for strong, directionally consistent CVD pressure that produces limited price movement.
The indicator registers a Potential Trap, confirmed only if price later closes beyond the opposite Formation Zone boundary.
2. What is the difference between a Potential Trap and a Confirmed Trap?
A Potential Trap means the pressure, consistency, and price-response conditions are met.
A Confirmed Trap adds the required price close beyond the opposite side of the Formation Zone.
3. What cancels a Potential Trap?
A Potential Trap is cancelled if price breaks the Formation Zone in the original pressure direction, an opposite qualifying trap condition forms, the confirmation period expires, or CVD accumulation resets.
4. Does Bid Ask mode require Tick Replay?
Yes. Bid Ask Delta Type requires Tick Replay and suitable bid/ask transaction data.
Up Down Tick uses tick direction and is the default Delta Type.
5. How is CVD Trapped Traders different from CVD Slingshot?
6. Can the indicator be used in automated strategies?
Yes. The indicator provides analytical plot outputs for Potential and Confirmed trap events together with the underlying CVD series.
These outputs can be referenced by NinjaTrader strategies and compatible automation tools independently of popup, sound, and email notifications.
Disclaimer — Software Use & Risk Disclosure
Nordman Algorithms is a trade name of Nordman Algorithms OÜ (Reg. No. 14435535), registered in Tallinn, Estonia.
Software Nature & User Responsibility — Nordman Algorithms provides algorithmic software tools for technical analysis. Nordman Algorithms is not a financial advisor and is not liable for any losses. All trades conducted based on the software’s output are executed at the user’s sole discretion and risk.
Visual Markers & Signal Disclosure — This software may display visual markers (such as arrows, dots, or alerts) when predefined mathematical conditions are met. These markers are provided for educational and analytical purposes only, must not be interpreted as financial guidance, and do not constitute a recommendation to buy, sell, or hold any financial instrument. Users must independently validate all visual cues within their own trading methodology.
No Financial Advice — Nordman Algorithms does not provide discretionary trading signals, investment advice, or managed signal services. Our software represents a mathematical visualization of historical and real-time data. The appearance of a visual marker does not guarantee a profitable trade or predict future market behavior.
Trading Risk Warning — Futures, Forex, and options trading involve significant risk. Risk capital is money that can be lost without jeopardizing financial security. Only risk capital should be used for trading. Past performance is not indicative of future results. View Full Risk Disclosure: https://www.nordman-algorithms.com/risk-disclosure/
ESMA Risk Warning — Financial instruments, especially those involving leverage such as CFDs and Forex, are complex and carry a high risk of rapid financial loss. Our software provides analytical outputs and visual markers based on predefined mathematical conditions and does not mitigate or reduce inherent market risks. You should carefully consider whether you understand how leveraged financial instruments work and whether you can afford the high risk of losing your capital.
CFTC Rule 4.41 — Hypothetical or simulated performance results have inherent limitations. Unlike actual performance records, simulated results do not represent real trading. Because trades have not actually been executed, these results may under- or over-compensate for the impact of market factors such as liquidity. No representation is being made that any account will achieve profits or losses similar to those shown.
Trademark Notice — NinjaTrader® is a registered trademark of NinjaTrader Group, LLC. No NinjaTrader company has any affiliation with the owner, developer, or provider of the products or services described herein, or any interest, ownership or otherwise, in any such product or service, or endorses, recommends or approves any such product or service.