The VWAP + RSI Indicator supports two independent operating modes, selectable in the settings:
In this mode, VWAP is the primary analytical component. VWAP (Volume-Weighted Average Price) calculates the average price of an asset over a defined period, weighted by volume at each price level. Unlike a standard moving average, VWAP gives more weight to price levels where more volume was traded — producing an average that reflects actual transaction distribution rather than time-equal price sampling.
During periods of high volume and elevated volatility, VWAP responds more quickly to price changes. During lower-volume periods, the line becomes less reactive — smoothing out minor price fluctuations without requiring any manual parameter adjustment.
The volume-weighting mechanism has a specific analytical consequence that is worth understanding explicitly. On a standard moving average, a period of low-volume consolidation at a particular price level carries the same weight as a high-volume directional move through the same price. VWAP corrects for this: a price level where significant volume transacted contributes proportionally more to the average than a level where volume was minimal. This means the VWAP line gravitates toward price levels where the most actual market activity occurred — not simply where price spent the most time. The practical implication is that when price deviates from VWAP, the magnitude of that deviation reflects not just how far price has moved, but how far it has moved relative to where the majority of volume-weighted market activity is anchored. This makes VWAP a structurally different reference point than a time-based moving average at the same period.
Combination with RSI
RSI complements VWAP by identifying overbought and oversold conditions through momentum analysis:
A condition in VWAP + RSI mode is registered when a VWAP crossover occurs while RSI is in the corresponding extreme zone — providing a two-component confirmation before a condition is registered. This filters out VWAP crossovers that occur while RSI is in a non-extreme range.
In this mode, RSI divergence is the primary analytical component, with VWAP used as a structural confirmation layer.
Three divergence types are available:
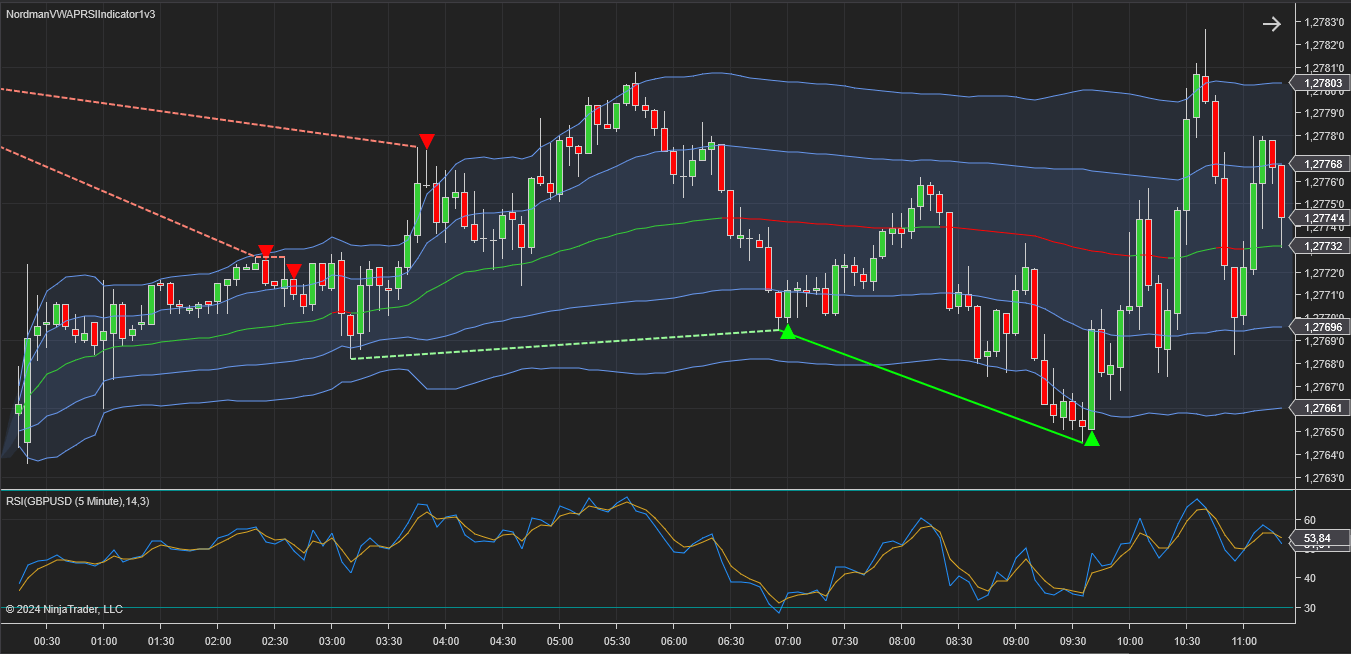
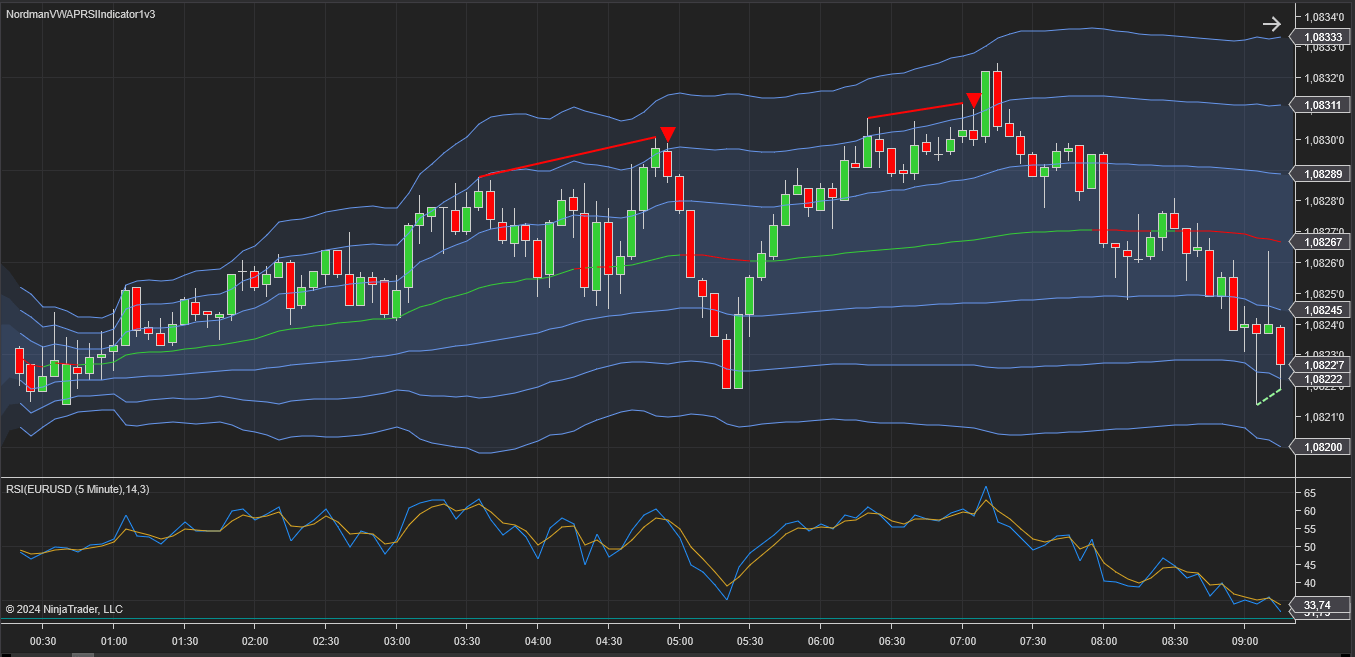
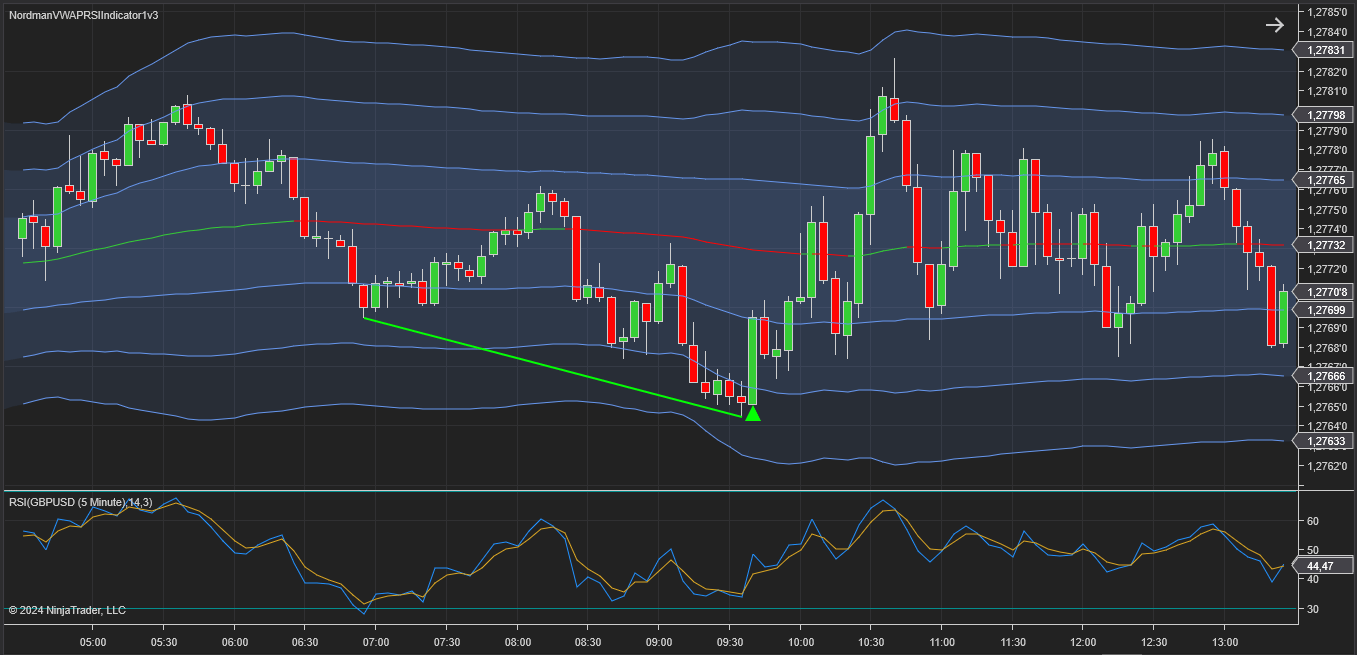
Classic divergence is registered when RSI readings move in the direction of the anticipated condition but price is still moving in the opposite direction — reflecting a discrepancy between price movement and oscillator behavior.
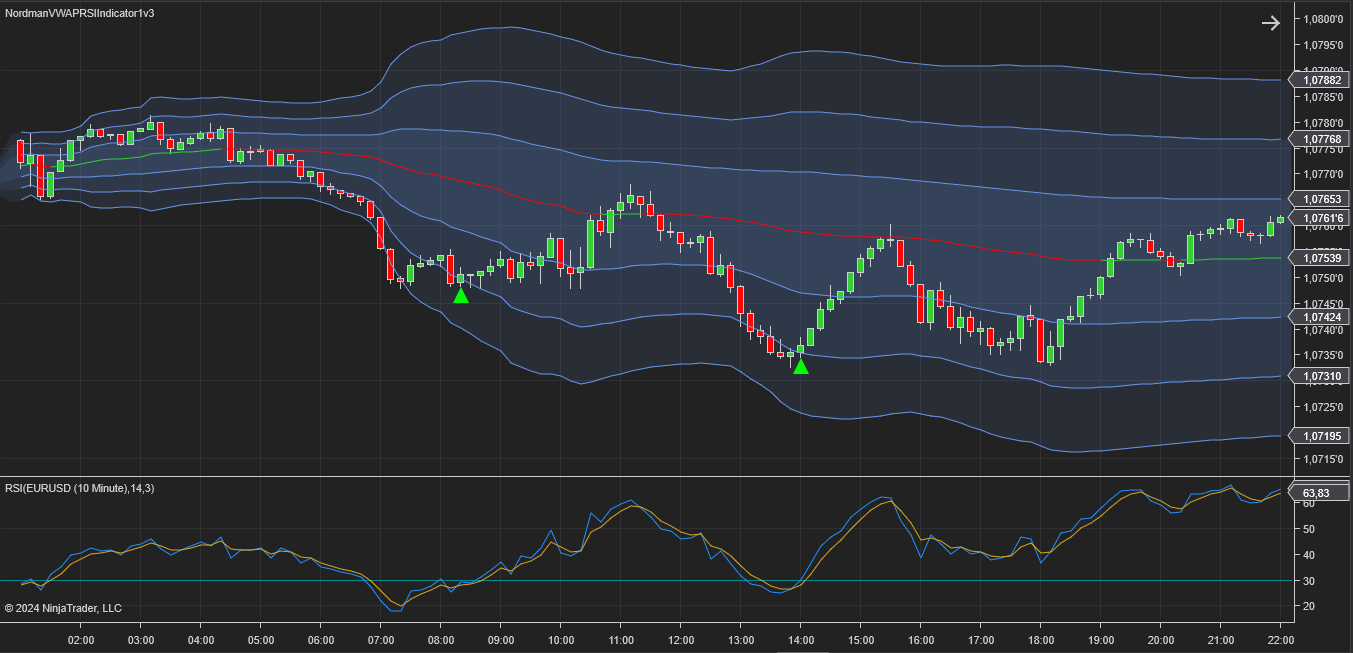
Hidden divergence is registered when RSI maintains its directional movement but price has already reversed — reflecting continuation context within an established directional move.
Divergence lines are drawn on the chart connecting the relevant RSI peaks or troughs. Solid lines indicate classic divergence, dotted lines indicate hidden divergence. Green lines indicate a bullish condition, red lines a bearish condition.
The analytical logic behind using VWAP as a confirmation layer for divergence — rather than a standard price level or moving average — relates to what VWAP represents structurally. A divergence condition identified by RSI indicates a discrepancy between price movement and momentum as measured by the oscillator. But a divergence alone does not indicate where price is positioned relative to the broader volume distribution of the session. VWAP confirmation adds this layer: requiring the RSI trough to be below VWAP for a bullish divergence means the condition is registered only when both the momentum discrepancy and the price-below-average-volume-level criteria are met simultaneously. A bullish divergence occurring above VWAP — where price is already trading above the volume-weighted average — carries a structurally different context than one occurring below it. The confirmation requirement filters out divergences that occur in positions where the structural context does not align with the directional reading of the divergence itself.
VWAP confirmation — a divergence condition is confirmed by evaluating the position of the most recent RSI trough or peak relative to VWAP or its standard deviation channels. For a bullish divergence condition to be confirmed, the trough must be positioned below the VWAP line or below the lower standard deviation channel boundary. For a bearish divergence condition, the peak must be positioned above the VWAP line or above the upper boundary.
VWAP + RSI mode — condition types:
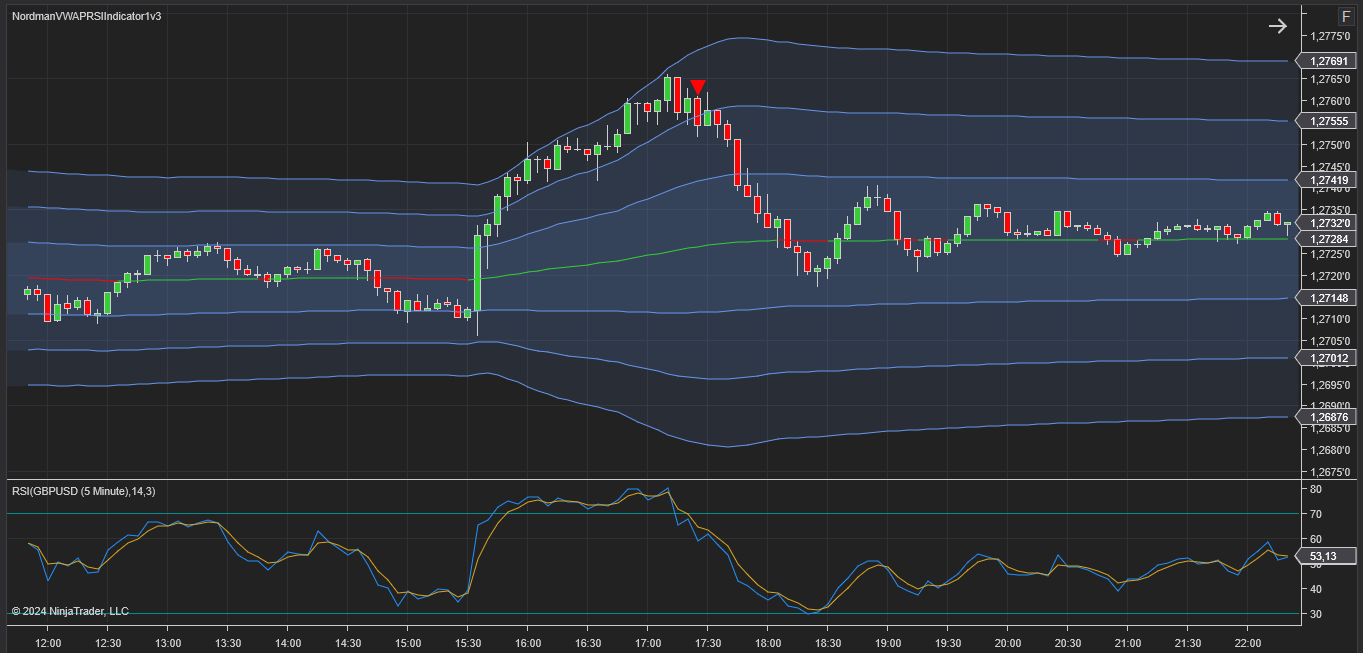
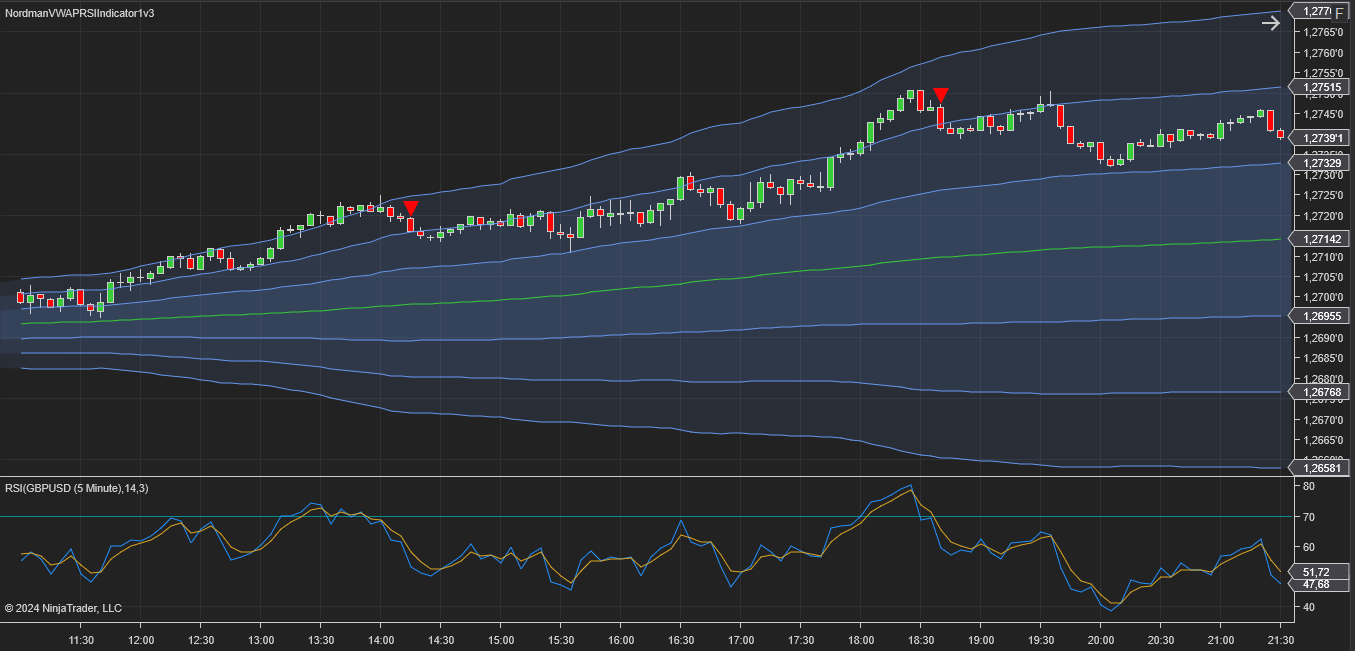
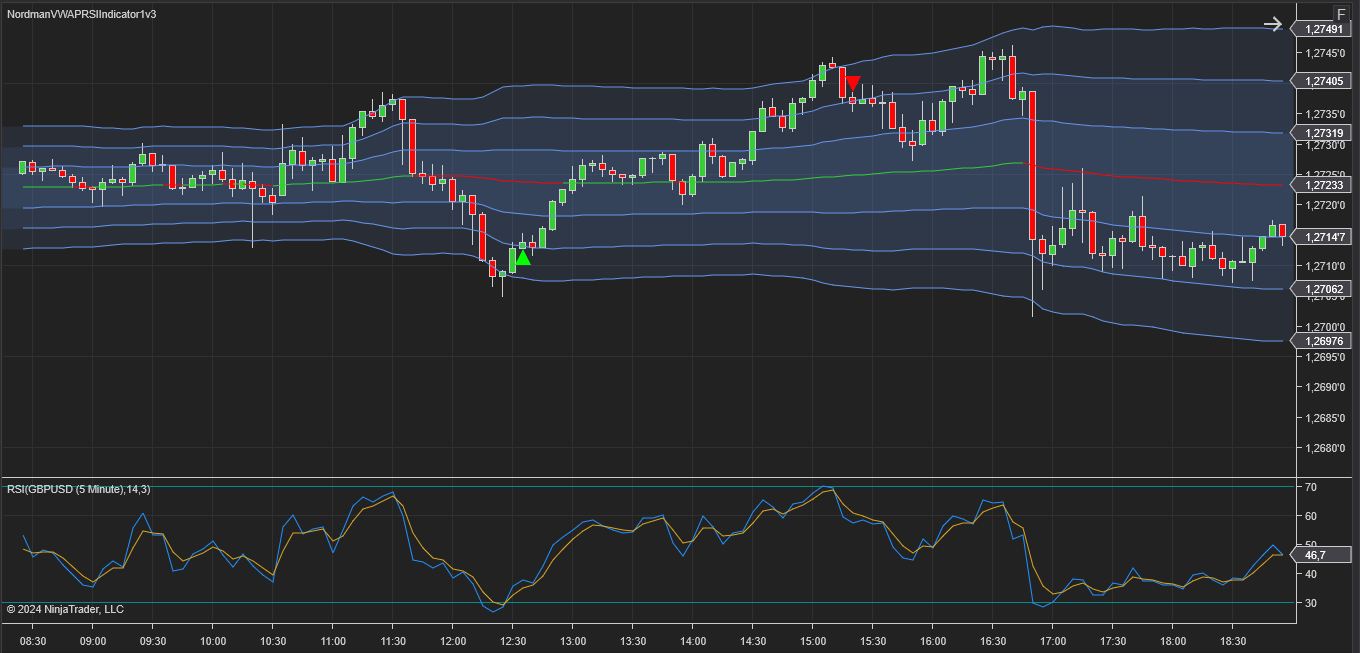
A bullish condition is registered when price crosses the VWAP line from below, or crosses a standard deviation channel boundary located below VWAP from below — at 1, 2, or 3 standard deviations depending on the configured signal type. RSI must be in the oversold zone at the time of the crossover.
A bearish condition is registered when price crosses the VWAP line from above, or crosses a standard deviation channel boundary located above VWAP from above. RSI must be in the overbought zone at the time of the crossover.
VWAP + RSI Divergence mode — condition types:
Bullish and bearish conditions are registered based on the divergence type selected and confirmed by the position of the relevant RSI peak or trough relative to VWAP or standard deviation channels as described above.
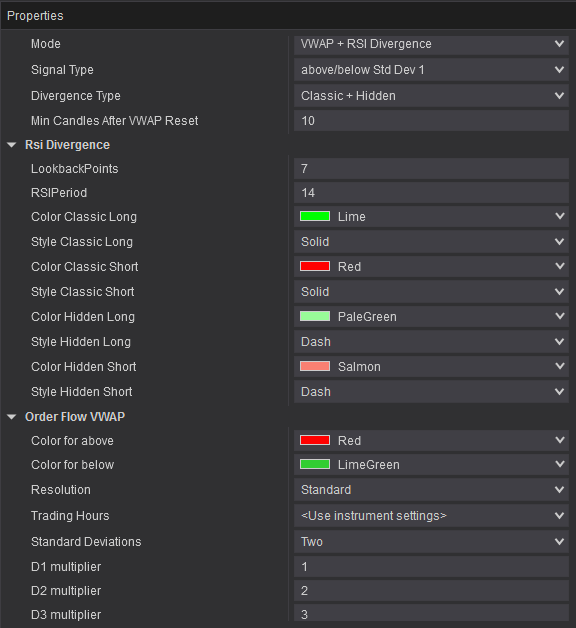
The indicator has the following parameters:
Alerts — configure alert delivery: audio notifications, email, and on-screen pop-ups — each configurable independently.
Mode — selects the operating mode: VWAP + RSI or VWAP + RSI Divergence.
Signal Type — selects whether conditions are based on VWAP line crossovers only, or VWAP with standard deviation channels.
Divergence Type — configures which divergence types are used for condition detection: classic, hidden, or both.
Min Candles After VWAP Reset — sets the minimum number of bars to wait after the VWAP calculation resets before condition detection resumes.
RSI — individual parameter configuration for the RSI calculation.
Order Flow VWAP — individual parameter configuration for the VWAP calculation.

We can customize this indicator to your needs — adding functions, modifying logic, or integrating it with other tools for your workflow.
We also convert indicators into Automated Trading Strategies with advanced functions (trailing stops, risk management, filters) tailored to your trading style strictly according to your specifications.
Request a free consultation to discuss the technical scope and timeline of your project.
We are committed to the ongoing development and refinement of our indicators. If you’ve spotted a bug, feel that something essential is missing, or have ideas that could make the indicator even better, just send us a message. Your feedback helps us improve and deliver tools that truly meet traders’ needs.
The indicator provides a set of exposed analytical plot outputs designed for structured integration with third-party strategy builders and automation tools such as BloodHound and BlackBird (SharkIndicators), as well as other algorithmic trading environments.
| Analytical Plot Name | Output Values |
| Order Flow VWAP | Value |
| Std Dev 1 Upper | Value |
| Std Dev 1 Lower | Value |
| Std Dev 2 Upper | Value |
| Std Dev 2 Lower | Value |
| Std Dev 3 Upper | Value |
| Std Dev 3 Lower | Value |
| Up | > 0 |
| Dn | > 0 |
Plot output names and descriptions are technical identifiers intended solely for software integration purposes and do not constitute trading advice, signals, or recommendations.
Nordman Algorithms is a trade name of Nordman Algorithms OÜ (Reg. No. 14435535), registered in Tallinn, Estonia.
Software Nature & User Responsibility — Nordman Algorithms provides algorithmic software tools for technical analysis. Nordman Algorithms is not a financial advisor and is not liable for any losses. All trades conducted based on the software’s output are executed at the user’s sole discretion and risk.
Visual Markers & Signal Disclosure — This software may display visual markers (such as arrows, dots, or alerts) when predefined mathematical conditions are met. These markers are provided for educational and analytical purposes only, must not be interpreted as financial guidance, and do not constitute a recommendation to buy, sell, or hold any financial instrument. Users must independently validate all visual cues within their own trading methodology.
No Financial Advice — Nordman Algorithms does not provide discretionary trading signals, investment advice, or managed signal services. Our software represents a mathematical visualization of historical and real-time data. The appearance of a visual marker does not guarantee a profitable trade or predict future market behavior.
Trading Risk Warning — Futures, Forex, and options trading involve significant risk. Risk capital is money that can be lost without jeopardizing financial security. Only risk capital should be used for trading. Past performance is not indicative of future results. View Full Risk Disclosure: https://www.nordman-algorithms.com/risk-disclosure/
ESMA Risk Warning — Financial instruments, especially those involving leverage such as CFDs and Forex, are complex and carry a high risk of rapid financial loss. Our software provides analytical outputs and visual markers based on predefined mathematical conditions and does not mitigate or reduce inherent market risks. You should carefully consider whether you understand how leveraged financial instruments work and whether you can afford the high risk of losing your capital.
CFTC Rule 4.41 — Hypothetical or simulated performance results have inherent limitations. Unlike actual performance records, simulated results do not represent real trading. Because trades have not actually been executed, these results may under- or over-compensate for the impact of market factors such as liquidity. No representation is being made that any account will achieve profits or losses similar to those shown.
Trademark Notice — NinjaTrader® is a registered trademark of NinjaTrader Group, LLC. No NinjaTrader company has any affiliation with the owner, developer, or provider of the products or services described herein, or any interest, ownership or otherwise, in any such product or service, or endorses, recommends or approves any such product or service.