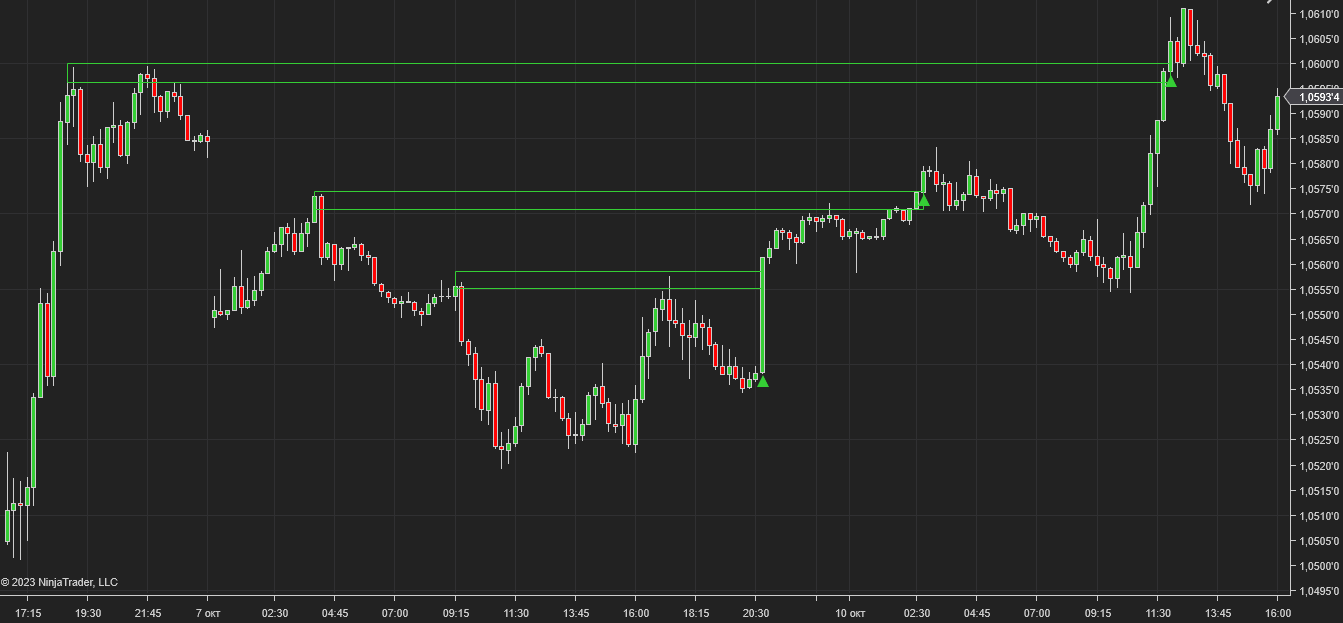
The Support & Resistance Breakout Indicator identifies structurally significant price levels and registers a condition when price breaks through them. Level significance is determined by the number of times price has tested a level without breaking through — the more tests a level has accumulated, the more structurally significant it is considered. Only levels that meet the configured minimum test criteria are tracked.
The structural reasoning behind requiring multiple tests before a zone is considered significant relates to how support and resistance levels form in practice. A single local high or low can appear at any price level for random or low-significance reasons — a brief liquidity gap, a single large order, or a momentary imbalance. What distinguishes a structurally significant level is repeated interaction: price approaches the level, fails to break through, reverses, and returns to test it again. Each failed test represents a point where opposing pressure was sufficient to prevent continuation — and each subsequent test confirms that the level is not incidental. The minimum test count parameter encodes this logic directly: it defines how many confirmed interactions are required before the indicator considers a level worth tracking for a breakout. A level with two tests and a level with five tests are structurally different, even if they appear visually similar on a chart — the five-test level has been confirmed as a boundary by market activity a greater number of times, and a breakout through it represents a more significant structural event.
The identification logic is based on pivot point analysis within a configurable bar range. When multiple local highs or lows cluster within a defined tolerance threshold, a support or resistance zone is established. The indicator then monitors for a breakout of that zone within a configurable bar window — if no breakout occurs within the defined range, the zone expires without registering a condition.
The key parameters — minimum number of tests, minimum bars between tests, threshold rate, and maximum breakout length — allow the detection criteria to be adjusted independently. A higher minimum test count produces fewer but more structurally selective zones. A narrower threshold rate produces tighter zones with more precisely defined boundaries. These parameters interact: changing one affects how many zones qualify and how quickly breakout conditions are registered.
The structural premise behind multi-touch level identification is that price levels which have been tested multiple times without breaking reflect areas where opposing market pressure has been sufficient to prevent a sustained move through that level. Each additional test without a breakout adds to the structural significance of the zone — but also means that when a breakout does occur, it represents a condition where that accumulated opposing pressure has been overcome.
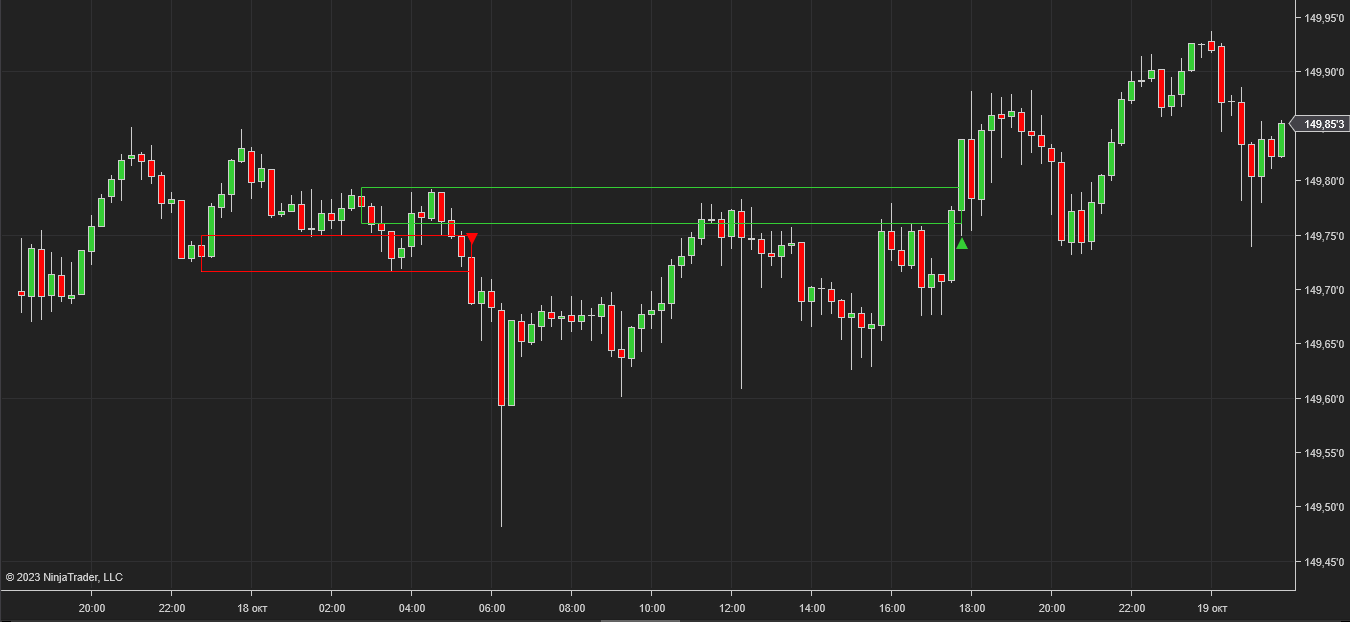
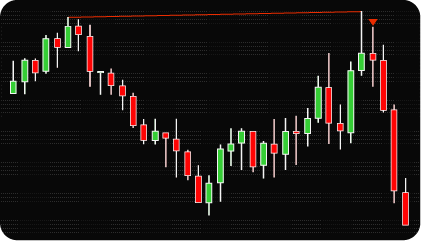
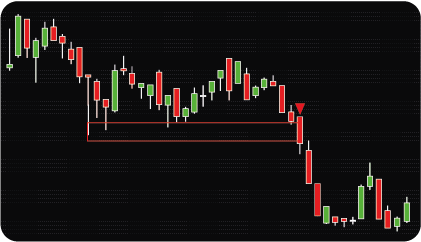
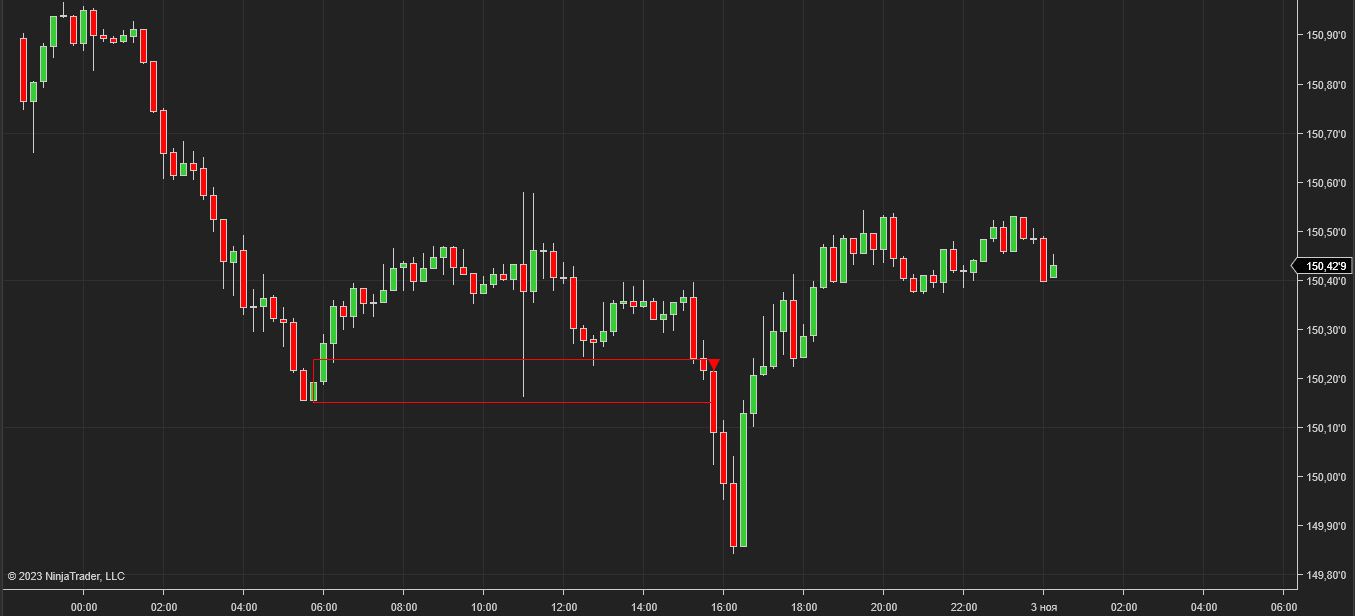
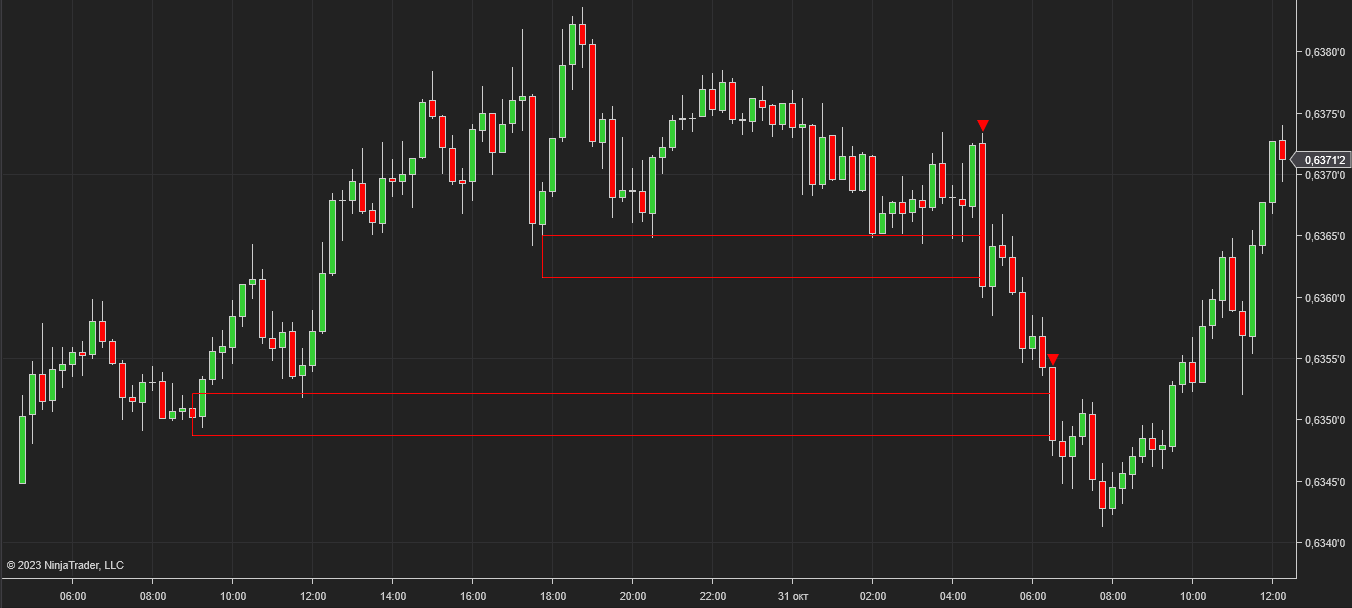
A bullish breakout condition is registered when price moves above a resistance zone boundary that meets the configured test criteria. A bearish breakout condition is registered when price moves below a support zone boundary.
The indicator also continues tracking previously identified zones independently — a breakout of one zone does not cancel tracking of other zones that formed earlier at different price levels. Multiple zones can be active simultaneously, each tracked against its own breakout window.
The indicator has the following parameters:
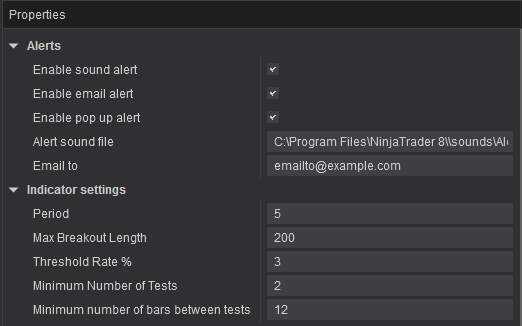
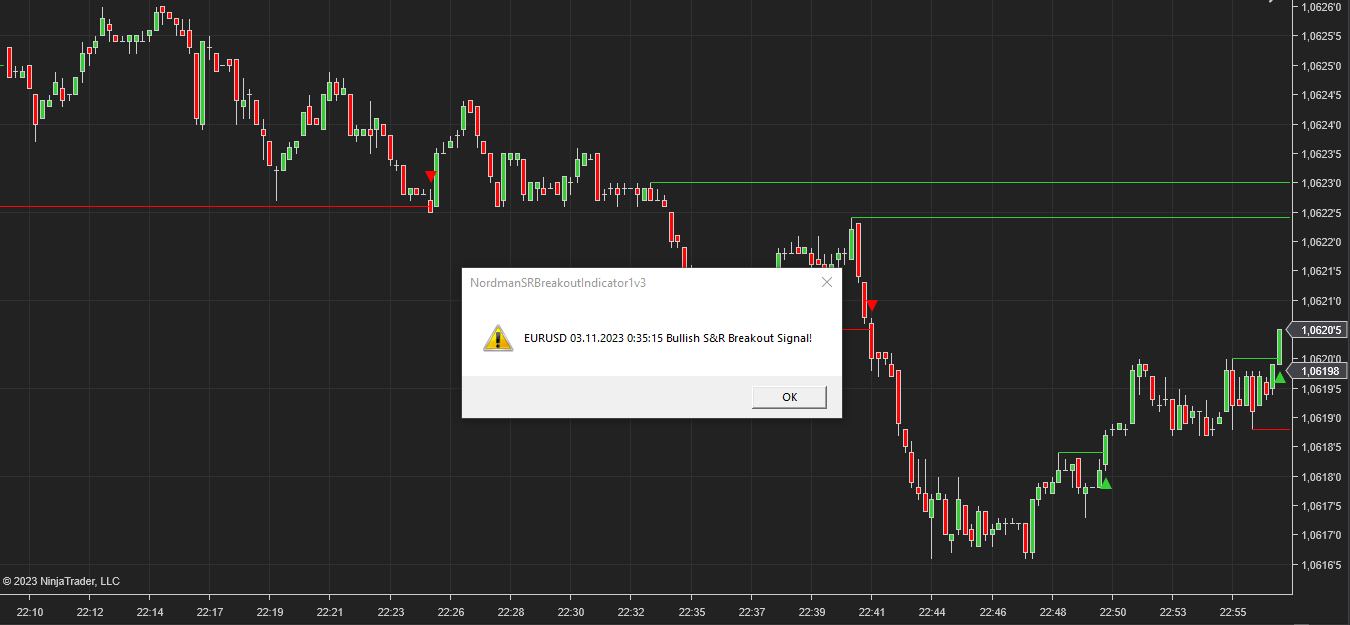
Alerts — configure alert delivery for registered conditions: sound notifications, email, and pop-up messages — each configurable independently.
Period — the bar range used to identify local pivot highs and lows.
Max Breakout Length — the maximum number of bars within which a breakout must occur after a zone is identified. If no breakout occurs within this window, the zone expires.
Threshold Rate % — defines the tolerance width of the zone as a percentage. Controls how close local highs or lows must be to count as tests of the same level.
Minimum Number of Tests — the minimum number of price touches required for a zone to be considered structurally significant.
Minimum Number of Bars Between Tests — the minimum bar distance required between individual price touches to count as separate tests of the zone.

We can customize this indicator to your needs — adding functions, modifying logic, or integrating it with other tools for your workflow.
We also convert indicators into Automated Trading Strategies with advanced functions (trailing stops, risk management, filters) tailored to your trading style strictly according to your specifications.
Request a free consultation to discuss the technical scope and timeline of your project.
We are committed to the ongoing development and refinement of our indicators. If you’ve spotted a bug, feel that something essential is missing, or have ideas that could make the indicator even better, just send us a message. Your feedback helps us improve and deliver tools that truly meet traders’ needs.
The indicator provides a set of exposed analytical plot outputs designed for structured integration with third-party strategy builders and automation tools such as BloodHound and BlackBird (SharkIndicators), as well as other algorithmic trading environments.
| Analytical Plot Name | Output Values | Description |
| Buy | > 0 | Bullish directional detection condition. |
| Sell | > 0 | Bearish directional detection condition. |
Plot output names and descriptions are technical identifiers intended solely for software integration purposes and do not constitute trading advice, signals, or recommendations.
Nordman Algorithms is a trade name of Nordman Algorithms OÜ (Reg. No. 14435535), registered in Tallinn, Estonia.
Software Nature & User Responsibility — Nordman Algorithms provides algorithmic software tools for technical analysis. Nordman Algorithms is not a financial advisor and is not liable for any losses. All trades conducted based on the software’s output are executed at the user’s sole discretion and risk.
Visual Markers & Signal Disclosure — This software may display visual markers (such as arrows, dots, or alerts) when predefined mathematical conditions are met. These markers are provided for educational and analytical purposes only, must not be interpreted as financial guidance, and do not constitute a recommendation to buy, sell, or hold any financial instrument. Users must independently validate all visual cues within their own trading methodology.
No Financial Advice — Nordman Algorithms does not provide discretionary trading signals, investment advice, or managed signal services. Our software represents a mathematical visualization of historical and real-time data. The appearance of a visual marker does not guarantee a profitable trade or predict future market behavior.
Trading Risk Warning — Futures, Forex, and options trading involve significant risk. Risk capital is money that can be lost without jeopardizing financial security. Only risk capital should be used for trading. Past performance is not indicative of future results. View Full Risk Disclosure: https://www.nordman-algorithms.com/risk-disclosure/
ESMA Risk Warning — Financial instruments, especially those involving leverage such as CFDs and Forex, are complex and carry a high risk of rapid financial loss. Our software provides analytical outputs and visual markers based on predefined mathematical conditions and does not mitigate or reduce inherent market risks. You should carefully consider whether you understand how leveraged financial instruments work and whether you can afford the high risk of losing your capital.
CFTC Rule 4.41 — Hypothetical or simulated performance results have inherent limitations. Unlike actual performance records, simulated results do not represent real trading. Because trades have not actually been executed, these results may under- or over-compensate for the impact of market factors such as liquidity. No representation is being made that any account will achieve profits or losses similar to those shown.
Trademark Notice — NinjaTrader® is a registered trademark of NinjaTrader Group, LLC. No NinjaTrader company has any affiliation with the owner, developer, or provider of the products or services described herein, or any interest, ownership or otherwise, in any such product or service, or endorses, recommends or approves any such product or service.