The Opening Range Breakout (ORB) Indicator measures the price range formed during a defined opening period and registers a condition when price breaks beyond the boundaries of that range. The measurement start and end times are fully configurable, as is the breakout tracking interval — allowing the indicator to be adapted to different session structures and instruments.
The analytical premise behind the opening range concept is rooted in intraday volatility cycles. During lower-activity periods, price moves within a compressed range. During higher-activity periods — typically associated with exchange open times and session overlaps — price tends to break out of the compressed range and extend directionally. Because these volatility cycles follow the daily schedule of exchange activity, the timing of range compression and subsequent expansion is structurally predictable and visible on most instruments.
The indicator tracks this cycle by measuring the range during the defined low-activity period and then monitoring whether price breaks beyond it during the defined breakout tracking interval.
The indicator supports two breakout detection methods, configurable in the settings:
Bar shadow method — a breakout condition is registered when the bar’s high or low extends beyond the range boundary, regardless of where the bar closes. This method registers conditions at the first price extension beyond the range.
Bar close method — a breakout condition is registered only when the bar closes beyond the range boundary. Both the shadow and the body must cross the level for the condition to be registered. This method requires a full bar close outside the range before registering.
Breakout Threshold — an optional confirmation filter that can be enabled or disabled in the settings. When enabled, it requires price to extend beyond the range boundary by a defined minimum distance before a condition is registered. The threshold is configurable in ticks or as a percentage of the measured range. A higher threshold filters out minor boundary interactions — only breakouts that exceed the defined distance are registered. When disabled, a condition is registered at the first interaction with the boundary regardless of distance.
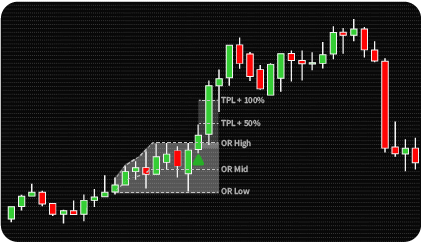
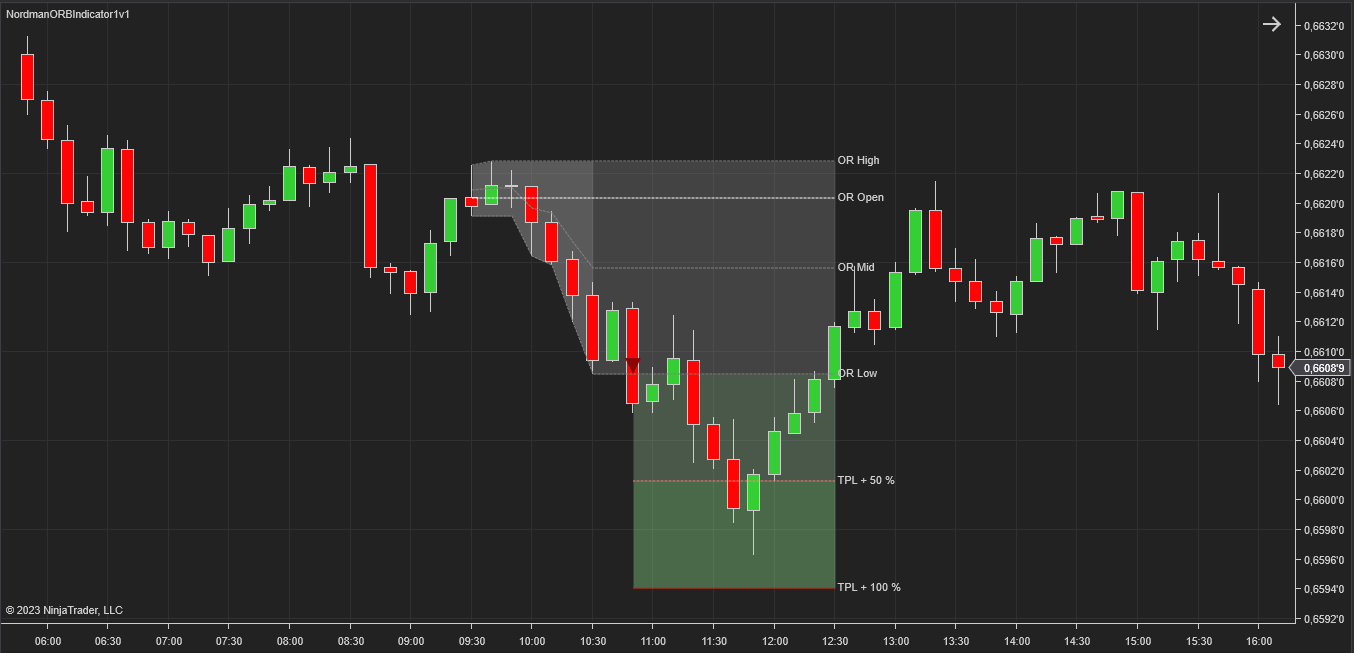
In addition to the measured range boundaries, the indicator displays two structural reference levels based on the range measurement:
TPL +100% — a level positioned at a distance equal to the full range width beyond the breakout boundary. This reflects the structural premise that a directional move following a breakout may extend by approximately the same magnitude as the prior compressed range.
TPL +50% — a level positioned at half the range width beyond the breakout boundary. Both target levels can be enabled or disabled independently in the settings.
The indicator also displays the following structural levels:
The Advanced ORB Indicator extends the standard version with a significantly broader feature set:
The measured opening range is displayed on the chart as a solid gray cloud — bounded on the left by the measurement start time, on the top by OR High, on the bottom by OR Low, and extending to the right until the measurement period ends or the current bar.
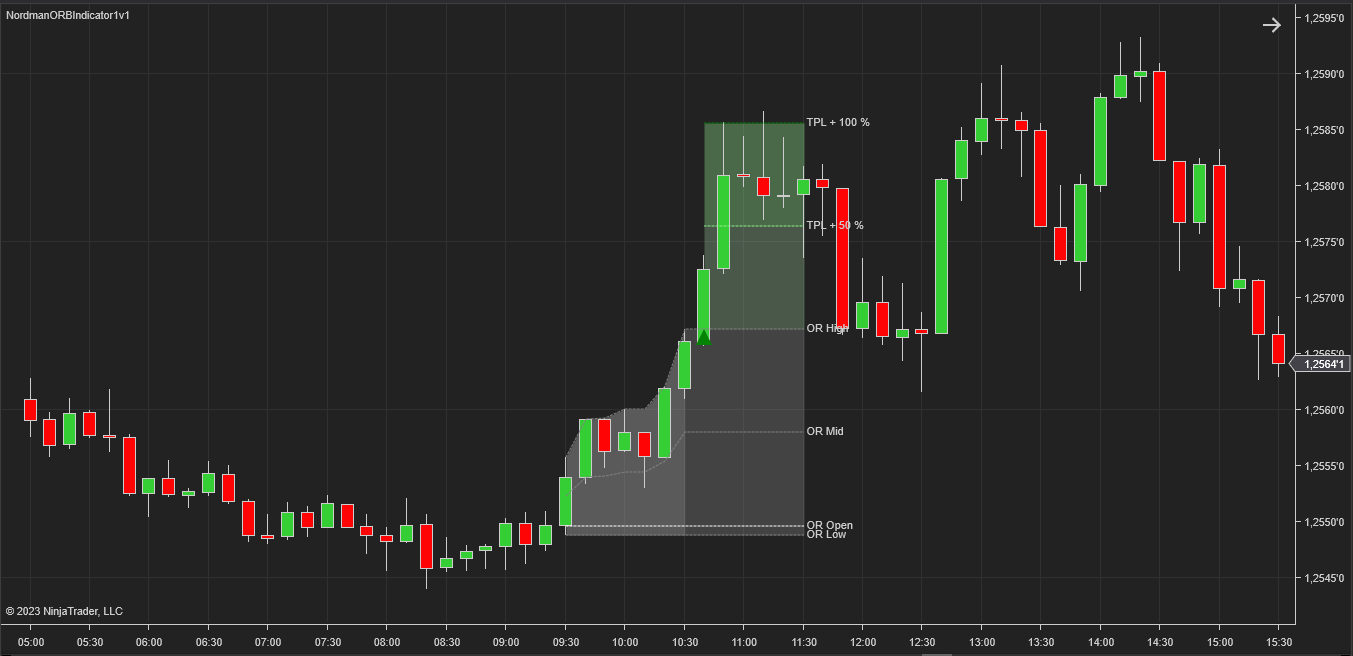
The breakout tracking interval is displayed as a second gray cloud of different intensity, positioned immediately after the measurement period ends.
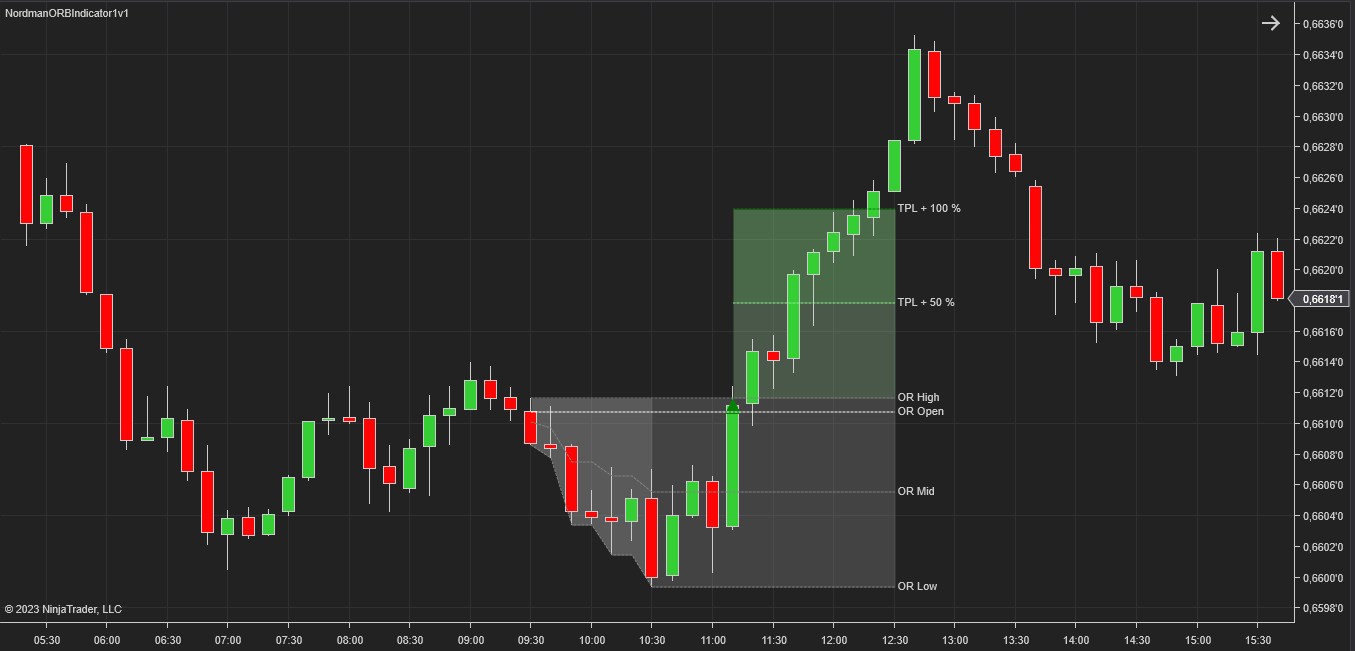
A bullish condition is registered when price breaks above OR High during the breakout tracking interval — marked with an upward directional arrow. A bearish condition is registered when price breaks below OR Low — marked with a downward directional arrow. If the Breakout Threshold is enabled, the condition is registered only after price has extended beyond the boundary by the configured minimum distance.
The indicator has the following parameters:
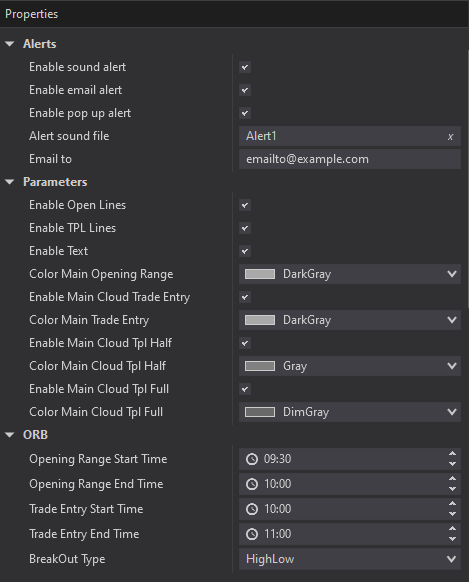
Alerts –configure alert delivery: sound notifications with selectable audio file, email, and pop-up message — each configurable independently.
Opening Range Start / End Time – defines the start and end of the range measurement period.
Trade Entry Start / End Time – defines the start and end of the breakout tracking interval.
BreakOut Type – selects the detection method: bar shadow (High/Low) or bar close.

We can customize this indicator to your needs — adding functions, modifying logic, or integrating it with other tools for your workflow.
We also convert indicators into Automated Trading Strategies with advanced functions (trailing stops, risk management, filters) tailored to your trading style strictly according to your specifications.
Request a free consultation to discuss the technical scope and timeline of your project.
We are committed to the ongoing development and refinement of our indicators. If you’ve spotted a bug, feel that something essential is missing, or have ideas that could make the indicator even better, just send us a message. Your feedback helps us improve and deliver tools that truly meet traders’ needs.
The indicator provides a set of exposed analytical plot outputs designed for structured integration with third-party strategy builders and automation tools such as BloodHound and BlackBird (SharkIndicators), as well as other algorithmic trading environments.
| Analytical Plot Name | Output Values | Description |
| Long | > 0 | Bullish directional detection condition. |
| Short | > 0 | Bearish directional detection condition. |
| OpenLevel | Value | |
| HighLevel | Value | |
| LowLevel | Value | |
| MidLevel | Value | |
| LongHalfTP | Value | |
| ShortHalfTP | Value | |
| LongTP | Value | |
| ShortTP | Value |
Plot output names and descriptions are technical identifiers intended solely for software integration purposes and do not constitute trading advice, signals, or recommendations.
Nordman Algorithms is a trade name of Nordman Algorithms OÜ (Reg. No. 14435535), registered in Tallinn, Estonia.
Software Nature & User Responsibility — Nordman Algorithms provides algorithmic software tools for technical analysis. Nordman Algorithms is not a financial advisor and is not liable for any losses. All trades conducted based on the software’s output are executed at the user’s sole discretion and risk.
Visual Markers & Signal Disclosure — This software may display visual markers (such as arrows, dots, or alerts) when predefined mathematical conditions are met. These markers are provided for educational and analytical purposes only, must not be interpreted as financial guidance, and do not constitute a recommendation to buy, sell, or hold any financial instrument. Users must independently validate all visual cues within their own trading methodology.
No Financial Advice — Nordman Algorithms does not provide discretionary trading signals, investment advice, or managed signal services. Our software represents a mathematical visualization of historical and real-time data. The appearance of a visual marker does not guarantee a profitable trade or predict future market behavior.
Trading Risk Warning — Futures, Forex, and options trading involve significant risk. Risk capital is money that can be lost without jeopardizing financial security. Only risk capital should be used for trading. Past performance is not indicative of future results. View Full Risk Disclosure: https://www.nordman-algorithms.com/risk-disclosure/
ESMA Risk Warning — Financial instruments, especially those involving leverage such as CFDs and Forex, are complex and carry a high risk of rapid financial loss. Our software provides analytical outputs and visual markers based on predefined mathematical conditions and does not mitigate or reduce inherent market risks. You should carefully consider whether you understand how leveraged financial instruments work and whether you can afford the high risk of losing your capital.
CFTC Rule 4.41 — Hypothetical or simulated performance results have inherent limitations. Unlike actual performance records, simulated results do not represent real trading. Because trades have not actually been executed, these results may under- or over-compensate for the impact of market factors such as liquidity. No representation is being made that any account will achieve profits or losses similar to those shown.
Trademark Notice — NinjaTrader® is a registered trademark of NinjaTrader Group, LLC. No NinjaTrader company has any affiliation with the owner, developer, or provider of the products or services described herein, or any interest, ownership or otherwise, in any such product or service, or endorses, recommends or approves any such product or service.