NinjaTrader Ichimoku Indicator is a composite technical analysis system — combining five interdependent lines that collectively reflect trend direction, momentum, and support/resistance structure.
A specially thought-out set of indicators included in the Ichimoku system, allows you to simultaneously provide information about the direction of the trend and the levels of support and resistance, which makes this indicator a multifunctional analytical tool for evaluating trend direction, key price levels, and market structure.
Ichimoku Indicator developed by us for the NinjaTrader 8 platform includes 5 analytical configurations: Ichimoku Cloud (Kumo) Breakout, Tenkan Sen / Kijun Sen Cross, Kijun Sen Cross, Senkou Span Cross, Chikou Span Cross with advanced settings to register strong, neutral and weak conditions.
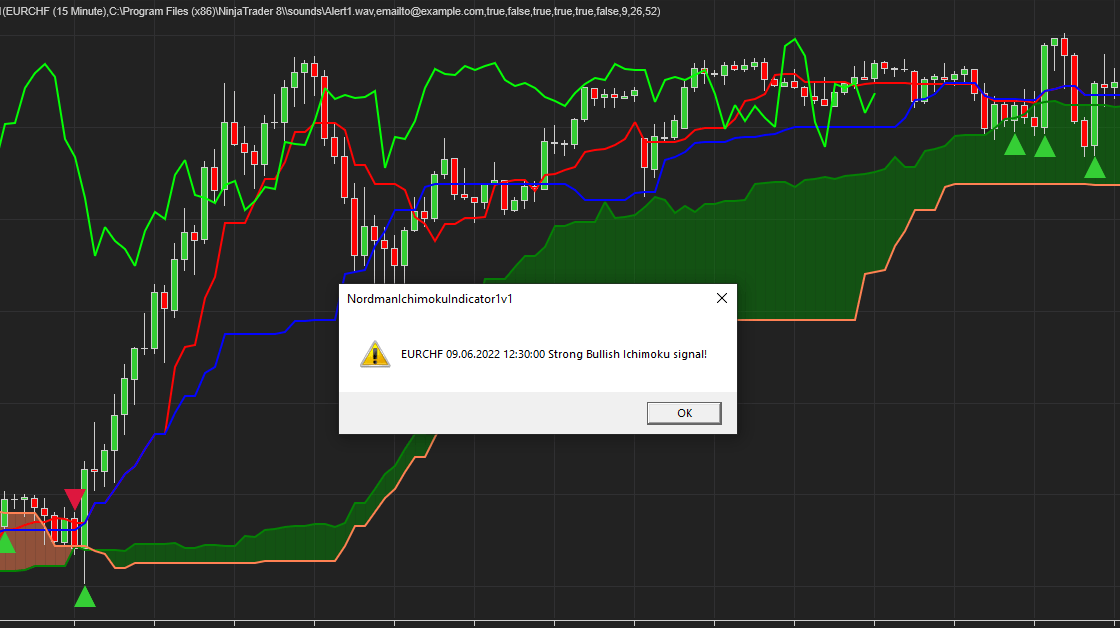
The NinjaTrader Ichimoku Indicator allows you to set up different types of alerts.
Ichimoku Indicator consists of five main components (indicator lines), each of which has its own name, construction method and function assigned to it:
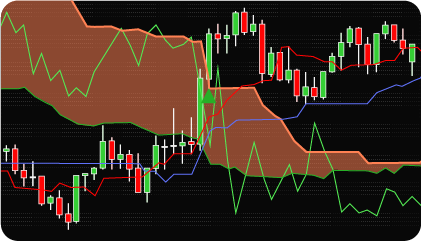
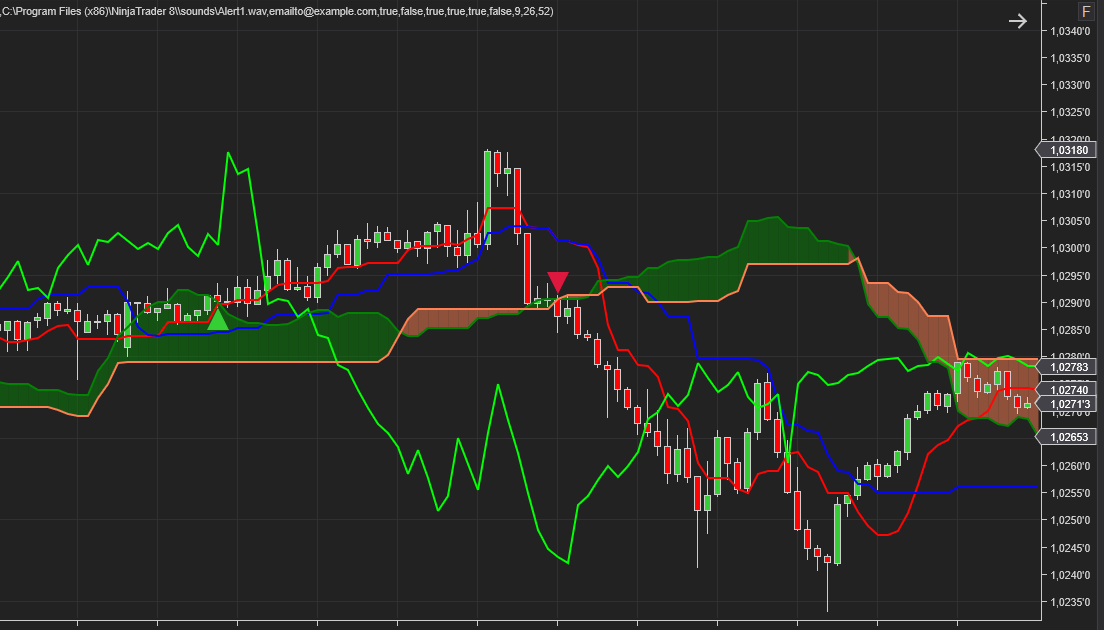
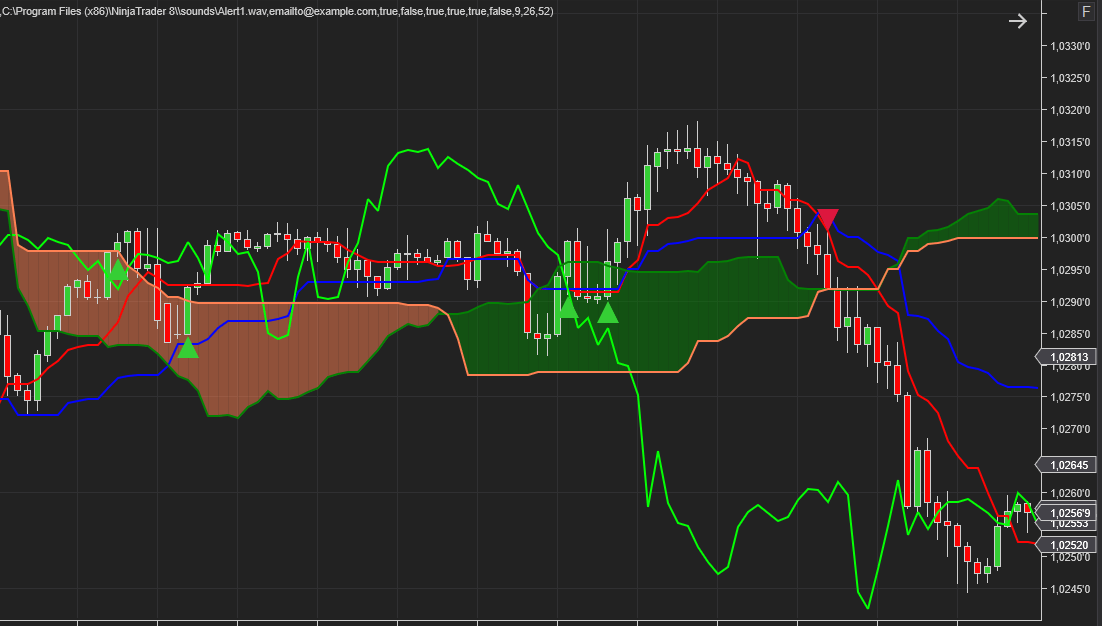
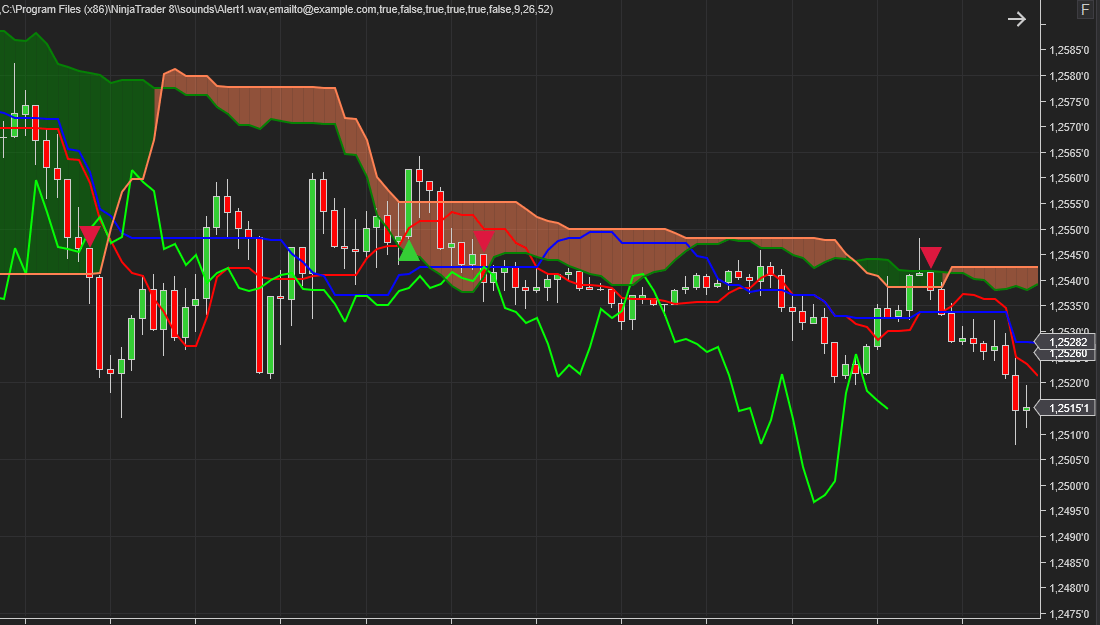
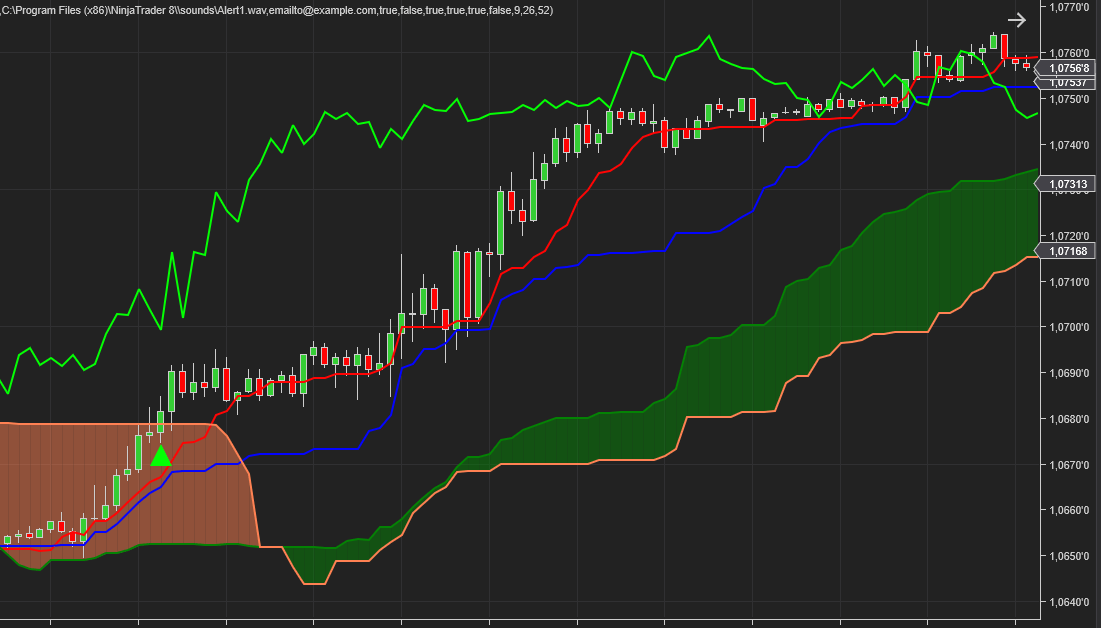
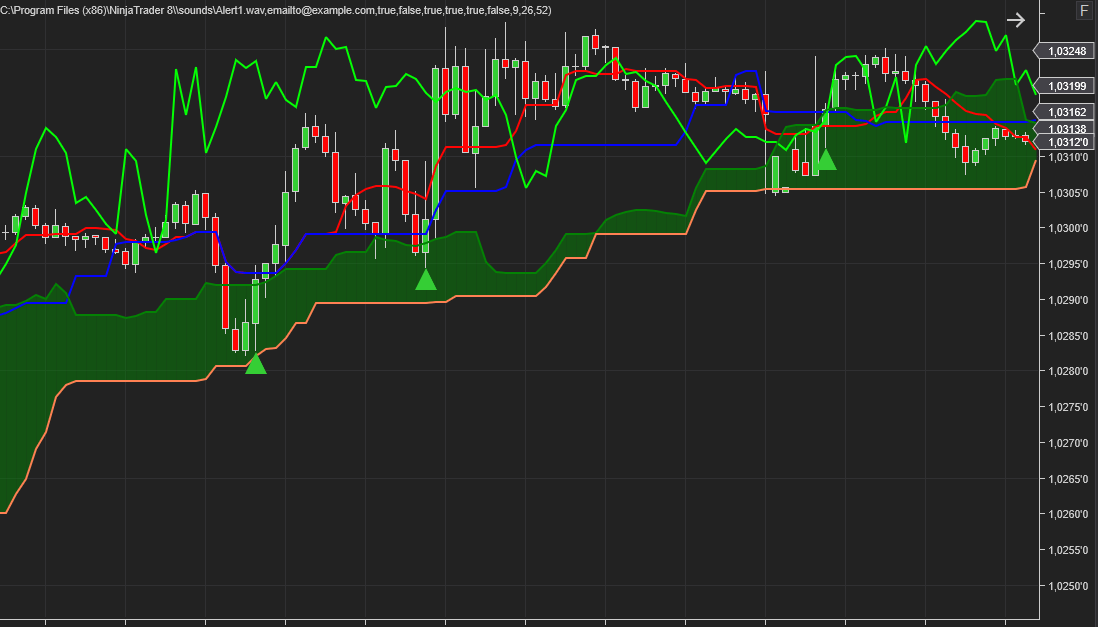
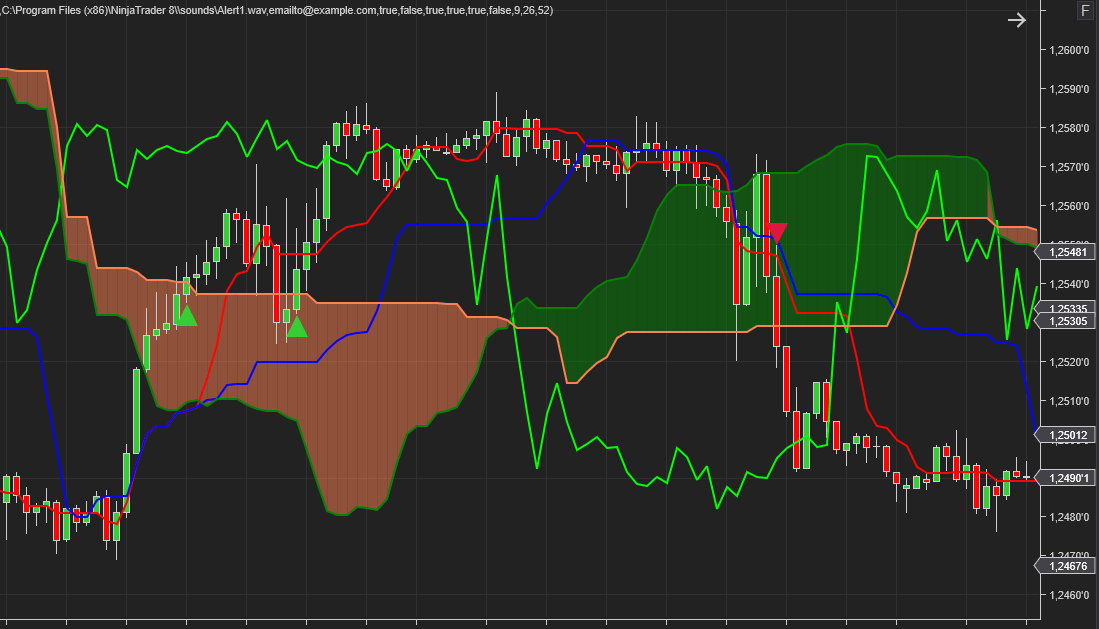
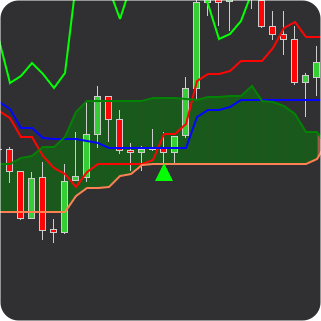
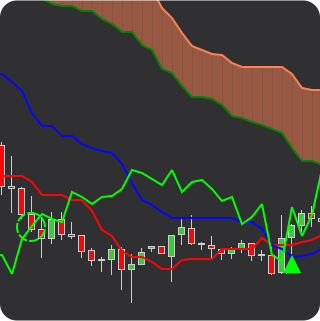
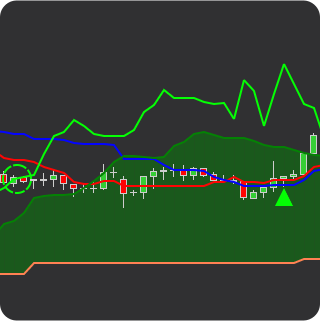
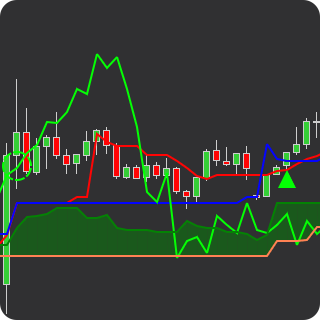
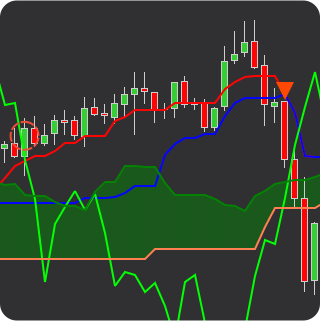
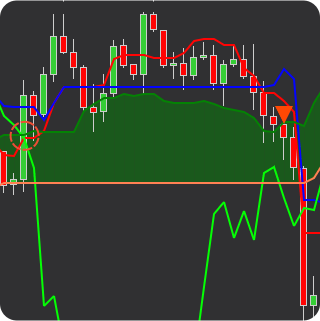
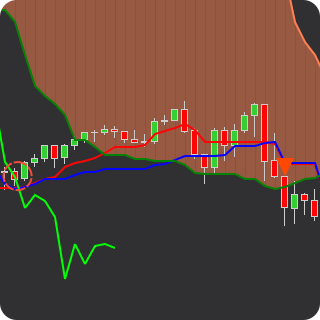
Essentially a cloud (Kumo) formed by Senkou lines Span A and B, is the zone of support and resistance of the trend. And also a trend indicator: if the price is in the cloud, the market is flat, and if the price is outside the cloud, there is a trend in the market (if the cloud is at the top, then the trend is down, and if it is down, then it is up).
The color of the cloud also indicates the current trend. If the cloud is colored in the color of the first line (dark green), then the market is in an uptrend, and if it is in the color of the second line (coral red), it is a downtrend.
The analytical depth of the Ichimoku system comes from the interaction between its lines rather than from any single component in isolation. Tenkan-Sen and Kijun-Sen reflect short and long-term momentum respectively — their relative position and slope indicate whether the current directional pressure is building or decelerating. The Kumo cloud projects both support/resistance structure and trend bias simultaneously: its thickness reflects the strength of the price barrier, while its future position — shifted 26 periods forward — gives the chart a forward-looking structural reference that most single-line indicators cannot provide. Chikou Span adds a historical confirmation layer by plotting current price against the price structure from 26 periods ago, allowing the analyst to assess whether the current move has precedent in recent market behavior. This multi-layered cross-referencing between past, present, and projected price levels is what distinguishes Ichimoku from standard overlay indicators.
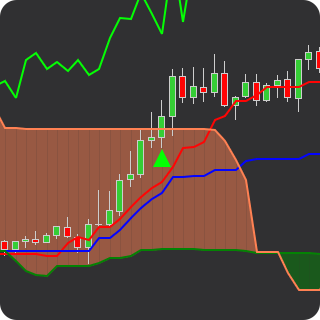
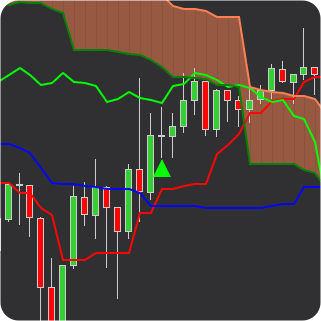
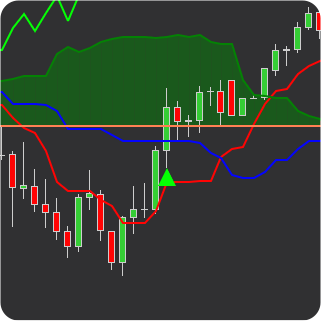
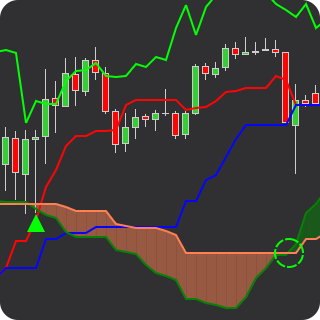
A bullish condition is registered when the price breaks the upper limit of Kumo (Cloud)
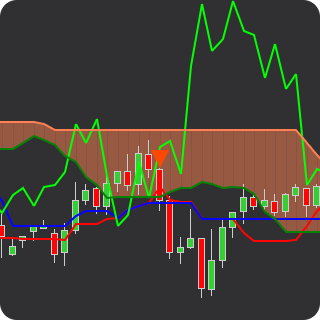
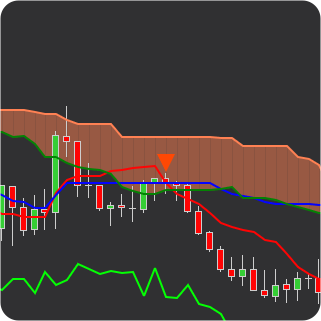
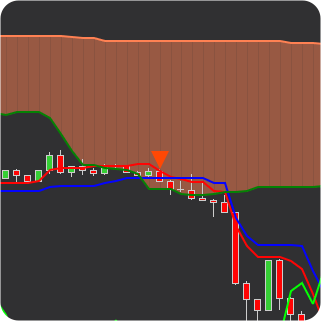
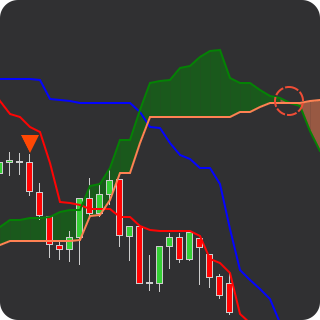
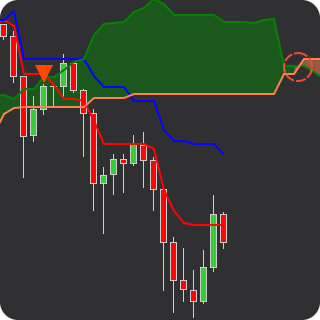
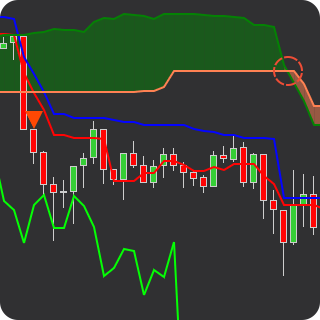
When the price breaks the lower boundary of Kumo (Cloud), a bearish condition is registered.
A bullish condition is registered when the Tenkan-Sen crosses the Kijun-Sen from the bottom up.
A weak condition is registered when the crossover is below the Kumo.
A neutral condition is registered when the crossover is inside the Kumo.
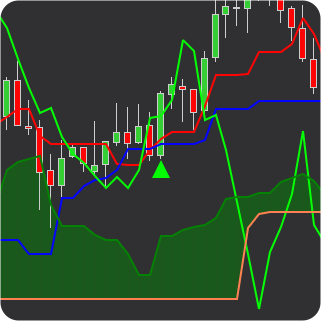
A strong condition is registered when the crossover is above the Kumo.
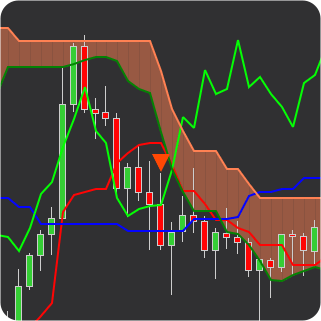
A bearish condition is registered when Tenkan-Sen crosses Kijun-Sen from top to bottom.
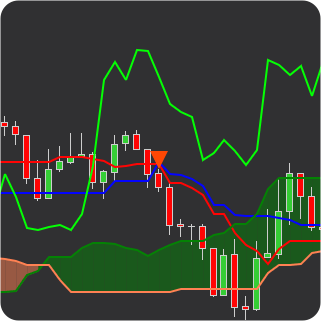
A weak condition is registered when the crossover is above Kumo.
A neutral condition is registered when the crossover is inside Kumo.
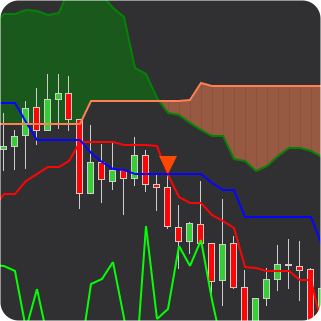
A strong condition is registered when the crossover is below Kumo.
A bullish condition is registered when the price crosses the Kijun-Sen upwards.
The crossover is below Kumo – a weak bullish condition.
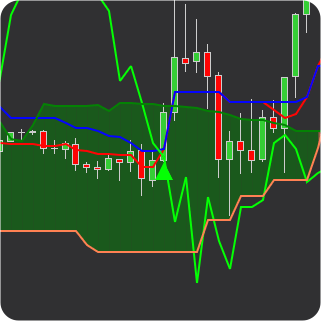
The crossover is inside Kumo – a neutral bullish condition.
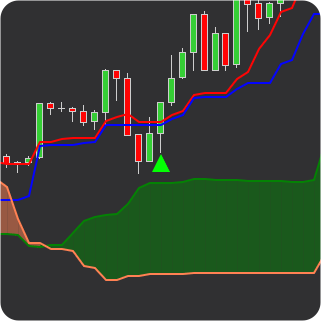
The crossover is above Kumo – a strong bullish condition.
A bearish condition is registered when the price crosses the Kijun Sen from top to bottom.
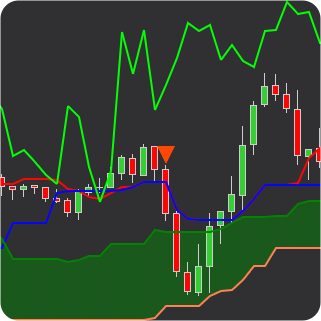
The crossover is above Kumo – a weak bearish condition.
The crossover is inside Kumo – a neutral bearish condition.
The crossover is below Kumo – a strong bearish condition.
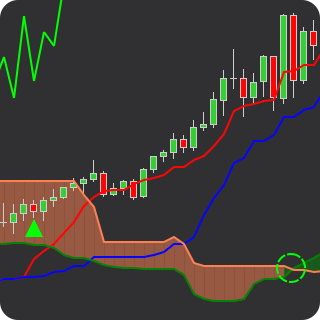
A bullish condition is registered when Senkou Span A crosses Senkou Span B from bottom to top.
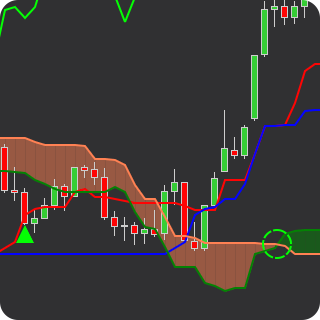
A weak condition is registered if the current price is below Kumo.
A neutral condition is registered if the current price is inside Kumo.
A strong condition is registered if the current price is above Kumo.
A bearish condition is registered when Senkou Span A crosses Senkou Span B from top to bottom.
A weak condition is registered if the current price is above Kumo.
A neutral condition is registered if the current price is inside Kumo.
A strong condition is registered if the current price is below Kumo.
A bullish condition is registered when Chikou Span moves in the direction of the price (up) and crosses it from the bottom up.
Weak condition – the current price is lower Kumo.
Neutral condition – the current price is inside Kumo.
Strong condition – the current price is above Kumo.
A bearish condition is registered when Chikou Span moves in the direction of the price (down) and crosses it from top to bottom.
Weak condition – the current price is above Kumo.
Neutral condition – the current price is inside Kumo.
Strong condition – the current price is below Kumo.
The Ichimoku indicator reflects calculations based on historical price data and does not predict future price movement. Registered conditions do not guarantee any particular market outcome and should be evaluated within a broader analytical framework.
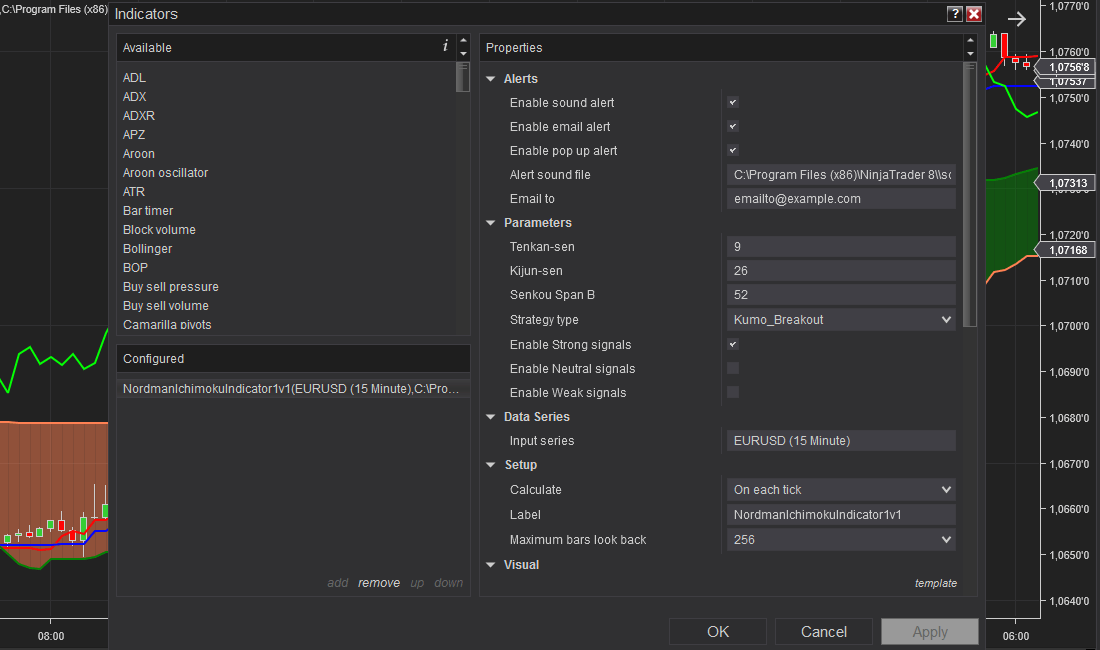
The indicator has the following parameters:
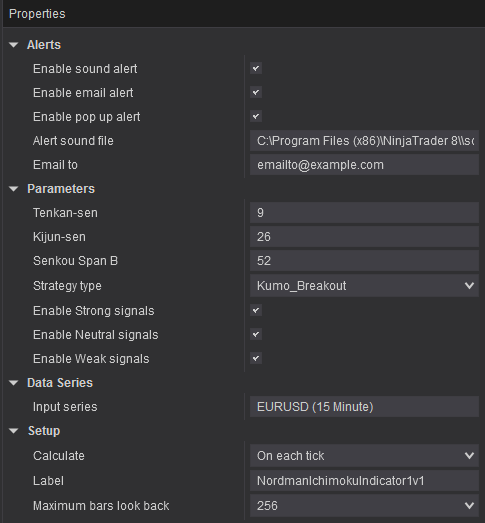
Alerts – setting up various types of alerts.
Parameters – setting individual parameters of Ichimoku lines.
Strategy type – selection of strategy type from 5 available: Ichimoku Cloud (Kumo) Breakout, Tenkan Sen / Kijun Sen Cross, Kijun Sen Cross, Senkou Span Cross and Chikou Span Cross.
Enable_Strong_signals — enables or disables registration of strong analytical conditions across all selected strategy types.
Enable_Neutral_signals — enables or disables registration of neutral analytical conditions across all selected strategy types.
Enable_Weak_signals — enables or disables registration of weak analytical conditions across all selected strategy types.

We can customize this indicator to your needs — adding functions, modifying logic, or integrating it with other tools for your workflow.
We also convert indicators into Automated Trading Strategies with advanced functions (trailing stops, risk management, filters) tailored to your trading style strictly according to your specifications.
Request a free consultation to discuss the technical scope and timeline of your project.
We are committed to the ongoing development and refinement of our indicators. If you’ve spotted a bug, feel that something essential is missing, or have ideas that could make the indicator even better, just send us a message. Your feedback helps us improve and deliver tools that truly meet traders’ needs.
| Analytical Plot Name | Output Values | Description |
| WeakBullish | > 0 | Bullish directional detection condition (Weak) |
| NeutralBullish | > 0 | Bullish directional detection condition (Neutral) |
| StrongBullish | > 0 | Bullish directional detection condition (Strong) |
| WeakBearish | > 0 | Bearish directional detection condition (Weak) |
| NeutralBearish | > 0 | Bearish directional detection condition (Neutral) |
| StrongBearish | > 0 | Bearish directional detection condition (Strong) |
| TenkanSen | Indicator value | |
| KijunSen | Indicator value | |
| ChikouSpan | Indicator value | |
| SenkouSpanA | Indicator value | |
| SenkouSpanB | Indicator value |
Plot output names and descriptions are technical identifiers intended solely for software integration purposes and do not constitute trading advice, signals, or recommendations.
Nordman Algorithms is a trade name of Nordman Algorithms OÜ (Reg. No. 14435535), registered in Tallinn, Estonia.
Software Nature & User Responsibility — Nordman Algorithms provides algorithmic software tools for technical analysis. Nordman Algorithms is not a financial advisor and is not liable for any losses. All trades conducted based on the software’s output are executed at the user’s sole discretion and risk.
Visual Markers & Signal Disclosure — This software may display visual markers (such as arrows, dots, or alerts) when predefined mathematical conditions are met. These markers are provided for educational and analytical purposes only, must not be interpreted as financial guidance, and do not constitute a recommendation to buy, sell, or hold any financial instrument. Users must independently validate all visual cues within their own trading methodology.
No Financial Advice — Nordman Algorithms does not provide discretionary trading signals, investment advice, or managed signal services. Our software represents a mathematical visualization of historical and real-time data. The appearance of a visual marker does not guarantee a profitable trade or predict future market behavior.
Trading Risk Warning — Futures, Forex, and options trading involve significant risk. Risk capital is money that can be lost without jeopardizing financial security. Only risk capital should be used for trading. Past performance is not indicative of future results. View Full Risk Disclosure: https://www.nordman-algorithms.com/risk-disclosure/
ESMA Risk Warning — Financial instruments, especially those involving leverage such as CFDs and Forex, are complex and carry a high risk of rapid financial loss. Our software provides analytical outputs and visual markers based on predefined mathematical conditions and does not mitigate or reduce inherent market risks. You should carefully consider whether you understand how leveraged financial instruments work and whether you can afford the high risk of losing your capital.
CFTC Rule 4.41 — Hypothetical or simulated performance results have inherent limitations. Unlike actual performance records, simulated results do not represent real trading. Because trades have not actually been executed, these results may under- or over-compensate for the impact of market factors such as liquidity. No representation is being made that any account will achieve profits or losses similar to those shown.
Trademark Notice — NinjaTrader® is a registered trademark of NinjaTrader Group, LLC. No NinjaTrader company has any affiliation with the owner, developer, or provider of the products or services described herein, or any interest, ownership or otherwise, in any such product or service, or endorses, recommends or approves any such product or service.