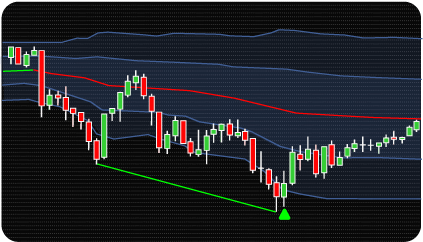
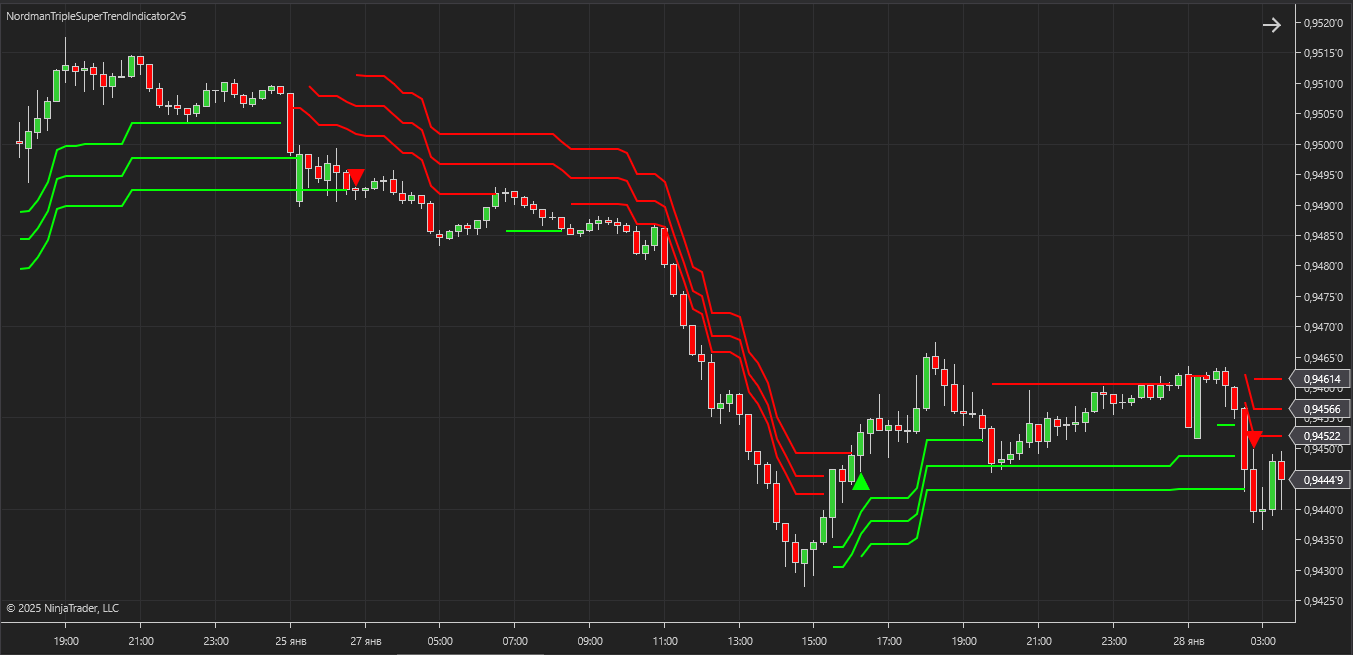
The SuperTrend indicator is a volatility-based trend-following tool derived from the Average True Range (ATR). It plots dynamic support and resistance levels that shift according to market volatility, allowing traders to observe directional phases and potential trend continuation zones.
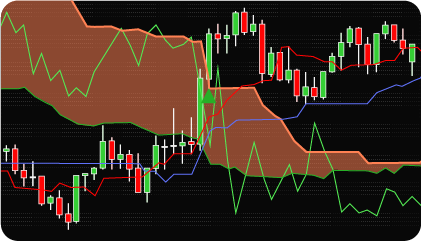
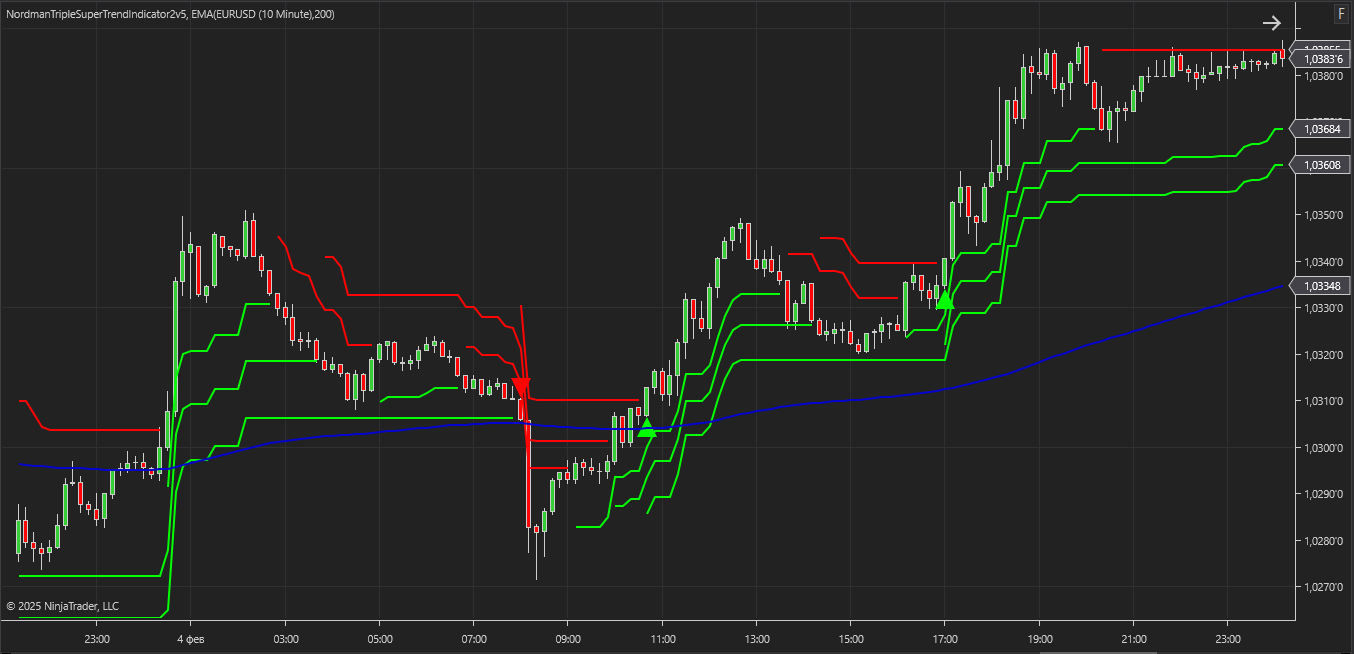
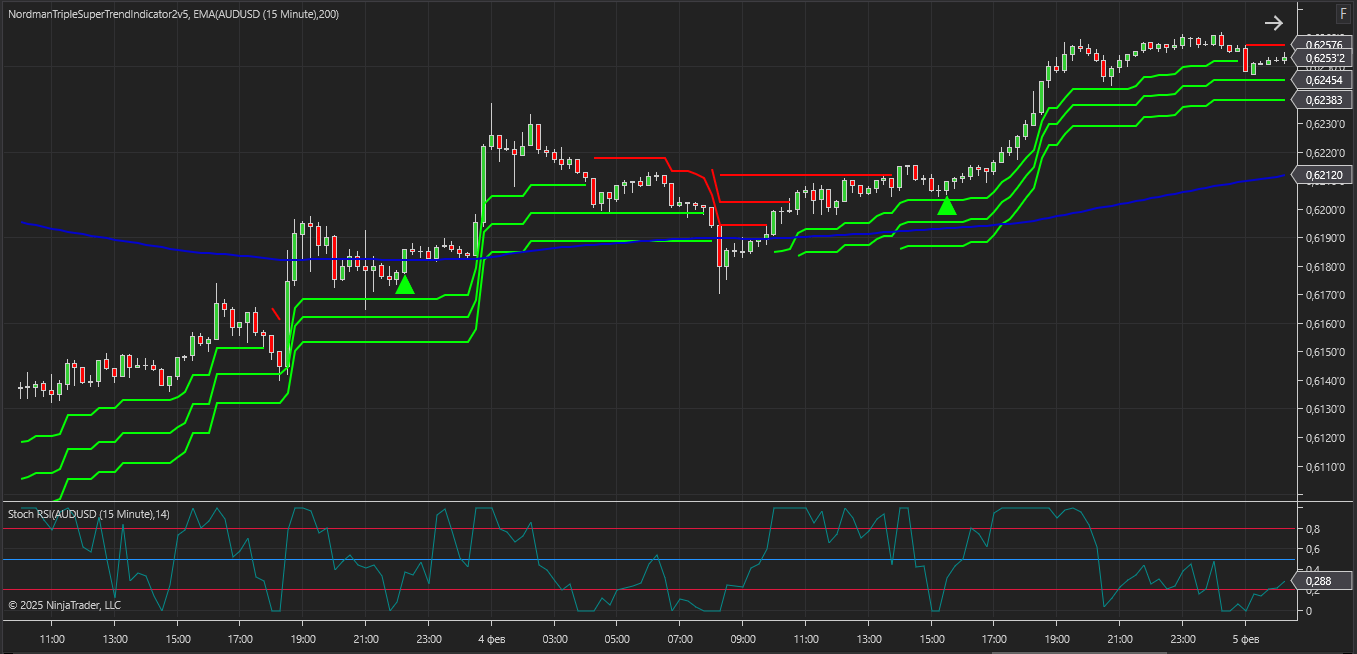
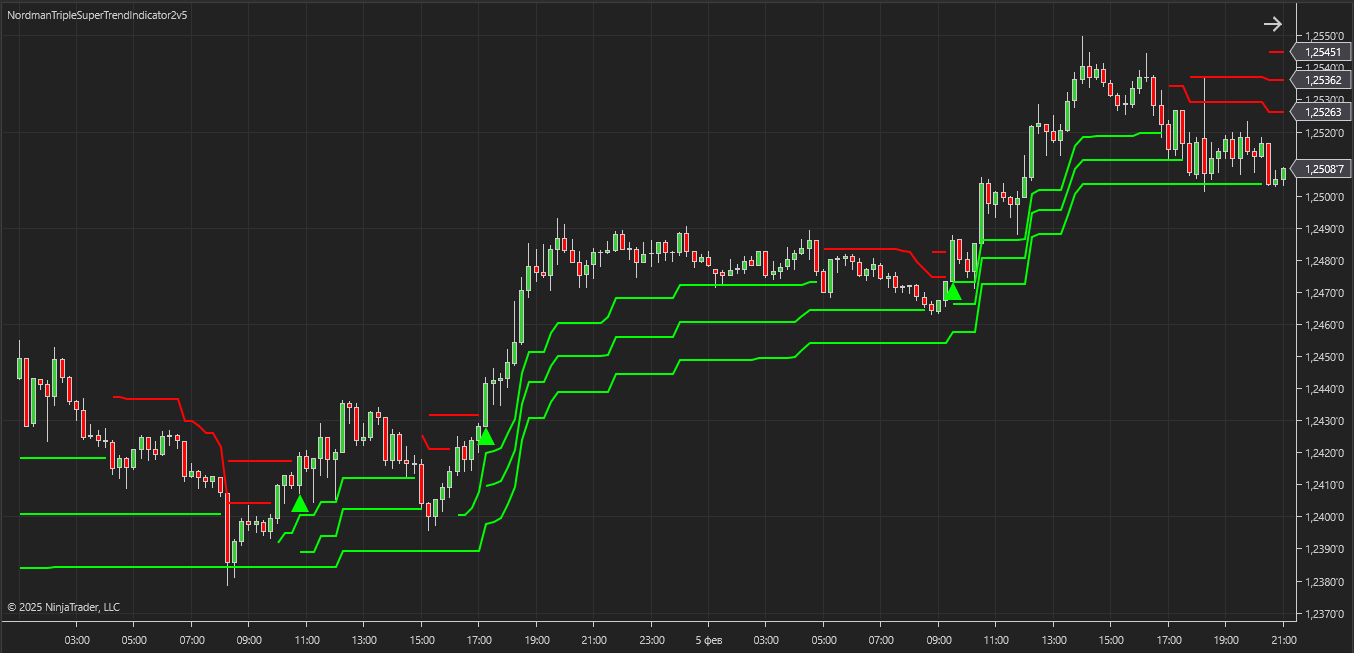
Building on this concept, the NinjaTrader Triple SuperTrend Indicator combines three SuperTrend indicators with additional confirmation filters, specifically the Exponential Moving Average (EMA) and the Stochastic Relative Strength Index (Stoch RSI). This combination introduces additional confirmation layers that help reduce market noise and highlight more stable trend structures. The indicator provides a structured framework for analyzing trend alignment using multiple SuperTrend calculations.
Each SuperTrend line is derived from the Average True Range (ATR), which adjusts the indicator to changing market volatility. When volatility increases, the SuperTrend bands expand; when volatility decreases, the bands contract, allowing the indicator to adapt dynamically to market conditions.
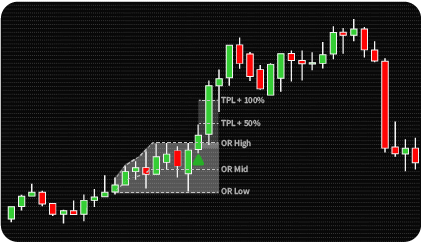
The indicator employs a multi-layered approach to trend analysis. Price movements in financial markets are rarely linear; even strong trends experience pullbacks. By using three SuperTrend indicators with different sensitivities, along with EMA and Stoch RSI filters, it effectively captures both the primary trend and short-term fluctuations, enabling a more structured and comprehensive market analysis.
Using multiple SuperTrend calculations allows the indicator to observe trend alignment across different sensitivity levels. Faster SuperTrend settings react quickly to short-term price fluctuations, while slower configurations capture broader directional phases. When several SuperTrend lines align, the chart reflects a stronger structural trend context.
The indicator is particularly effective in trending markets, helping traders observe sustained price movements during trending market phases. It is also useful in volatile markets, as the additional filters distinguish true trends from short-term price fluctuations. Traders can customize the settings to suit their trading style, enabling or disabling filters as needed.
Some of the key features of the indicator include:
The NinjaTrader Triple SuperTrend indicator consists of:
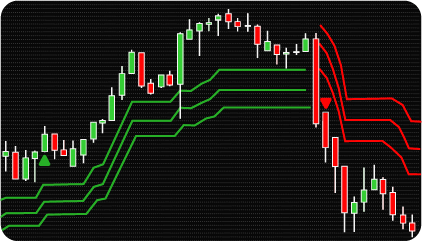
Three SuperTrend indicators – Determine the direction of the trend.
Exponential Moving Average (EMA, 200-period by default) – Confirms the overall trend by smoothing price action to identify long-term trends.
Stoch RSI Oscillator – Measures momentum extremes, focusing on momentum shifts and potential structural rebalancing phases.
Bullish / Bearish Context Identification
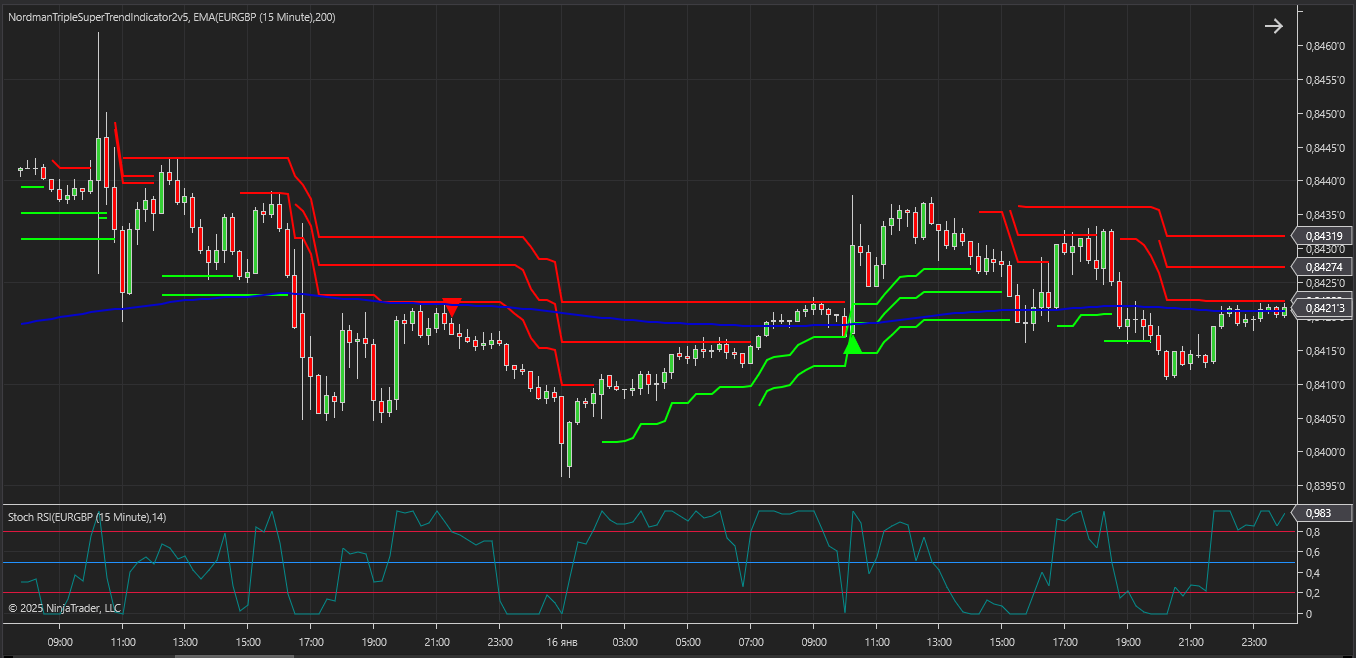
Bullish Alignment Conditions:
Bearish Alignment Conditions:
The indicator has the following parameters:
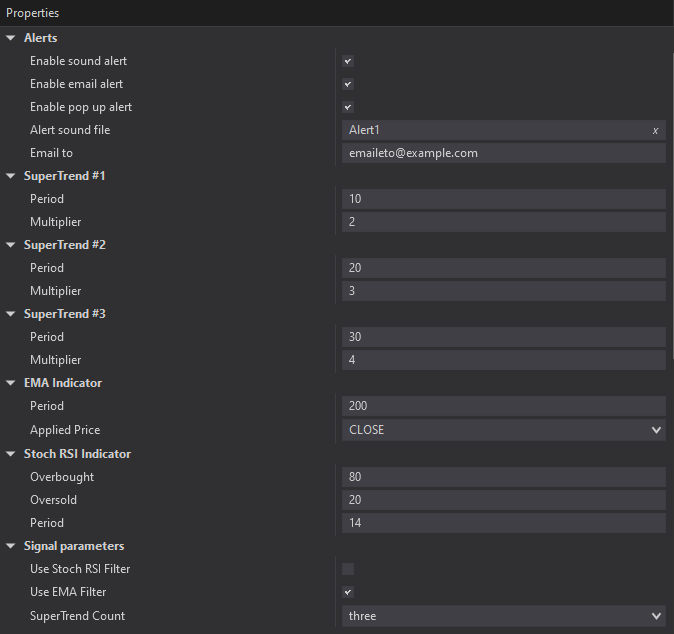
Alerts – Configure various types of alerts.
SuperTrend #1-3 – Set the main parameters of SuperTrends (period and multiplier).
EMA Indicator – Set the period and select the applied price type (OPEN, HIGH, LOW, CLOSE, HL2, HLC3, OHLC4).
Use EMA Filter — Enable/disable the EMA as a confirmation filter.
SuperTrend Count – Select how many SuperTrends should indicate a bullish (green) or bearish (red) trend (e.g., 3 out of 3 or 2 out of 3).
Stoch RSI Indicator Oversold/Overbought Level – Define the overbought/oversold level values.
Use Stoch RSI Filter – Enable/disable the Stoch RSI as a confirmation filter.
Stoch RSI Indicator OnZoneEntry / OnZoneExit –Additional marker plotting settings:

We can customize this indicator to your needs — adding functions, modifying logic, or integrating it with other tools for your workflow.
We also convert indicators into Automated Trading Strategies with advanced functions (trailing stops, risk management, filters) tailored to your trading style strictly according to your specifications.
Request a free consultation to discuss the technical scope and timeline of your project.
We are committed to the ongoing development and refinement of our indicators. If you’ve spotted a bug, feel that something essential is missing, or have ideas that could make the indicator even better, just send us a message. Your feedback helps us improve and deliver tools that truly meet traders’ needs.
Nordman Algorithms is a trade name of Nordman Algorithms OÜ (Reg. No. 14435535), registered in Tallinn, Estonia.
Software Nature & User Responsibility — Nordman Algorithms provides algorithmic software tools for technical analysis. Nordman Algorithms is not a financial advisor and is not liable for any losses. All trades conducted based on the software’s output are executed at the user’s sole discretion and risk.
Visual Markers & Signal Disclosure — This software may display visual markers (such as arrows, dots, or alerts) when predefined mathematical conditions are met. These markers are provided for educational and analytical purposes only, must not be interpreted as financial guidance, and do not constitute a recommendation to buy, sell, or hold any financial instrument. Users must independently validate all visual cues within their own trading methodology.
No Financial Advice — Nordman Algorithms does not provide discretionary trading signals, investment advice, or managed signal services. Our software represents a mathematical visualization of historical and real-time data. The appearance of a visual marker does not guarantee a profitable trade or predict future market behavior.
Trading Risk Warning — Futures, Forex, and options trading involve significant risk. Risk capital is money that can be lost without jeopardizing financial security. Only risk capital should be used for trading. Past performance is not indicative of future results. View Full Risk Disclosure: https://www.nordman-algorithms.com/risk-disclosure/
ESMA Risk Warning — Financial instruments, especially those involving leverage such as CFDs and Forex, are complex and carry a high risk of rapid financial loss. Our software provides analytical outputs and visual markers based on predefined mathematical conditions and does not mitigate or reduce inherent market risks. You should carefully consider whether you understand how leveraged financial instruments work and whether you can afford the high risk of losing your capital.
CFTC Rule 4.41 — Hypothetical or simulated performance results have inherent limitations. Unlike actual performance records, simulated results do not represent real trading. Because trades have not actually been executed, these results may under- or over-compensate for the impact of market factors such as liquidity. No representation is being made that any account will achieve profits or losses similar to those shown.
Trademark Notice — NinjaTrader® is a registered trademark of NinjaTrader Group, LLC. No NinjaTrader company has any affiliation with the owner, developer, or provider of the products or services described herein, or any interest, ownership or otherwise, in any such product or service, or endorses, recommends or approves any such product or service.