The NinjaTrader TDI Indicator is a multifunctional tool designed to support structured analysis of trend direction, momentum, and volatility. It integrates three well-known indicators — the RSI (Relative Strength Index), Moving Average, and Bollinger Bands — into a unified system. This combination enables the indicator to simultaneously display trend direction, market strength, and volatility, making it a self-contained tool for multi-dimensional market analysis.
The TDI Indicator combines key elements of technical analysis to offer a detailed perspective on market behavior:
Each component addresses a different dimension of price behavior — RSI captures momentum, MA reflects trend direction, and Bollinger Bands define volatility context. Together they reduce the likelihood of evaluating a condition in isolation from the broader market structure.
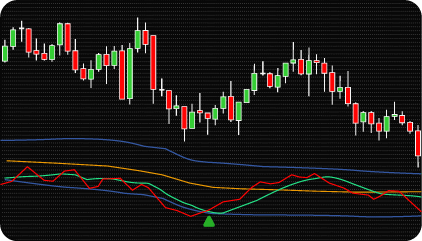
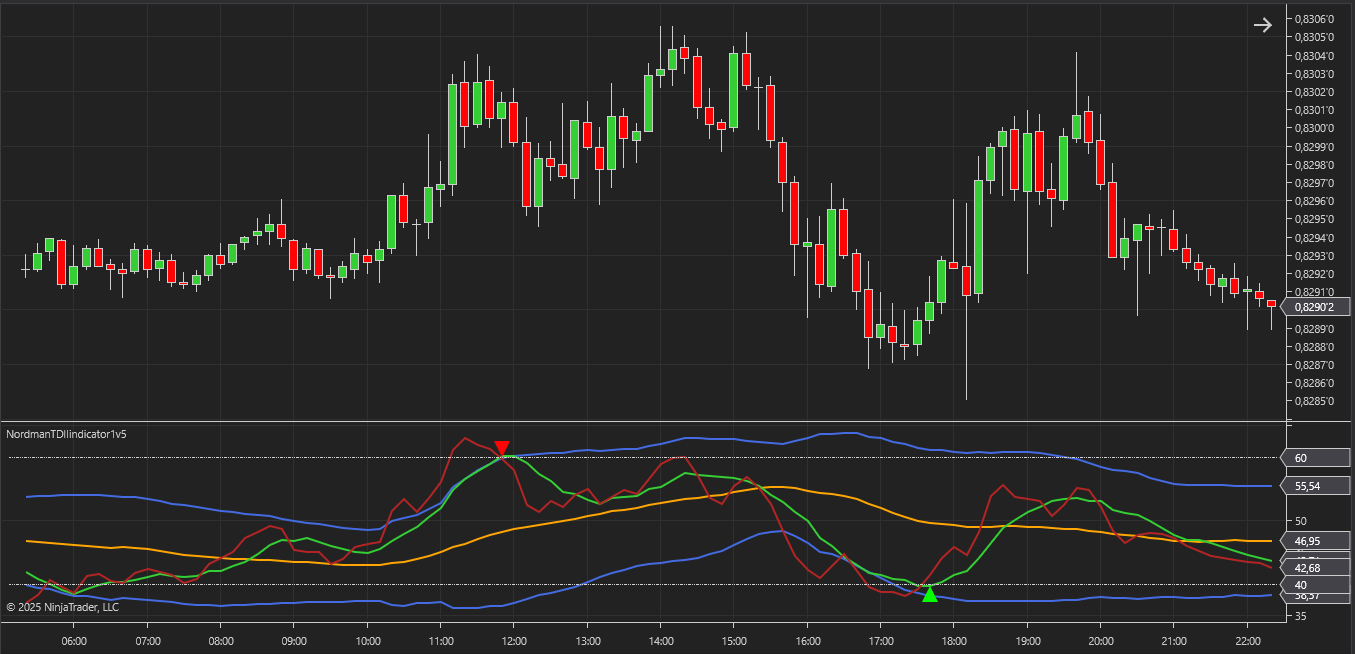
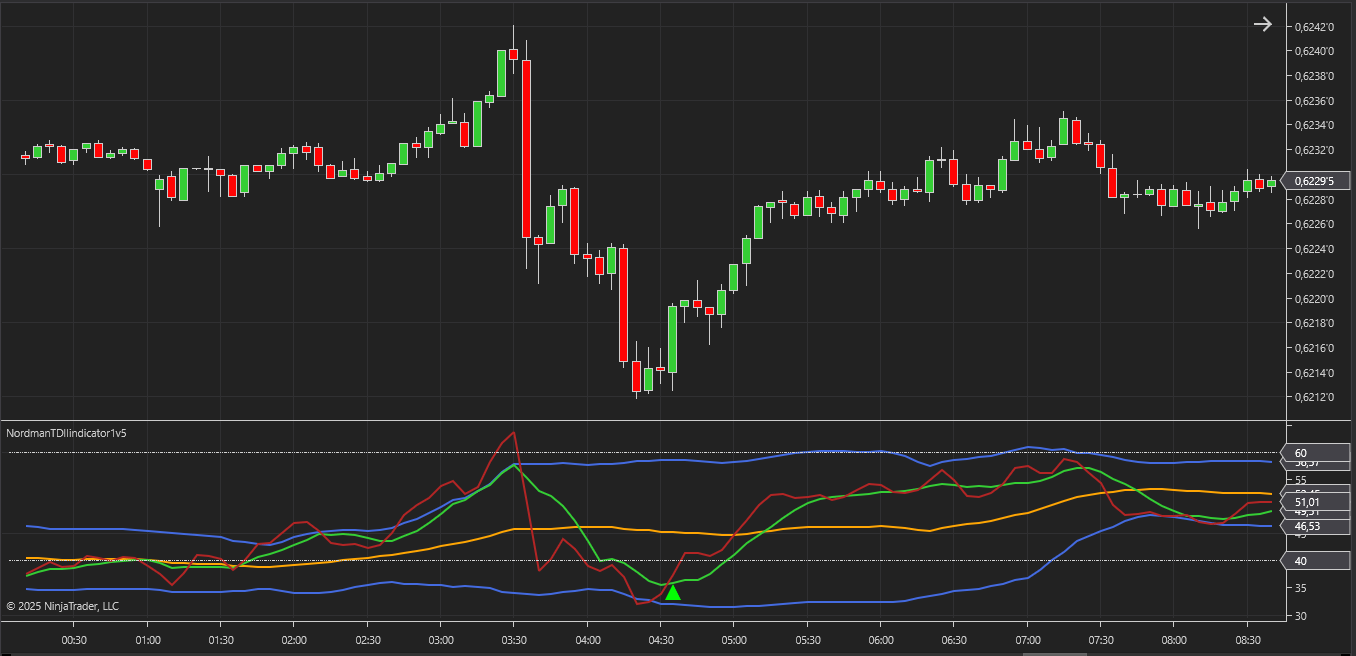
The main lines of the indicator are red line and green (price line / fast line). Both lines represent the smoothed values of the RSI indicator.
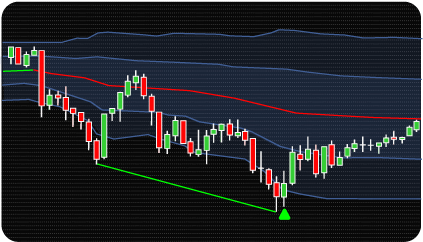
Bollinger Bands are depicted by three lines: the orange line (a Moving Average), which serves as the middle line between the upper and lower borders of the channel, and two blue lines (upper and lower channel borders). These blue lines are also Moving Averages but are shifted by several standard (root mean square) deviations.
Gray (dash-dotted) lines indicate the boundaries of the overbought and oversold zones.
The indicator serves multiple purposes.
Firstly, it can be used to determine the current trend direction. A green line positioned above the orange line reflects a shift toward upward momentum, while the green line falling below the orange line indicates a transition to a downtrend.
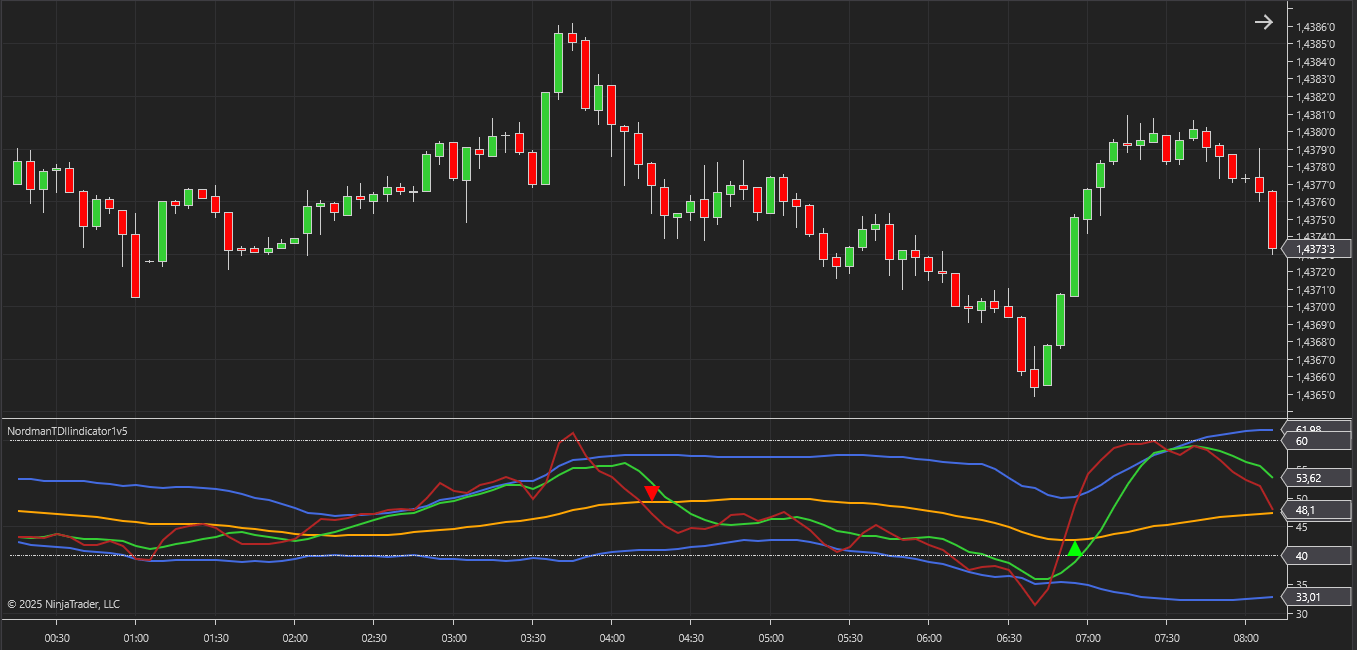
Secondly, the indicator provides early warnings about the start of new trends. For example, when the red line crosses the green line from below, it reflects an early shift in momentum toward an upward direction. Conversely, when the red line crosses from above, it indicates the start of a downward trend.
Additionally, the indicator measures the current strength of the market. A steeper slope of the green line reflects stronger price movement, while a horizontal green line suggests a flat market. Expanding channel lines signal increasing volatility, while narrowing lines suggest decreasing volatility and a reduction in market activity. When the red line moves beyond the channel boundaries, it may indicate an increase in reversal pressure relative to recent price behavior.
The TDI indicator reflects mathematical relationships between RSI, MA, and Bollinger Bands based on historical price data. It does not predict future price movement, does not account for fundamental factors or sudden volatility shifts, and registered conditions do not guarantee any particular market outcome. All analytical output should be evaluated within a broader trading methodology.
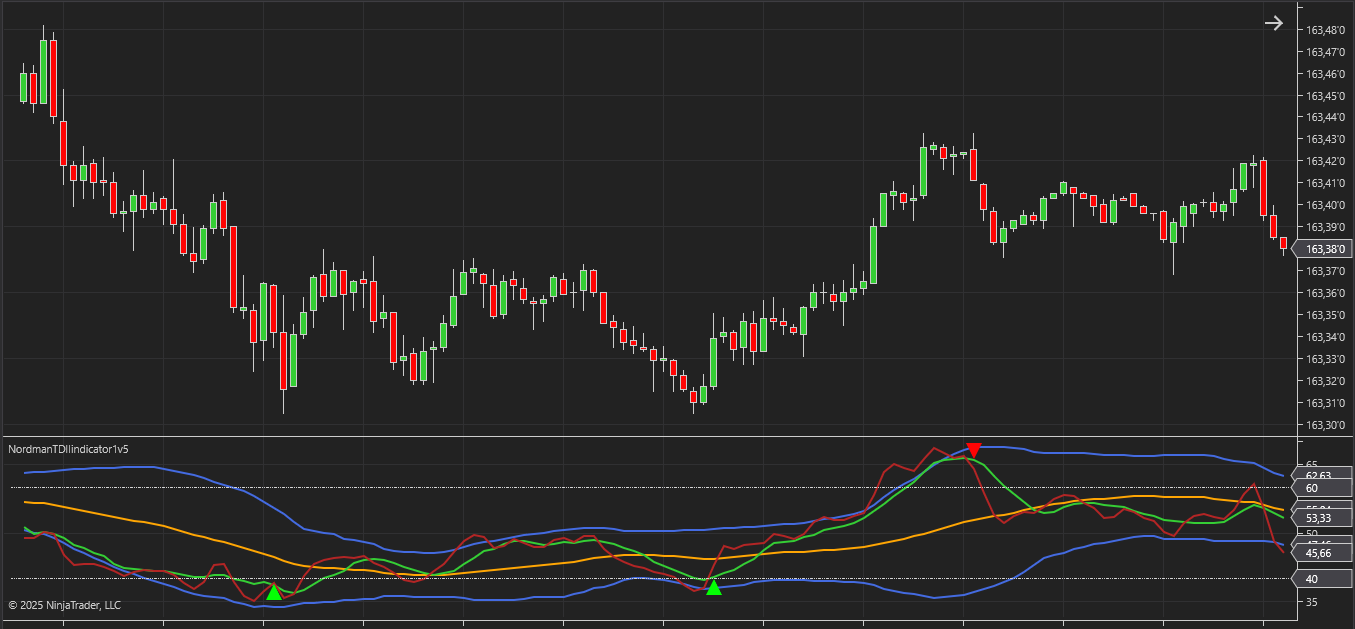
PriceAndSignalLinesCross Mode:
In this mode, contextual conditions are registered when the red line crosses the green line. A crossover from below to above registers an upward condition, while a crossover from above to below registers a downward condition. This type of signal includes additional settings for signal conditions:
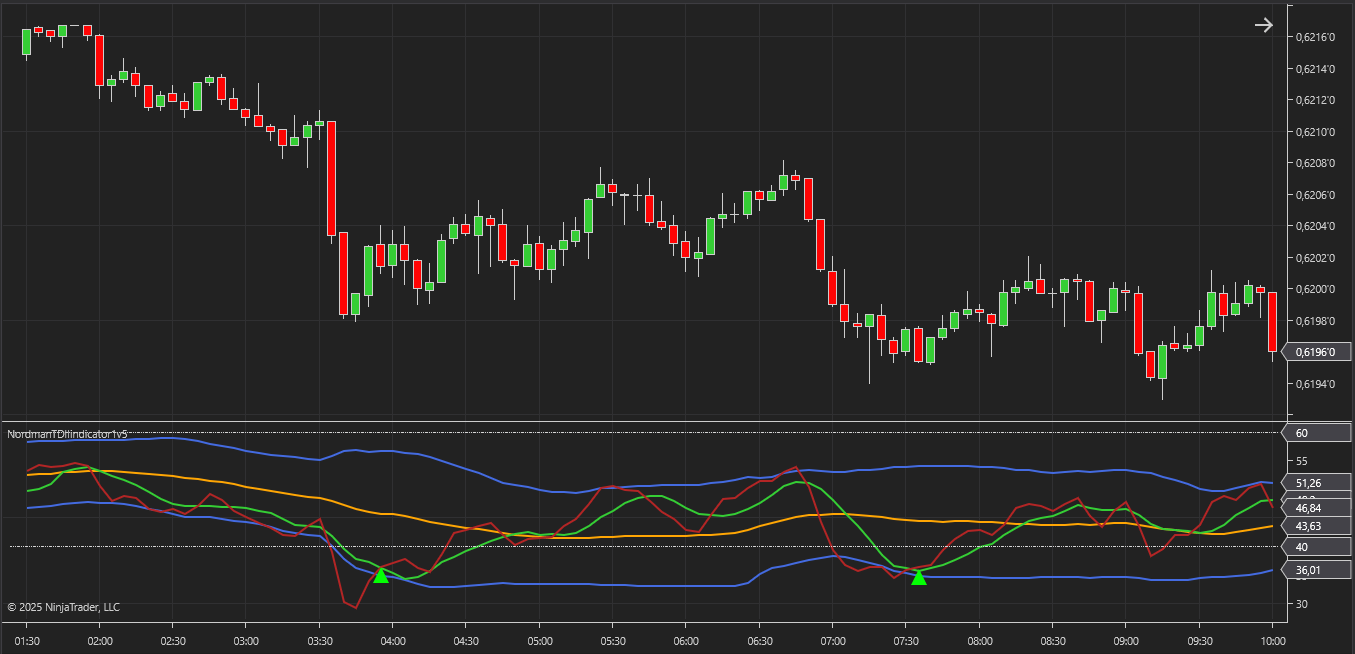
MarketBaseLineCross Mode:
This mode relies on the intersections of the red line with the middle of the channel (orange). When the red line crosses the orange line from below to above, it registers an upward condition. Conversely, a crossover from above to below registers a downward condition. Similar to the PriceAndSignalLinesCross mode, the settings provide for the use of additional conditions: the crossing must occur within the overbought or oversold zones, and the red line must first go beyond the boundaries of the Bollinger Bands.
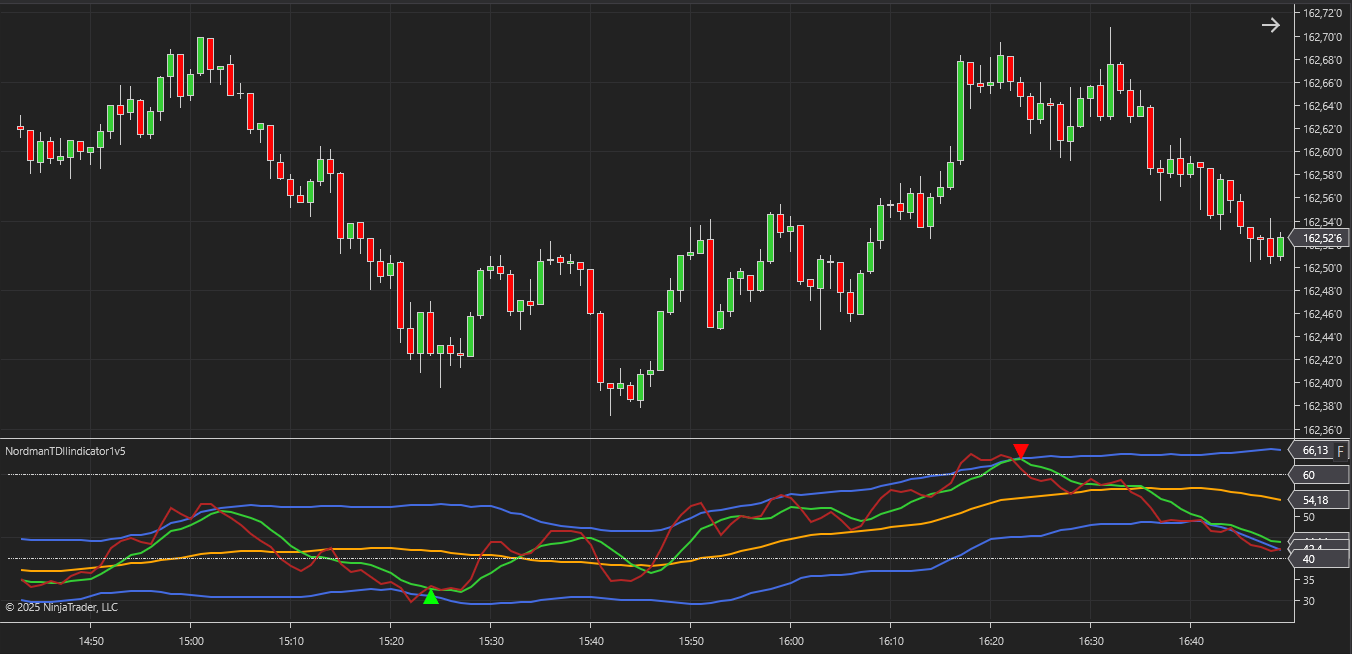
The parameters for the overbought and oversold zones can be adjusted in the indicator settings. It is important to consider the following when configuring these levels:
Higher Overbought Values: register fewer conditions but with a narrower set of qualifying criteria.
Lower Overbought Values: register conditions more frequently, with a broader set of qualifying criteria.
The same principle applies in reverse for the oversold zone. Adjusting these thresholds allows traders to tailor the indicator’s sensitivity to their specific trading strategy and market conditions.
The indicator has the following parameters:
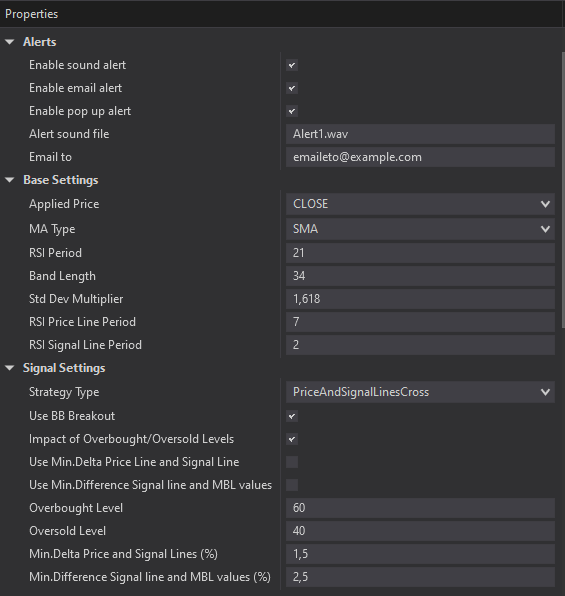
Applied Price – is a choice type prices for calculations (OPEN, HIGH, LOW, CLOSE, HL2, HLC3, OHLC4).
MA Type – selecting the type of moving average calculations.
Std Dev Multiplier – standard deviation multiplier of Bollinger Bands.
RSI Price Line Period – period for calculating the price line / fast RSI line.
RSI Signal Line Period – period for calculating the RSI signal line.
Strategy Type – selection of the indicator signal mode.
Use BB Breakout – enable / disable an additional condition for signal calculation: mandatory presence of a breakout.
Impact of Overbought / Oversold Levels – enable / disable an additional condition for signal calculation: influence of overbought/oversold levels.
Use Min. Delta Price Line and Signal Line – enable / disable the use of the minimum difference between the Price Line and Signal Line values when the lines cross. This parameter is designed to filter out minor crossings of the lines.
Overbought Level – overbought level values.
Oversold Level – oversold level values.
Alerts – setting up various types of alerts.

We can customize this indicator to your needs — adding functions, modifying logic, or integrating it with other tools for your workflow.
We also convert indicators into Automated Trading Strategies with advanced functions (trailing stops, risk management, filters) tailored to your trading style strictly according to your specifications.
Request a free consultation to discuss the technical scope and timeline of your project.
We are committed to the ongoing development and refinement of our indicators. If you’ve spotted a bug, feel that something essential is missing, or have ideas that could make the indicator even better, just send us a message. Your feedback helps us improve and deliver tools that truly meet traders’ needs.
Nordman Algorithms is a trade name of Nordman Algorithms OÜ (Reg. No. 14435535), registered in Tallinn, Estonia.
Software Nature & User Responsibility — Nordman Algorithms provides algorithmic software tools for technical analysis. Nordman Algorithms is not a financial advisor and is not liable for any losses. All trades conducted based on the software’s output are executed at the user’s sole discretion and risk.
Visual Markers & Signal Disclosure — This software may display visual markers (such as arrows, dots, or alerts) when predefined mathematical conditions are met. These markers are provided for educational and analytical purposes only, must not be interpreted as financial guidance, and do not constitute a recommendation to buy, sell, or hold any financial instrument. Users must independently validate all visual cues within their own trading methodology.
No Financial Advice — Nordman Algorithms does not provide discretionary trading signals, investment advice, or managed signal services. Our software represents a mathematical visualization of historical and real-time data. The appearance of a visual marker does not guarantee a profitable trade or predict future market behavior.
Trading Risk Warning — Futures, Forex, and options trading involve significant risk. Risk capital is money that can be lost without jeopardizing financial security. Only risk capital should be used for trading. Past performance is not indicative of future results. View Full Risk Disclosure: https://www.nordman-algorithms.com/risk-disclosure/
ESMA Risk Warning — Financial instruments, especially those involving leverage such as CFDs and Forex, are complex and carry a high risk of rapid financial loss. Our software provides analytical outputs and visual markers based on predefined mathematical conditions and does not mitigate or reduce inherent market risks. You should carefully consider whether you understand how leveraged financial instruments work and whether you can afford the high risk of losing your capital.
CFTC Rule 4.41 — Hypothetical or simulated performance results have inherent limitations. Unlike actual performance records, simulated results do not represent real trading. Because trades have not actually been executed, these results may under- or over-compensate for the impact of market factors such as liquidity. No representation is being made that any account will achieve profits or losses similar to those shown.
Trademark Notice — NinjaTrader® is a registered trademark of NinjaTrader Group, LLC. No NinjaTrader company has any affiliation with the owner, developer, or provider of the products or services described herein, or any interest, ownership or otherwise, in any such product or service, or endorses, recommends or approves any such product or service.