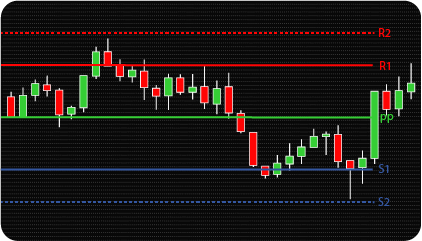
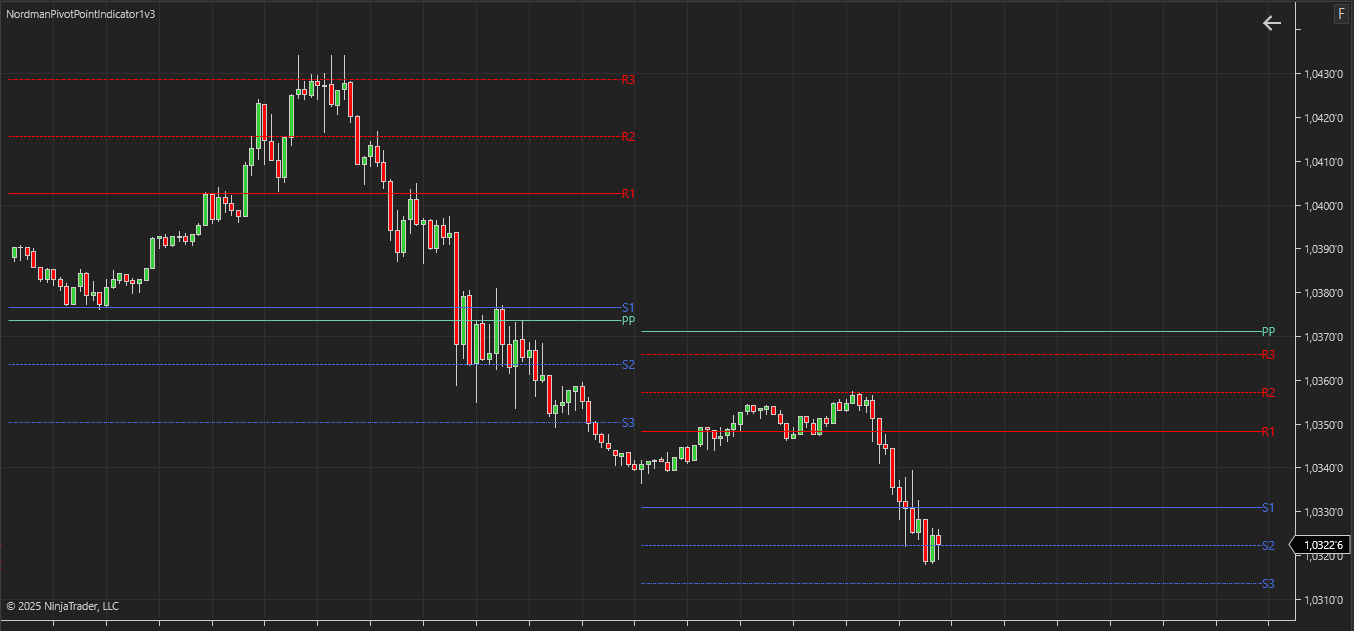
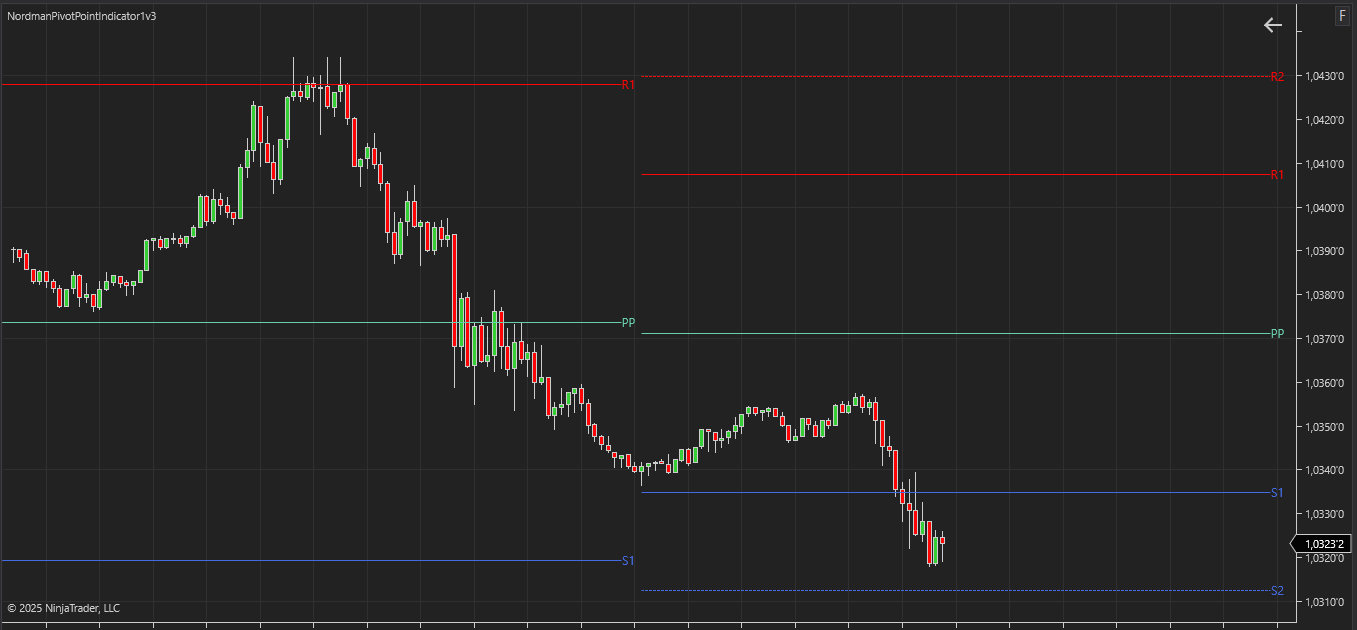
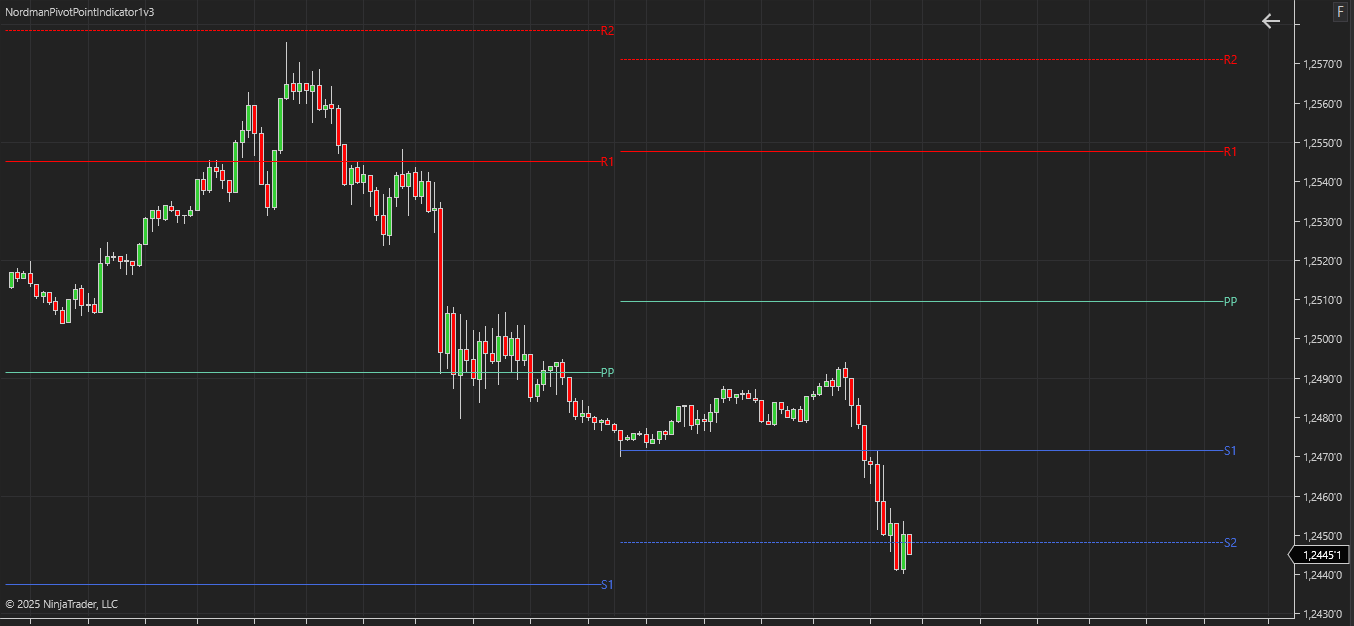
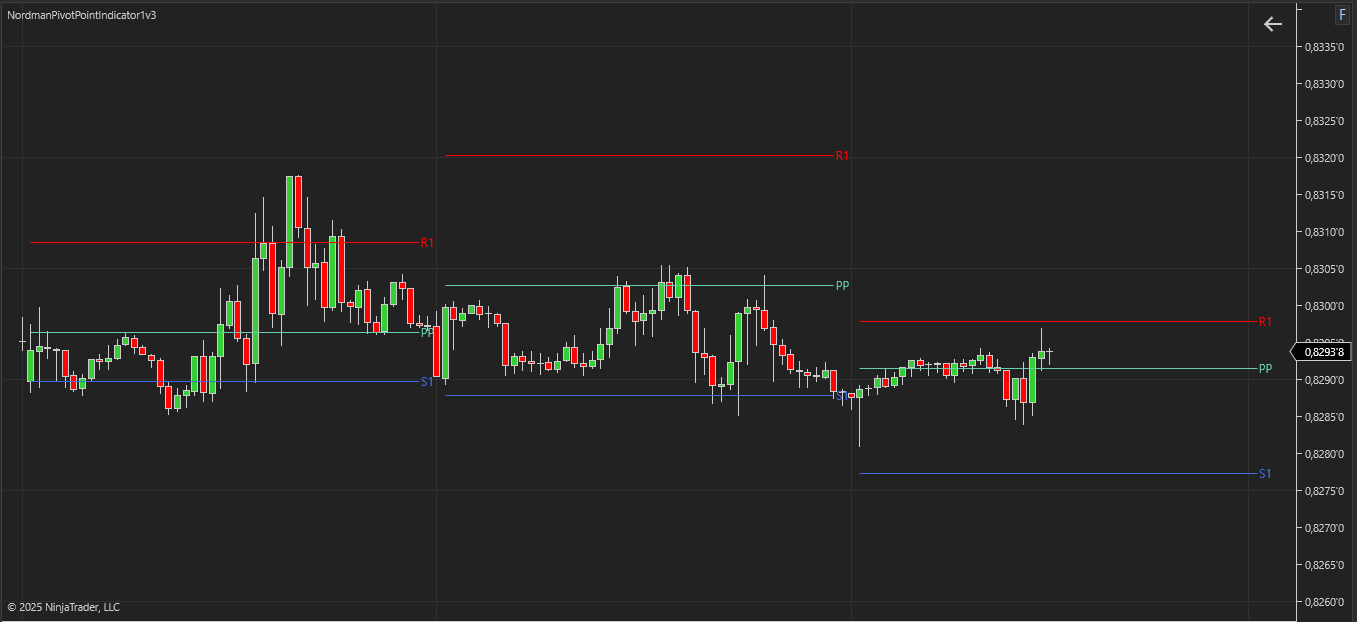
The Pivot Point Indicator calculates a set of structural price reference levels derived from the high, low, close, and in some methods the open of the previous calculation period. The central Pivot Point (PP) serves as the primary reference level — additional support and resistance levels are then calculated around it using method-specific formulas. The calculation method determines how many levels are produced, how they are positioned relative to PP, and what price inputs are weighted most heavily.
The indicator supports six calculation methods, each producing a different level structure:
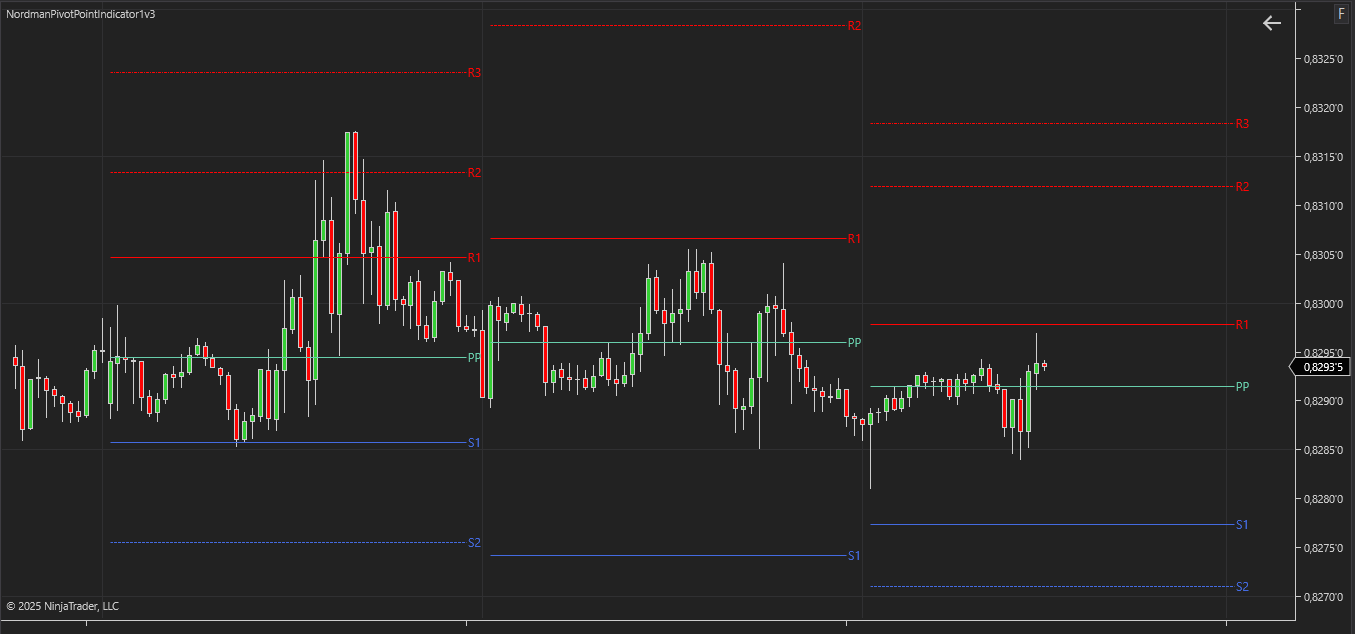
(1) Standard / Classical. Calculates the Pivot Point from the high, low, and closing prices of the chosen period. Four symmetrical support and resistance levels are derived from the Pivot Point and the price range.
The formula used to calculate Classical Pivot Points is:
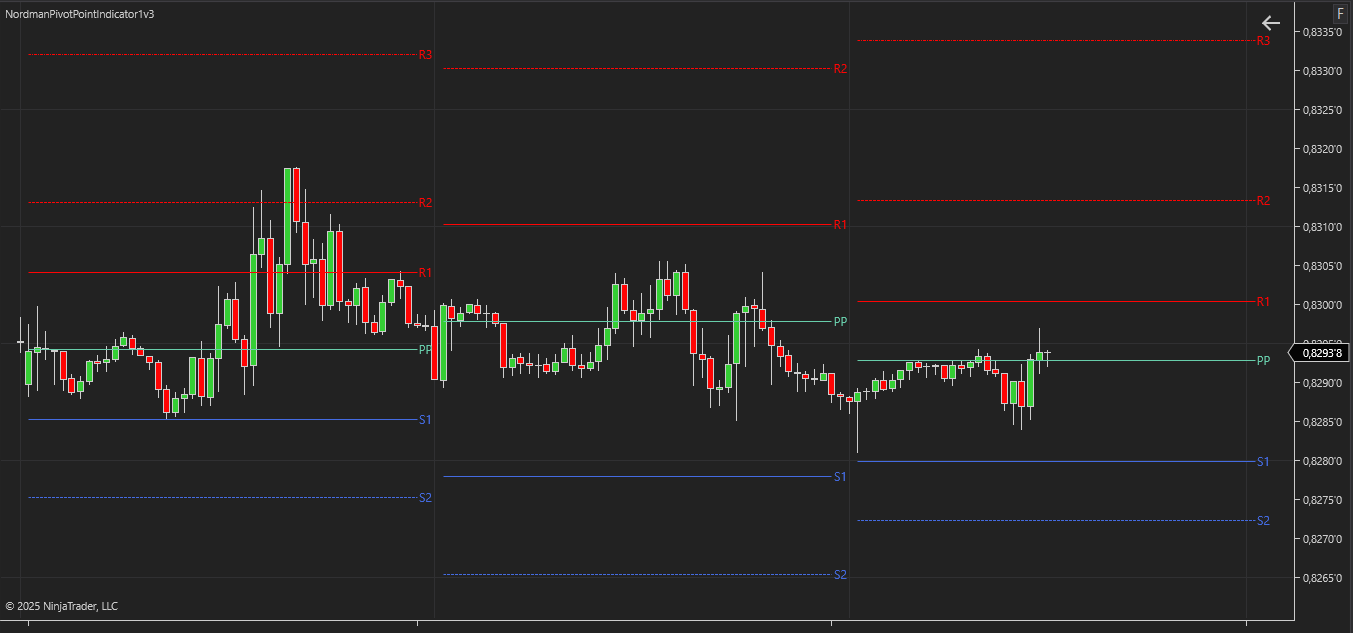
(2) Woodie. Applies additional weight to the opening price of the new period — producing a Pivot Point positioned closer to the current market price than the Classical method.
The formula used in the calculation of Woodie Pivot Points are:
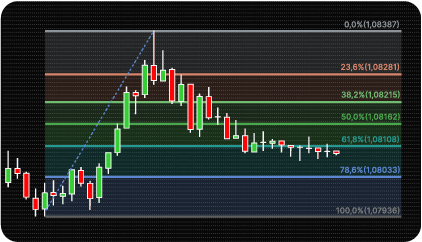
(3) Fibonacci. Calculates the Pivot Point using the standard formula, then derives three support and resistance levels using Fibonacci ratios applied to the price range.
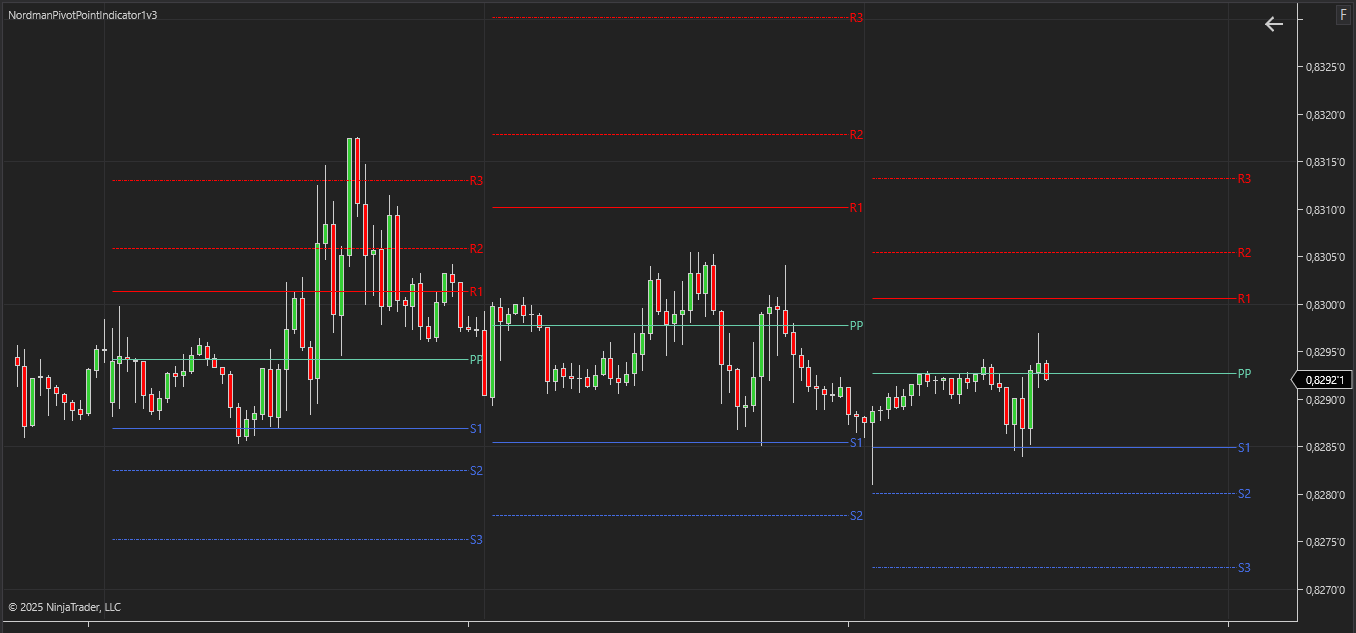
The formula used to calculate Fibonacci Pivot Points is:
(4) Camarilla. Uses a fixed multiplier (1.1) applied to the price range to calculate four support and resistance levels positioned symmetrically around the closing price of the calculation period.
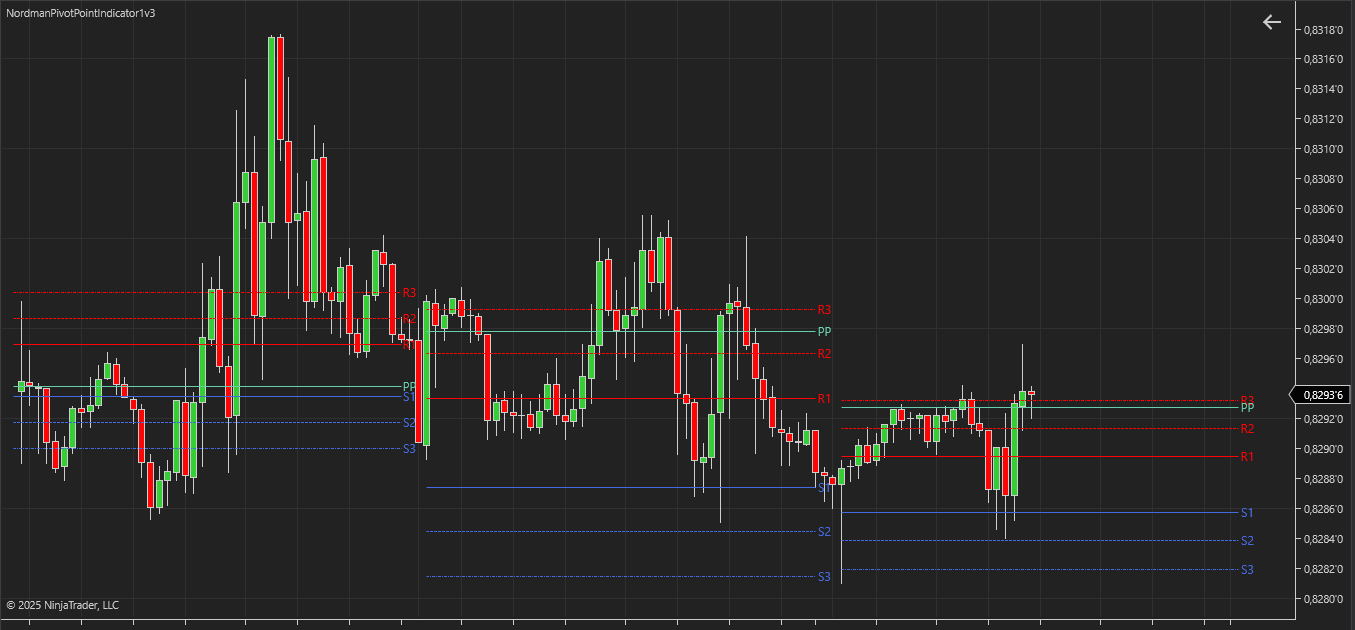
The formula used to calculate Camarilla Pivot Points is:
(5) Central Pivot Range (CPR). Calculates a standard Pivot Point and an additional level derived from the high and low of the period. Three support and resistance levels are produced.
The formula Central Pivot Range (CPR) calculation:
(6) DeMark. Calculates one primary reference level and one support and one resistance level. The input value X is weighted differently depending on the relationship between the closing and opening prices.
The formula used in calculating DeMark’s Pivot Points:
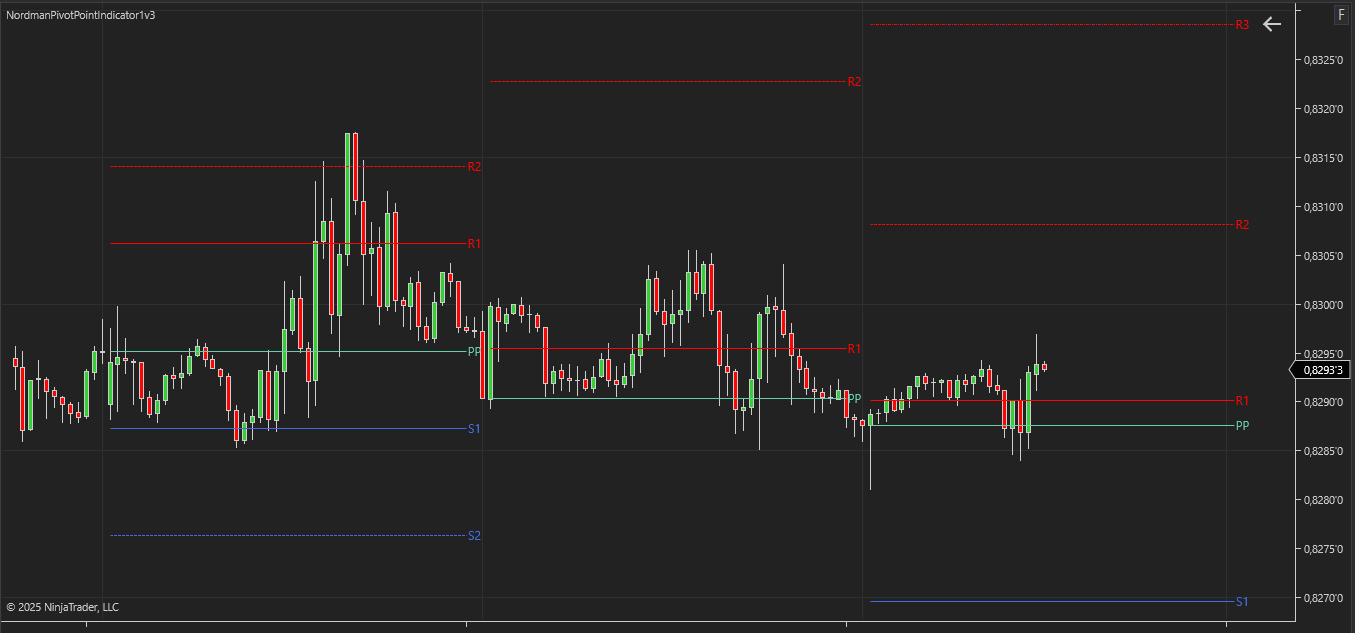
The calculation period is configurable across four options: Daily, Weekly, Monthly, or Custom. The custom option allows any arbitrary session interval to be defined. Individual support and resistance levels can be enabled or disabled independently for visual clarity. Multiple periods can be displayed simultaneously using the Display Session Number parameter.
Analytical Context
The six methods produce structurally different level distributions because they weight different price inputs differently. Classical and Fibonacci methods weight high, low, and close equally in the PP calculation. Woodie weights the open more heavily, pulling the PP toward the current session. Camarilla positions all levels relative to the close rather than the PP, producing a tighter cluster of levels near the prior close. DeMark adjusts the input formula based on the close-to-open relationship — producing different level positions depending on whether the session closed higher, lower, or equal to the open.
The choice of method affects not just the visual output but the structural context of the levels: a level produced by Camarilla at a given price is analytically different from a Classical level at the same price, because the underlying calculation logic and the price input weighting are different.
The indicator has the following parameters:
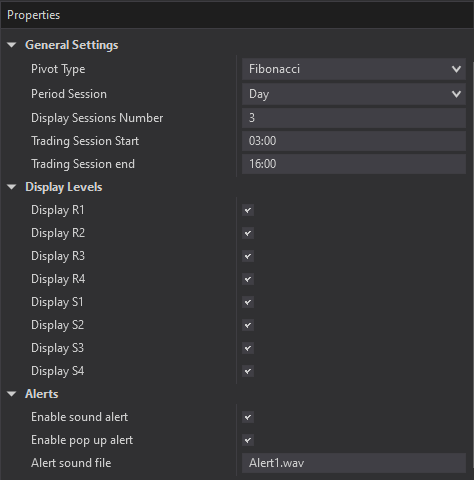
Pivot Type — selects the calculation method: Classical, Woodie, Fibonacci, Camarilla, CPR, or DeMark.
Period Session — selects the data period: Day, Week, Month, or Custom.
Display Session Number — the number of periods to display simultaneously on the chart.
Display R1–R4 / S1–S4 — enables or disables individual support and resistance levels independently.
Alerts — configure alert delivery for level interactions: sound notifications, email, and pop-up messages — each configurable independently.

We can customize this indicator to your needs — adding functions, modifying logic, or integrating it with other tools for your workflow.
We also convert indicators into Automated Trading Strategies with advanced functions (trailing stops, risk management, filters) tailored to your trading style strictly according to your specifications.
Request a free consultation to discuss the technical scope and timeline of your project.
We are committed to the ongoing development and refinement of our indicators. If you’ve spotted a bug, feel that something essential is missing, or have ideas that could make the indicator even better, just send us a message. Your feedback helps us improve and deliver tools that truly meet traders’ needs.
Nordman Algorithms is a trade name of Nordman Algorithms OÜ (Reg. No. 14435535), registered in Tallinn, Estonia.
Software Nature & User Responsibility — Nordman Algorithms provides algorithmic software tools for technical analysis. Nordman Algorithms is not a financial advisor and is not liable for any losses. All trades conducted based on the software’s output are executed at the user’s sole discretion and risk.
Visual Markers & Signal Disclosure — This software may display visual markers (such as arrows, dots, or alerts) when predefined mathematical conditions are met. These markers are provided for educational and analytical purposes only, must not be interpreted as financial guidance, and do not constitute a recommendation to buy, sell, or hold any financial instrument. Users must independently validate all visual cues within their own trading methodology.
No Financial Advice — Nordman Algorithms does not provide discretionary trading signals, investment advice, or managed signal services. Our software represents a mathematical visualization of historical and real-time data. The appearance of a visual marker does not guarantee a profitable trade or predict future market behavior.
Trading Risk Warning — Futures, Forex, and options trading involve significant risk. Risk capital is money that can be lost without jeopardizing financial security. Only risk capital should be used for trading. Past performance is not indicative of future results. View Full Risk Disclosure: https://www.nordman-algorithms.com/risk-disclosure/
ESMA Risk Warning — Financial instruments, especially those involving leverage such as CFDs and Forex, are complex and carry a high risk of rapid financial loss. Our software provides analytical outputs and visual markers based on predefined mathematical conditions and does not mitigate or reduce inherent market risks. You should carefully consider whether you understand how leveraged financial instruments work and whether you can afford the high risk of losing your capital.
CFTC Rule 4.41 — Hypothetical or simulated performance results have inherent limitations. Unlike actual performance records, simulated results do not represent real trading. Because trades have not actually been executed, these results may under- or over-compensate for the impact of market factors such as liquidity. No representation is being made that any account will achieve profits or losses similar to those shown.
Trademark Notice — NinjaTrader® is a registered trademark of NinjaTrader Group, LLC. No NinjaTrader company has any affiliation with the owner, developer, or provider of the products or services described herein, or any interest, ownership or otherwise, in any such product or service, or endorses, recommends or approves any such product or service.