The MACD + RSI Indicator combines two momentum-based analytical components into a single two-stage condition registration system. Each component measures momentum through a different methodology — and the indicator requires both to align before a condition is registered.
MACD (Moving Average Convergence Divergence) measures momentum through the relationship between two exponential moving averages of price. The histogram reflects the difference between the MACD line and its signal line — its direction and position relative to zero indicate whether momentum is building or decelerating in a given direction.
RSI (Relative Strength Index) measures momentum through the ratio of average gains to average losses over a defined period, normalized to a 0–100 scale. Readings above 70 reflect an overbought condition — price has risen sharply relative to recent history. Readings below 30 reflect an oversold condition.
The structural reason for combining these two indicators lies in what each one misses in isolation. MACD crossovers occur frequently — including during sustained trends where the signal and main lines repeatedly cross without any meaningful momentum shift. Many of these crossovers happen in the middle of a directional move and carry limited analytical weight. RSI alone identifies extreme momentum states but does not indicate when that extreme has begun to resolve — a reading above 70 can persist for an extended period before any directional change occurs. The two-stage requirement addresses both limitations simultaneously: RSI filters out MACD crossovers that occur during non-extreme momentum states, while MACD provides a directional timing reference that RSI alone cannot supply. The result is a condition that requires both extreme momentum as measured by RSI and a directional shift in MACD — registered only when both are present at the same time.
The two indicators measure the same underlying phenomenon — momentum — but through structurally different calculations. MACD is a trend-following tool that reacts to the direction and speed of price change. RSI is a bounded oscillator that reflects extreme momentum states through price ratio analysis. Requiring both to align produces a condition that is more structurally selective than either indicator alone.
The indicator uses a two-stage registration sequence for both bullish and bearish conditions.
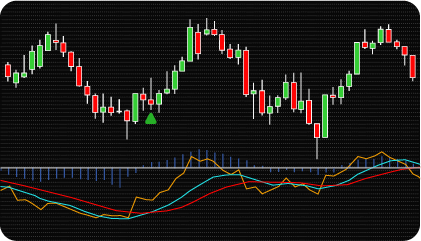
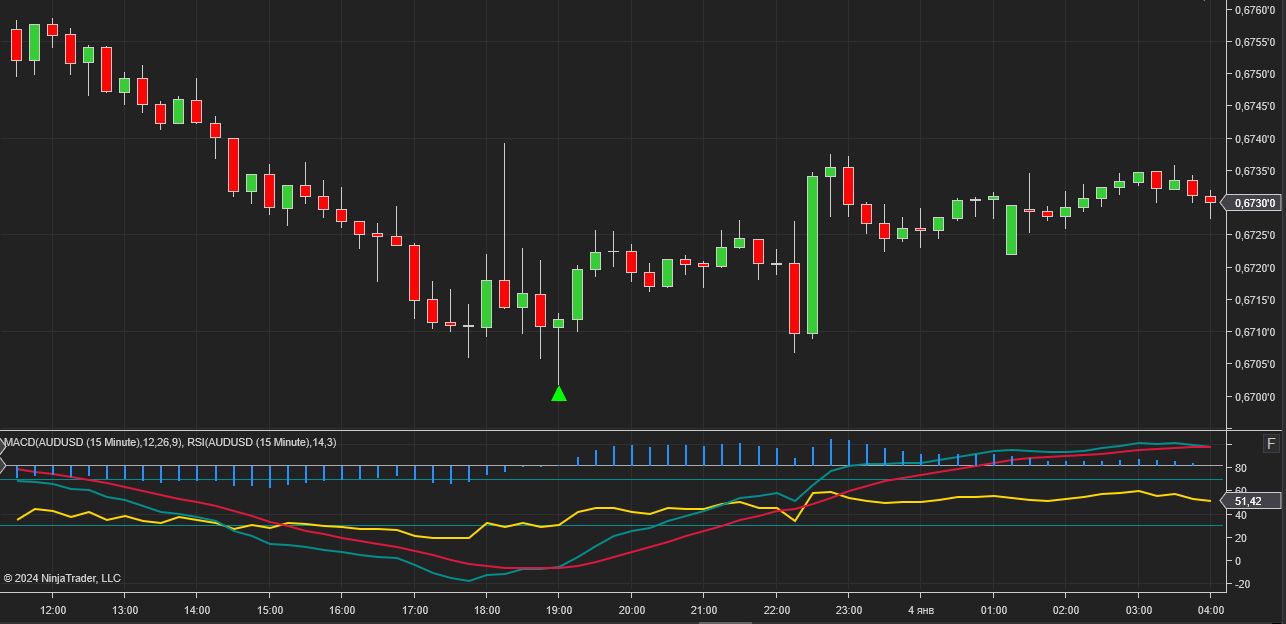
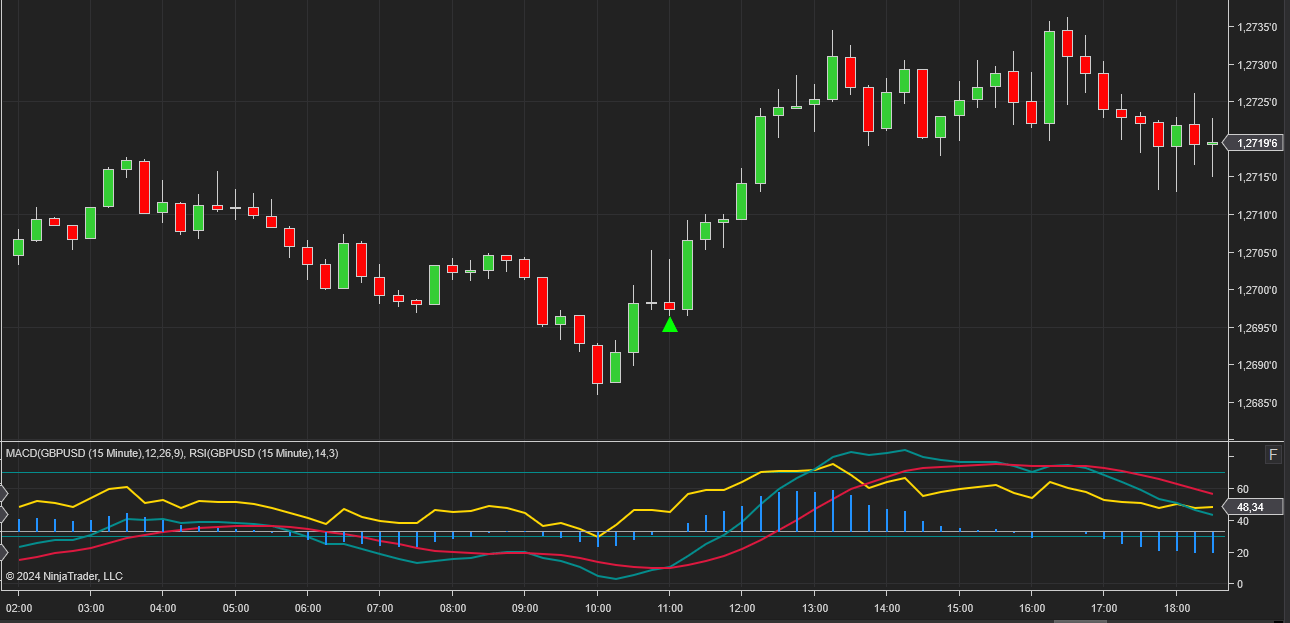
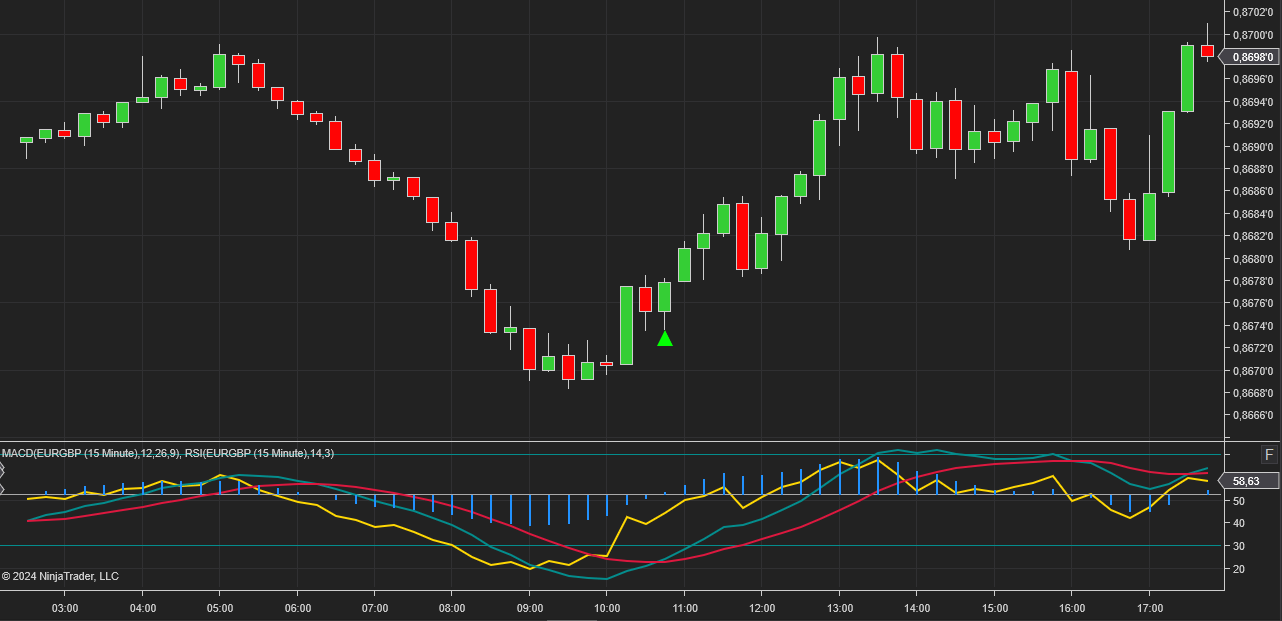
Bullish condition — registered when RSI is in the oversold zone (below 30) and the MACD main line, while below zero, crosses the signal line from below. Both criteria must be met simultaneously for the condition to register.
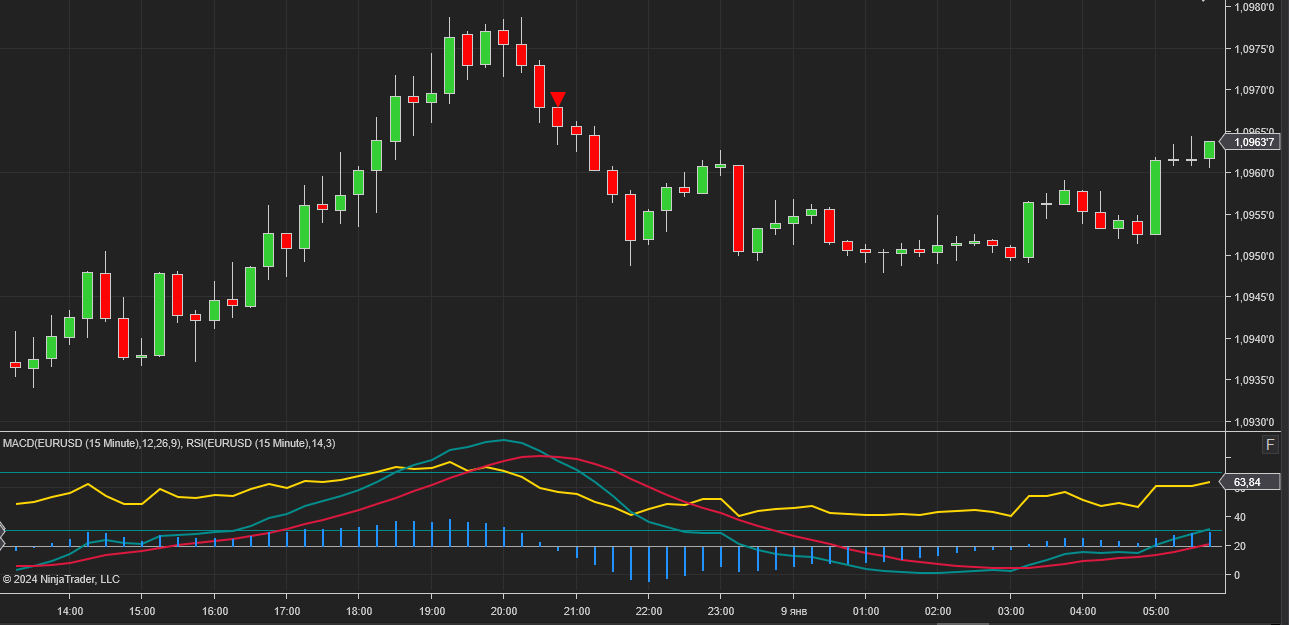
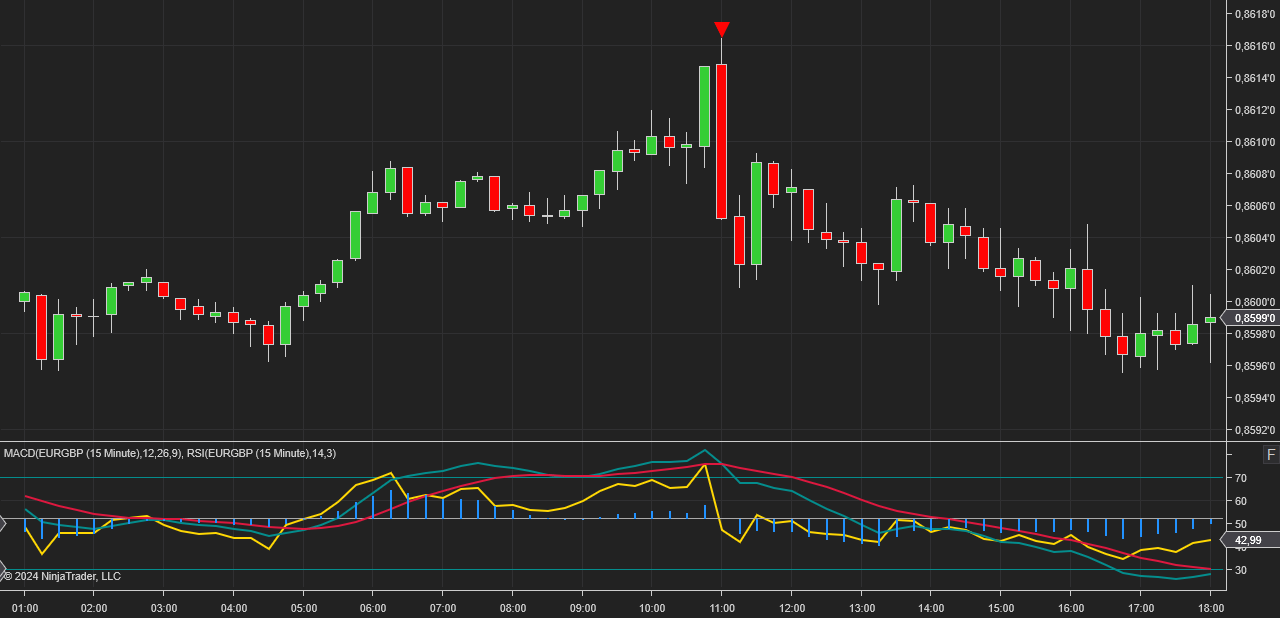
Bearish condition — registered when RSI is in the overbought zone (above 70) and the MACD main line, while above zero, crosses the signal line from above. Both criteria must be met simultaneously.
Repeat condition logic — the indicator applies a reset sequence before a repeat condition can be registered. This prevents multiple conditions from being registered during a single sustained MACD crossover event.
For a repeat bearish condition: after the initial bearish condition is registered, the MACD main line must drop below zero, rise above the signal line, and then cross back below the signal line again. The RSI condition must also still be met — or RSI must reset to 50, return to the overbought zone, and a new MACD crossover must occur.
For a repeat bullish condition: after the initial bullish condition is registered, the MACD main line must rise above zero, fall below the signal line, and then cross back above it again. The RSI condition must still be met — or RSI must reset to 50, return to the oversold zone, and a new MACD crossover must occur.
This reset sequence ensures that each registered condition reflects a full cycle of alignment between both components — not a continuation of an already-active MACD crossover.
The indicator has the following parameters:
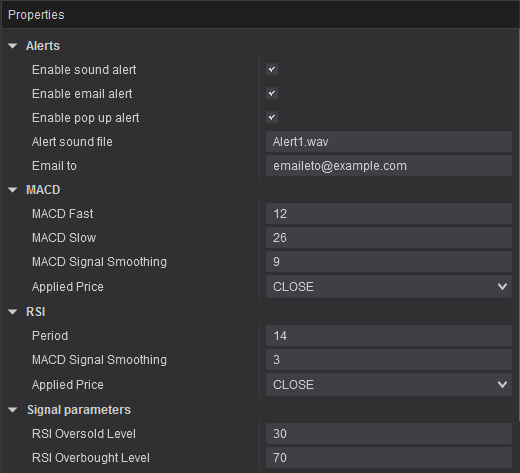
Alerts — configure alert delivery: sound notifications with selectable audio file, email, and pop-up messages — each configurable independently.
MACD — individual parameter configuration for the MACD calculation: fast period, slow period, and signal smoothing.
RSI — individual parameter configuration for the RSI calculation: period and price type.
Signal parameters — configures the overbought and oversold threshold levels used for RSI zone detection.

We can customize this indicator to your needs — adding functions, modifying logic, or integrating it with other tools for your workflow.
We also convert indicators into Automated Trading Strategies with advanced functions (trailing stops, risk management, filters) tailored to your trading style strictly according to your specifications.
Request a free consultation to discuss the technical scope and timeline of your project.
We are committed to the ongoing development and refinement of our indicators. If you’ve spotted a bug, feel that something essential is missing, or have ideas that could make the indicator even better, just send us a message. Your feedback helps us improve and deliver tools that truly meet traders’ needs.
Nordman Algorithms is a trade name of Nordman Algorithms OÜ (Reg. No. 14435535), registered in Tallinn, Estonia.
Software Nature & User Responsibility — Nordman Algorithms provides algorithmic software tools for technical analysis. Nordman Algorithms is not a financial advisor and is not liable for any losses. All trades conducted based on the software’s output are executed at the user’s sole discretion and risk.
Visual Markers & Signal Disclosure — This software may display visual markers (such as arrows, dots, or alerts) when predefined mathematical conditions are met. These markers are provided for educational and analytical purposes only, must not be interpreted as financial guidance, and do not constitute a recommendation to buy, sell, or hold any financial instrument. Users must independently validate all visual cues within their own trading methodology.
No Financial Advice — Nordman Algorithms does not provide discretionary trading signals, investment advice, or managed signal services. Our software represents a mathematical visualization of historical and real-time data. The appearance of a visual marker does not guarantee a profitable trade or predict future market behavior.
Trading Risk Warning — Futures, Forex, and options trading involve significant risk. Risk capital is money that can be lost without jeopardizing financial security. Only risk capital should be used for trading. Past performance is not indicative of future results. View Full Risk Disclosure: https://www.nordman-algorithms.com/risk-disclosure/
ESMA Risk Warning — Financial instruments, especially those involving leverage such as CFDs and Forex, are complex and carry a high risk of rapid financial loss. Our software provides analytical outputs and visual markers based on predefined mathematical conditions and does not mitigate or reduce inherent market risks. You should carefully consider whether you understand how leveraged financial instruments work and whether you can afford the high risk of losing your capital.
CFTC Rule 4.41 — Hypothetical or simulated performance results have inherent limitations. Unlike actual performance records, simulated results do not represent real trading. Because trades have not actually been executed, these results may under- or over-compensate for the impact of market factors such as liquidity. No representation is being made that any account will achieve profits or losses similar to those shown.
Trademark Notice — NinjaTrader® is a registered trademark of NinjaTrader Group, LLC. No NinjaTrader company has any affiliation with the owner, developer, or provider of the products or services described herein, or any interest, ownership or otherwise, in any such product or service, or endorses, recommends or approves any such product or service.