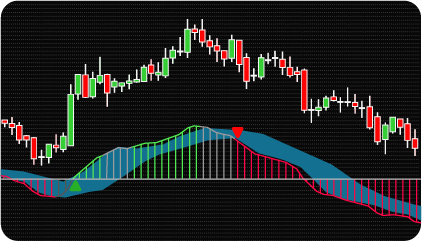


The MACD + Bollinger Bands Indicator applies Bollinger Bands directly to the MACD histogram rather than to price. The MACD histogram reflects the speed and direction of price momentum — Bollinger Bands applied to it define a statistical range within which the histogram typically moves. When the histogram extends beyond the band boundaries, it has reached a statistically extended momentum reading relative to recent behavior.
The choice to apply Bollinger Bands to the MACD histogram rather than to price reflects a specific analytical intent. Standard Bollinger Bands on price measure how far price has deviated from its moving average — but this conflates two different questions: where price is, and how fast it is moving. MACD isolates the momentum component — the rate of change of price relative to its own history. Applying Bollinger Bands to this output means the band boundaries define what constitutes a statistically normal range of momentum variation, not a normal range of price. When the histogram crosses a band boundary, it indicates that momentum itself has become extended relative to recent behavior — a structurally different reading than price simply being above or below a moving average.
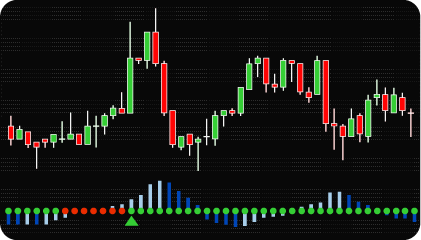
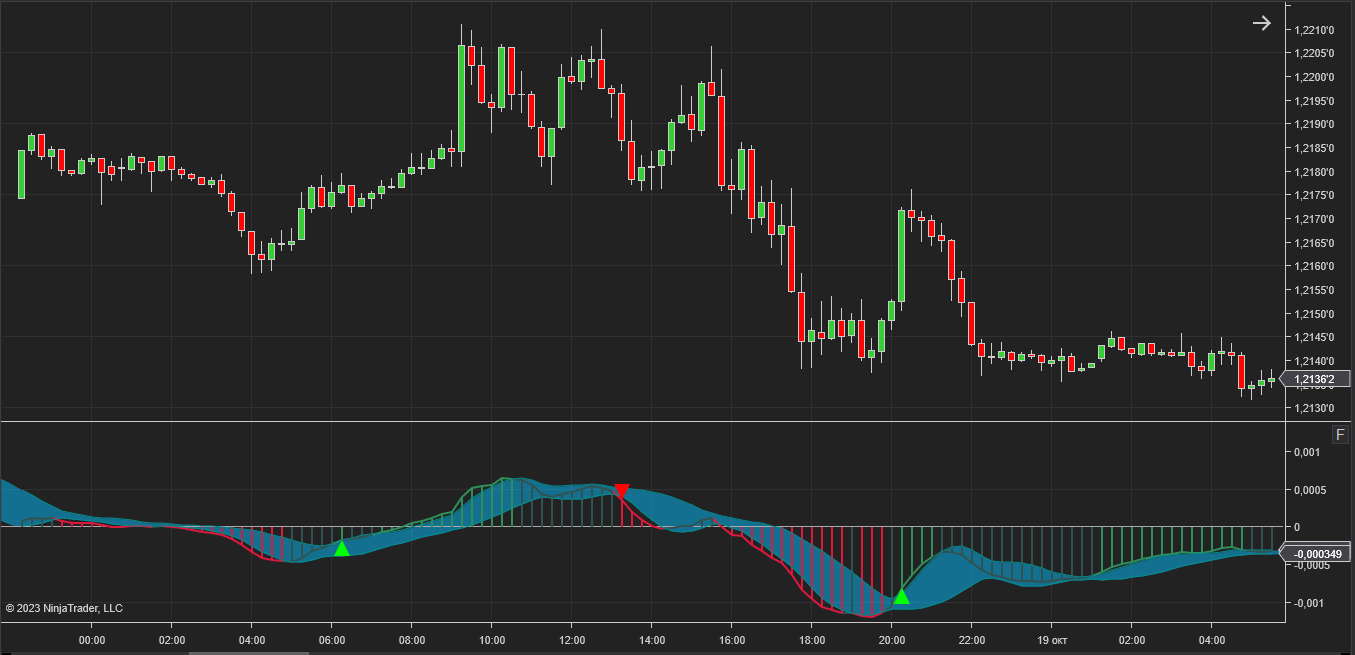
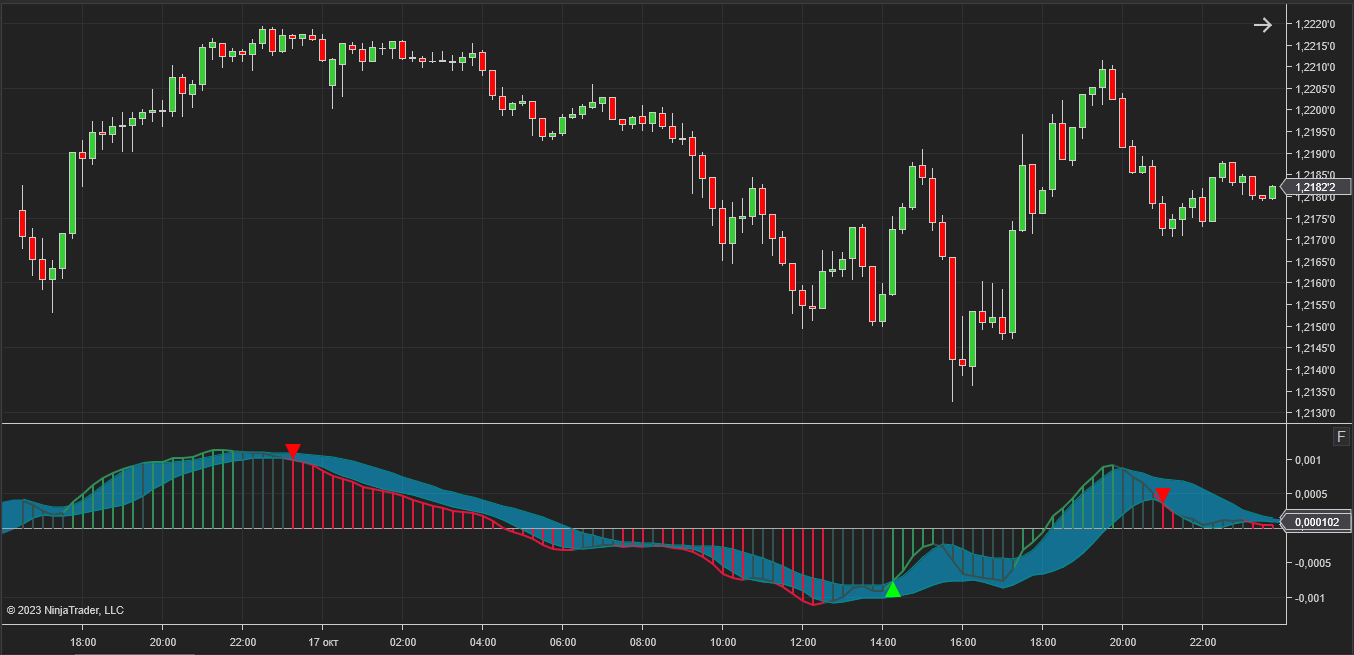
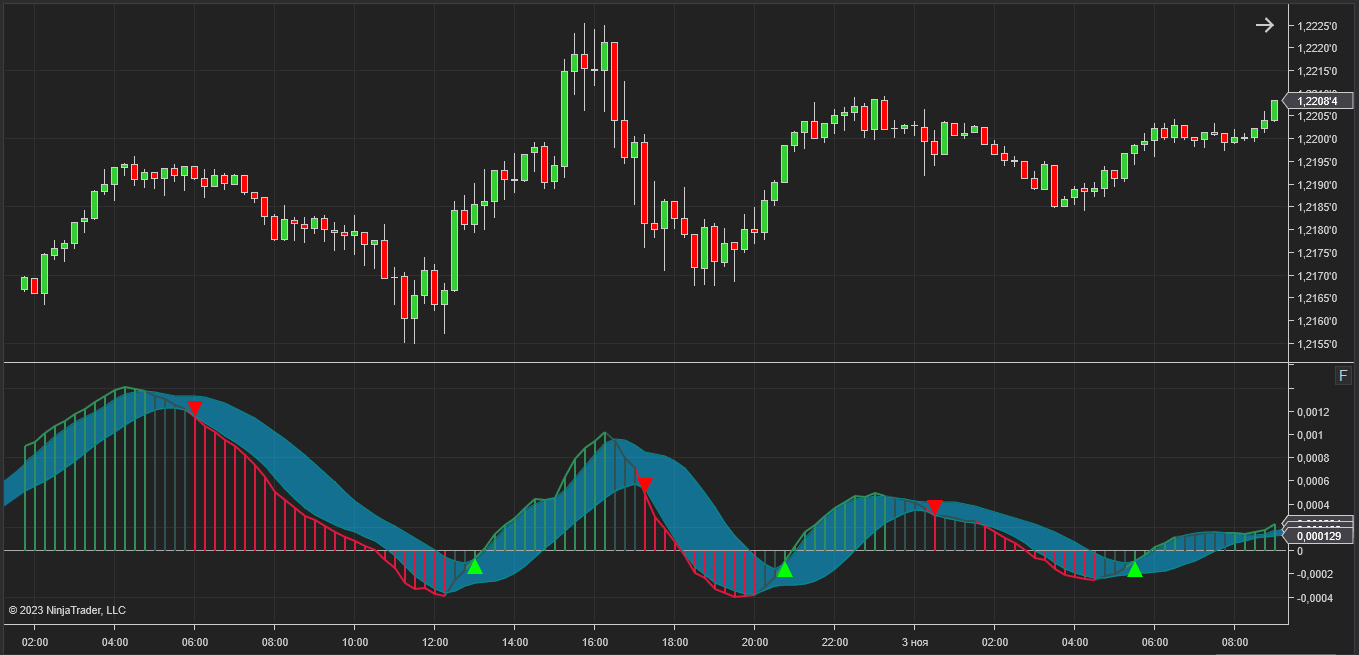
This two-layer calculation produces three distinct zones — bullish, bearish, and neutral — based on the position of the MACD histogram relative to the Bollinger Band boundaries. The color of the histogram changes to reflect which zone is currently active.
The indicator offers extensive parameter configuration:
The indicator registers three zone conditions based on the position of the MACD histogram relative to the Bollinger Band boundaries:
Bullish zone — a bullish condition is registered when the MACD histogram moves above the upper Bollinger Band boundary. The histogram is displayed in green. This reflects a statistically extended upward momentum reading — the histogram has moved beyond the typical range of recent variation.
Bearish zone — a bearish condition is registered when the MACD histogram moves below the lower Bollinger Band boundary. The histogram is displayed in red. This reflects a statistically extended downward momentum reading.
Neutral zone — when the MACD histogram is within the Bollinger Band boundaries, no directional condition is registered. The histogram is displayed in gray. This reflects a period where MACD momentum is within its typical statistical range.
The transition from neutral to bullish or bearish zone is the primary analytical event — it indicates that the MACD histogram has moved beyond the band boundary that separates normal variation from statistically extended momentum.
The indicator has the following parameters:
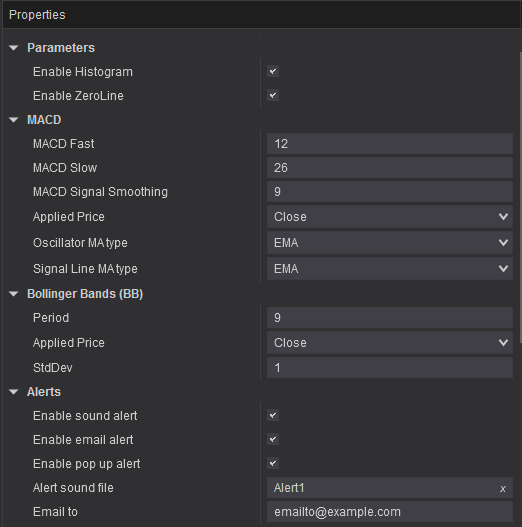
Alerts — configure alert delivery: sound notifications with selectable audio file, email, and pop-up messages — each configurable independently.
MACD and Bollinger Bands (BB) settings — individual parameter configuration for the MACD calculation and the Bollinger Bands applied to its output.

We can customize this indicator to your needs — adding functions, modifying logic, or integrating it with other tools for your workflow.
We also convert indicators into Automated Trading Strategies with advanced functions (trailing stops, risk management, filters) tailored to your trading style strictly according to your specifications.
Request a free consultation to discuss the technical scope and timeline of your project.
We are committed to the ongoing development and refinement of our indicators. If you’ve spotted a bug, feel that something essential is missing, or have ideas that could make the indicator even better, just send us a message. Your feedback helps us improve and deliver tools that truly meet traders’ needs.
Nordman Algorithms is a trade name of Nordman Algorithms OÜ (Reg. No. 14435535), registered in Tallinn, Estonia.
Software Nature & User Responsibility — Nordman Algorithms provides algorithmic software tools for technical analysis. Nordman Algorithms is not a financial advisor and is not liable for any losses. All trades conducted based on the software’s output are executed at the user’s sole discretion and risk.
Visual Markers & Signal Disclosure — This software may display visual markers (such as arrows, dots, or alerts) when predefined mathematical conditions are met. These markers are provided for educational and analytical purposes only, must not be interpreted as financial guidance, and do not constitute a recommendation to buy, sell, or hold any financial instrument. Users must independently validate all visual cues within their own trading methodology.
No Financial Advice — Nordman Algorithms does not provide discretionary trading signals, investment advice, or managed signal services. Our software represents a mathematical visualization of historical and real-time data. The appearance of a visual marker does not guarantee a profitable trade or predict future market behavior.
Trading Risk Warning — Futures, Forex, and options trading involve significant risk. Risk capital is money that can be lost without jeopardizing financial security. Only risk capital should be used for trading. Past performance is not indicative of future results. View Full Risk Disclosure: https://www.nordman-algorithms.com/risk-disclosure/
ESMA Risk Warning — Financial instruments, especially those involving leverage such as CFDs and Forex, are complex and carry a high risk of rapid financial loss. Our software provides analytical outputs and visual markers based on predefined mathematical conditions and does not mitigate or reduce inherent market risks. You should carefully consider whether you understand how leveraged financial instruments work and whether you can afford the high risk of losing your capital.
CFTC Rule 4.41 — Hypothetical or simulated performance results have inherent limitations. Unlike actual performance records, simulated results do not represent real trading. Because trades have not actually been executed, these results may under- or over-compensate for the impact of market factors such as liquidity. No representation is being made that any account will achieve profits or losses similar to those shown.
Trademark Notice — NinjaTrader® is a registered trademark of NinjaTrader Group, LLC. No NinjaTrader company has any affiliation with the owner, developer, or provider of the products or services described herein, or any interest, ownership or otherwise, in any such product or service, or endorses, recommends or approves any such product or service.