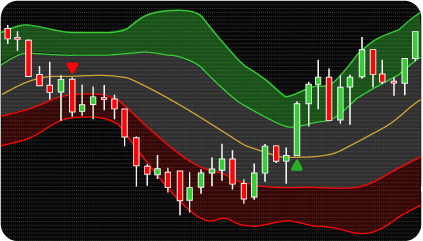
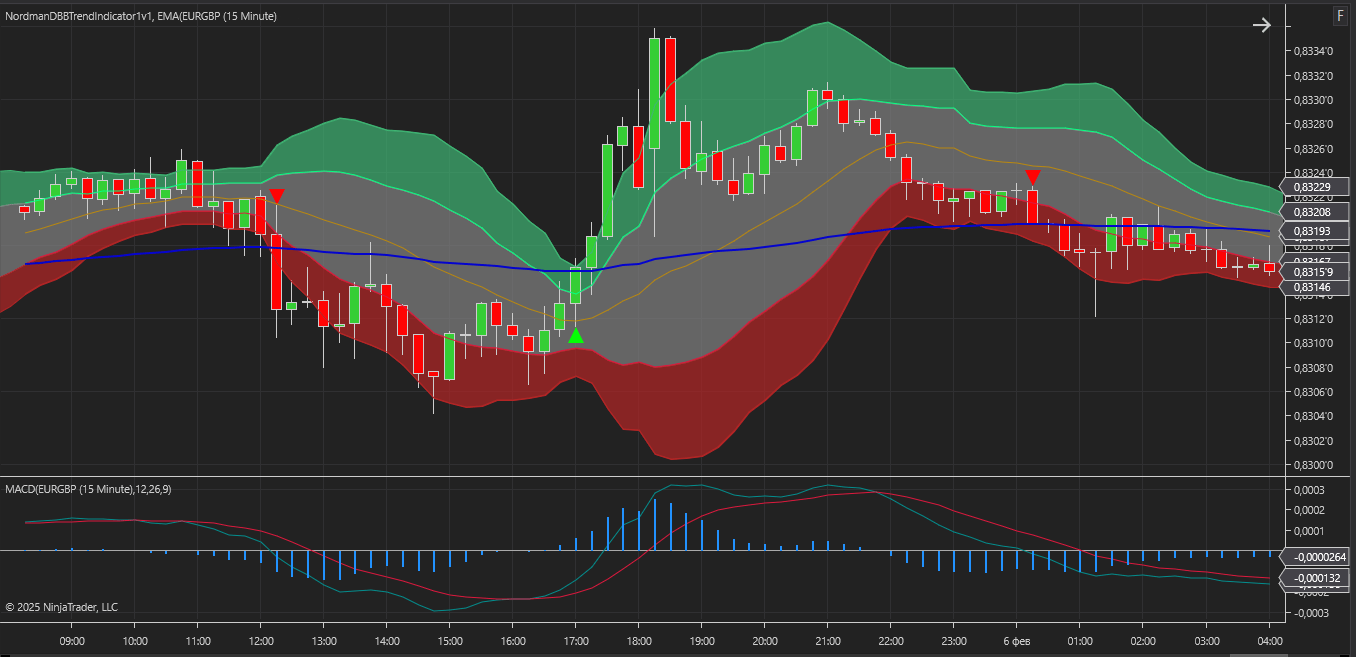
The Double Bollinger Bands (DBB) Indicator uses two sets of Bollinger Bands with different standard deviations to classify price position into three structural zones. The inner bands (BB1) use a standard deviation of one — the outer bands (BB2) use a standard deviation of two. Both sets share the same 20-period moving average as their central line.
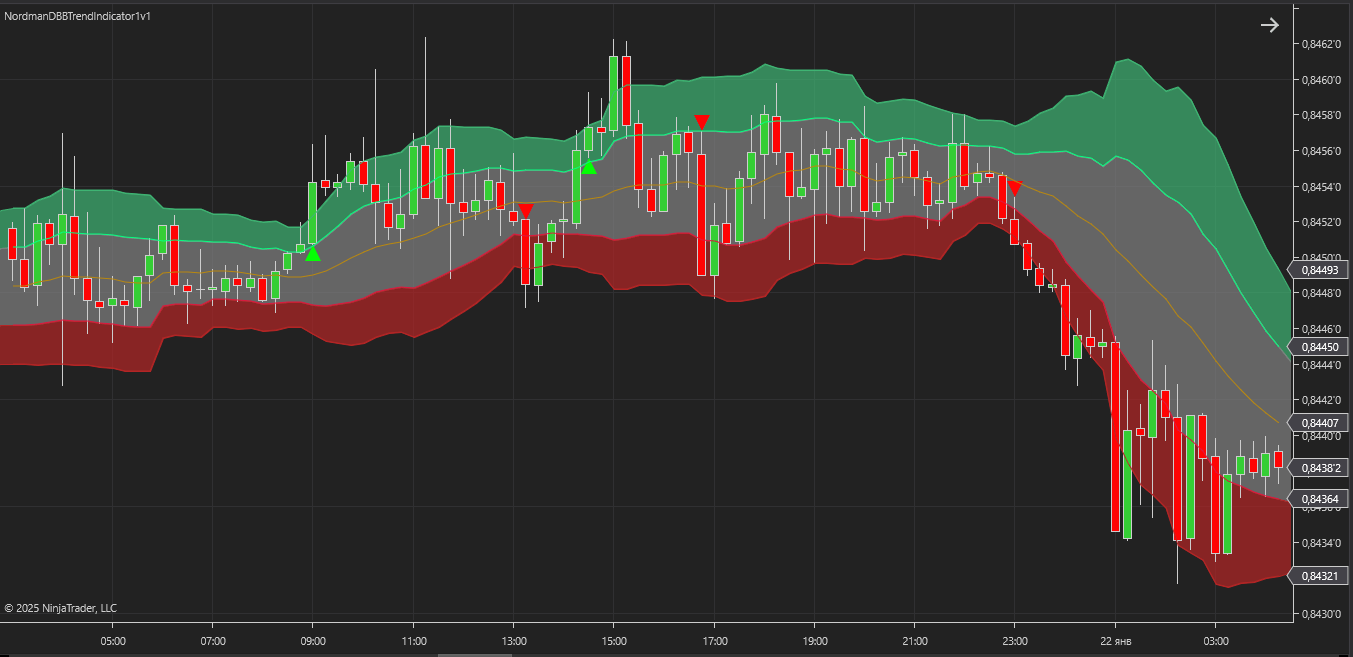
The two-band structure creates three analytically distinct zones based on where price is positioned relative to the four band boundaries:
Bullish zone — price is between the upper BB1 and upper BB2 boundaries. Price has moved beyond the 1 SD boundary but remains within the 2 SD boundary, reflecting a statistically extended but not extreme upward position.
Neutral zone — price is within the BB1 boundaries on both sides. Price is within one standard deviation of the moving average, reflecting a non-extended position relative to recent price behavior.
Bearish zone — price is between the lower BB1 and lower BB2 boundaries, reflecting a statistically extended downward position symmetrical to the bullish zone.
The analytical logic of the double-band structure is that the 1 SD boundary separates normal price variation from directionally extended price, while the 2 SD boundary defines the outer limit of statistically typical price range. Price consistently tracking within the bullish or bearish zone reflects sustained directional extension — price returning to the neutral zone reflects a reduction in that extension.
The double-band structure matters because it makes the space between 1 SD and 2 SD analytically explicit. A single Bollinger Band at 2 SD only tells you whether price is inside or outside — it treats everything inside as equivalent, regardless of whether price is near the average or near the boundary. Adding the 1 SD band creates a defined intermediate zone: price has moved beyond normal variation but hasn’t reached a statistically extreme position. This is where the indicator registers conditions — not at the average, not at the outer extreme, but in the zone between them. The Minimum Threshold and Percentage Filling Area parameters add a further filter: price must occupy this zone by a defined minimum amount, not just briefly touch the BB1 boundary and retreat.
The DBB Indicator integrates the zone-based Bollinger Band structure with three optional confirmation filters — EMA, RSI, and MACD — each of which can be enabled or disabled independently.
Bollinger Bands Structure
BB1 — 20-period moving average with 1 SD range. Boundaries define the neutral zone.
BB2 — 20-period moving average with 2 SD range. Boundaries define the outer limits of the bullish and bearish zones.
Additional Confirmation Filters
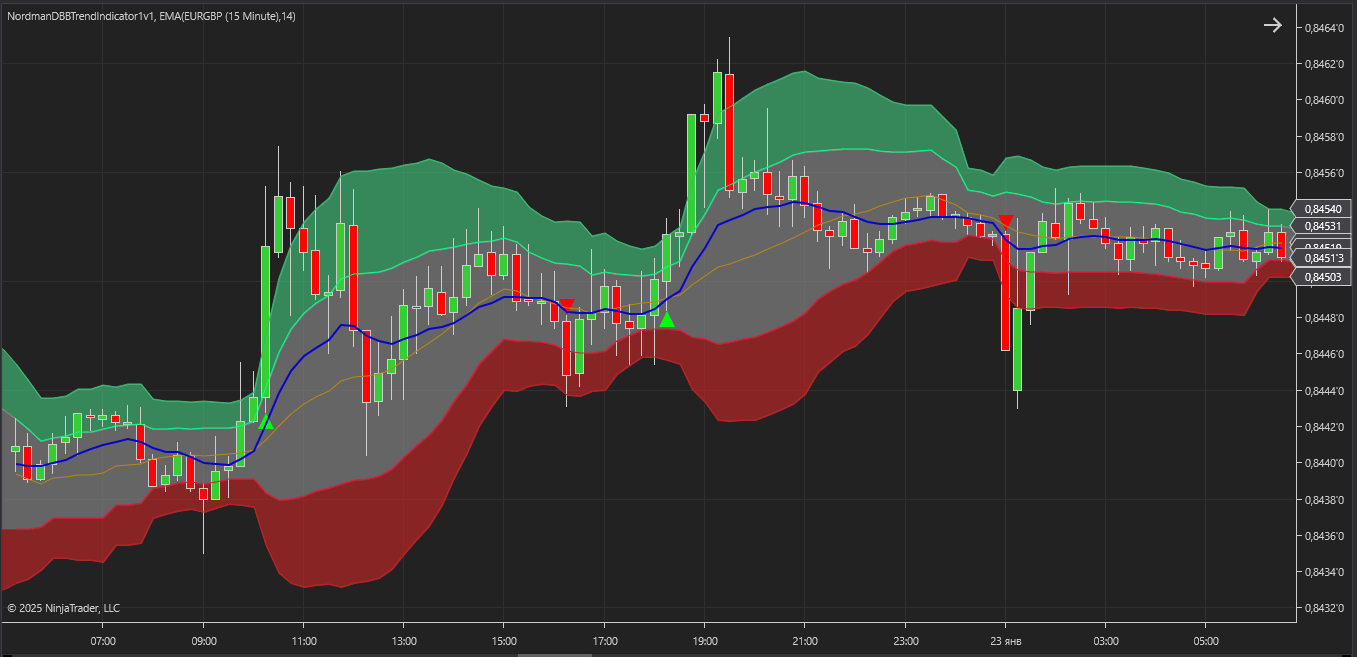
EMA — when enabled, a bullish condition requires price to be above the EMA, a bearish condition requires price to be below it. This ensures zone-based conditions are evaluated in the context of the medium-term directional bias as measured by the EMA.
RSI — when enabled, a bullish condition requires RSI to be above the configured threshold (default 50), a bearish condition requires RSI to be below it. This filters out zone-based conditions that occur when momentum as measured by RSI does not support the directional reading.
MACD — when enabled, two filter modes are available: Histogram mode requires the histogram to be positive for bullish and negative for bearish conditions. Zero Line Crossover mode requires the MACD signal line to be above zero and rising for bullish, or below zero and declining for bearish conditions.
Bullish condition is registered when all of the following criteria are met:
Price rises above the upper BB1 boundary and moves toward the upper BB2 boundary — crossing the 1 SD level and entering the bullish zone.
Price must exceed the configured Minimum Threshold (%) and meet the Percentage Filling Area BB1–BB2 parameter.
If the EMA filter is enabled — price must be above the EMA.
If the RSI filter is enabled — RSI must be above the configured target level. If the MACD filter is enabled — the MACD histogram must be positive, or the signal line must be above zero and rising depending on the selected MACD filter mode.
Bearish condition is registered when the inverse criteria are met — price falls below the lower BB1 boundary and moves toward the lower BB2 boundary, with the same threshold, filling, and optional filter requirements applied symmetrically.
The indicator has the following parameters:
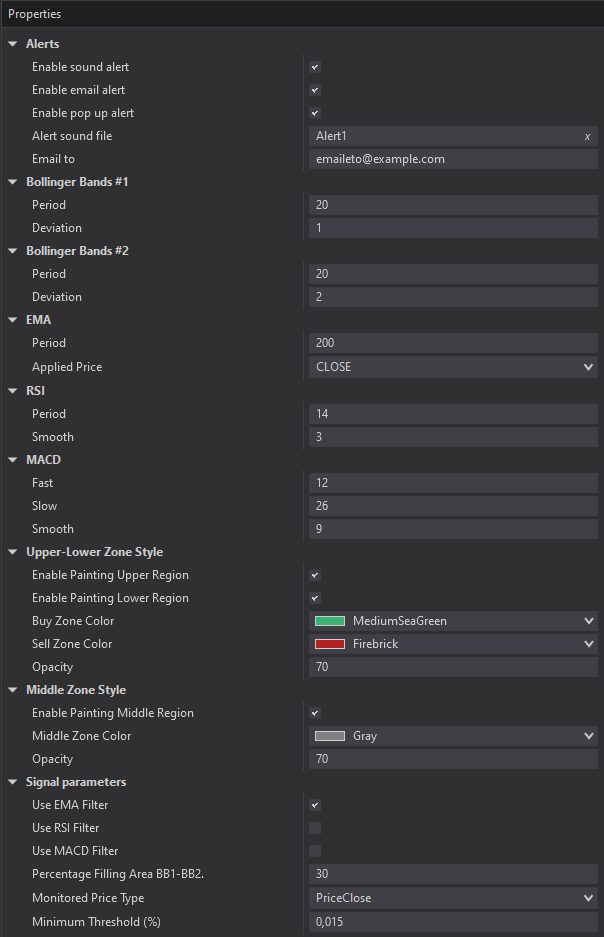
Alerts – Configure various types of alerts.
Bollinger Bands #1-2 – Set key parameters, including period and standard deviation coefficient.
EMA – Define the period and select the applied price type (OPEN, HIGH, LOW, CLOSE, HL2, HLC3, OHLC4).
RSI – Configure key parameters of the RSI indicator.
MACD – Configure key parameters of the MACD indicator.
Use EMA Filter – Enable/disable the EMA as a signal filter.
Use RSI Filter – Enable/disable the RSI as a signal filter.
Use MACD Filter – Enable/disable the MACD as a signal filter.
MACD Filter Modes: HistogramRelatedZeroLine – The MACD histogram is positive/negative.
MACD Filter Modes: ZeroLineCrossesMACD – The MACD signal line is above the zero line and rising or below the zero line and declining.
Minimum Threshold (%) – Defines the minimum price breakout level above or below the BB1 level.
Percentage Filling Area BB1-BB2 – Specifies the minimum percentage of the buy/sell zone that must be covered by price for a valid signal.
Monitored Price Type – Determines the price type (High/Low or Close) used for calculating the Minimum Threshold (%) and Percentage Filling Area BB1-BB2 parameters.

We can customize this indicator to your needs — adding functions, modifying logic, or integrating it with other tools for your workflow.
We also convert indicators into Automated Trading Strategies with advanced functions (trailing stops, risk management, filters) tailored to your trading style strictly according to your specifications.
Request a free consultation to discuss the technical scope and timeline of your project.
We are committed to the ongoing development and refinement of our indicators. If you’ve spotted a bug, feel that something essential is missing, or have ideas that could make the indicator even better, just send us a message. Your feedback helps us improve and deliver tools that truly meet traders’ needs.
Nordman Algorithms is a trade name of Nordman Algorithms OÜ (Reg. No. 14435535), registered in Tallinn, Estonia.
Software Nature & User Responsibility — Nordman Algorithms provides algorithmic software tools for technical analysis. Nordman Algorithms is not a financial advisor and is not liable for any losses. All trades conducted based on the software’s output are executed at the user’s sole discretion and risk.
Visual Markers & Signal Disclosure — This software may display visual markers (such as arrows, dots, or alerts) when predefined mathematical conditions are met. These markers are provided for educational and analytical purposes only, must not be interpreted as financial guidance, and do not constitute a recommendation to buy, sell, or hold any financial instrument. Users must independently validate all visual cues within their own trading methodology.
No Financial Advice — Nordman Algorithms does not provide discretionary trading signals, investment advice, or managed signal services. Our software represents a mathematical visualization of historical and real-time data. The appearance of a visual marker does not guarantee a profitable trade or predict future market behavior.
Trading Risk Warning — Futures, Forex, and options trading involve significant risk. Risk capital is money that can be lost without jeopardizing financial security. Only risk capital should be used for trading. Past performance is not indicative of future results. View Full Risk Disclosure: https://www.nordman-algorithms.com/risk-disclosure/
ESMA Risk Warning — Financial instruments, especially those involving leverage such as CFDs and Forex, are complex and carry a high risk of rapid financial loss. Our software provides analytical outputs and visual markers based on predefined mathematical conditions and does not mitigate or reduce inherent market risks. You should carefully consider whether you understand how leveraged financial instruments work and whether you can afford the high risk of losing your capital.
CFTC Rule 4.41 — Hypothetical or simulated performance results have inherent limitations. Unlike actual performance records, simulated results do not represent real trading. Because trades have not actually been executed, these results may under- or over-compensate for the impact of market factors such as liquidity. No representation is being made that any account will achieve profits or losses similar to those shown.
Trademark Notice — NinjaTrader® is a registered trademark of NinjaTrader Group, LLC. No NinjaTrader company has any affiliation with the owner, developer, or provider of the products or services described herein, or any interest, ownership or otherwise, in any such product or service, or endorses, recommends or approves any such product or service.