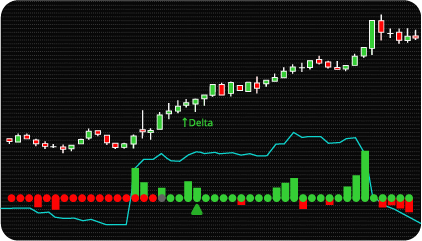
The Cumulative Volume Delta (CVD) Indicator measures the running net difference between ask-side volume (buying pressure) and bid-side volume (selling pressure) over a configurable calculation period. Unlike standard volume indicators which display total traded volume without directional context, CVD separates each trade into its ask-side or bid-side component and accumulates the difference — producing a running net value that reflects which side has been more active over the measured period.
Please note!
The indicator supports three delta calculation methods:
BidAsk — trades at or above the ask price are classified as buying volume; trades at or below the bid price are classified as selling volume.
UpDownTick — buying volume is attributed when the last trade occurs while the ask is higher than the previous ask; selling volume when the bid is lower than the previous bid; all volume in between is added to the prior direction. This mode is applicable to instruments or data providers where best bid/ask data is not available alongside last price tick data.
UpDownTick (Forex mod.) — a modified version of the UpDownTick method adapted for Forex instruments, which do not contain bid/ask data in the standard format. Note that because Forex markets do not carry a last price, CVD bars in this mode will move in a single direction.
The indicator extends basic CVD calculation with a market phase identification layer, which uses a combination of SuperTrend and two EMA indicators — configurable to be used together or independently.
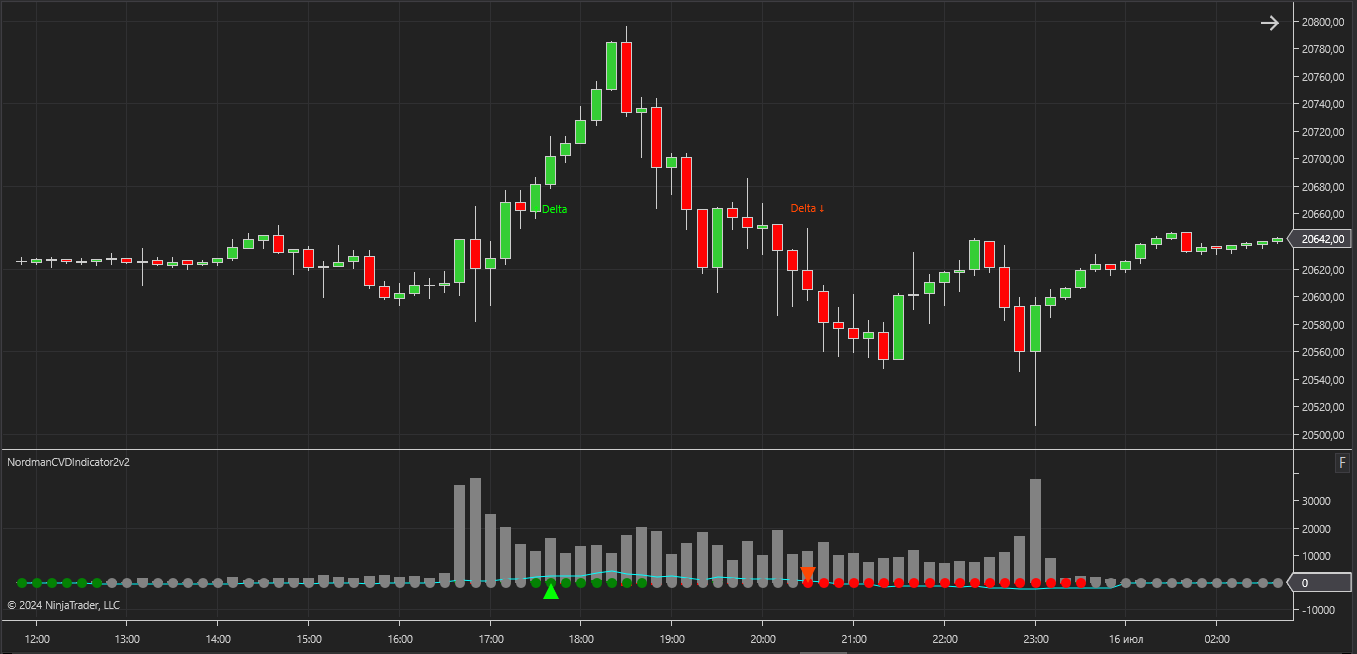
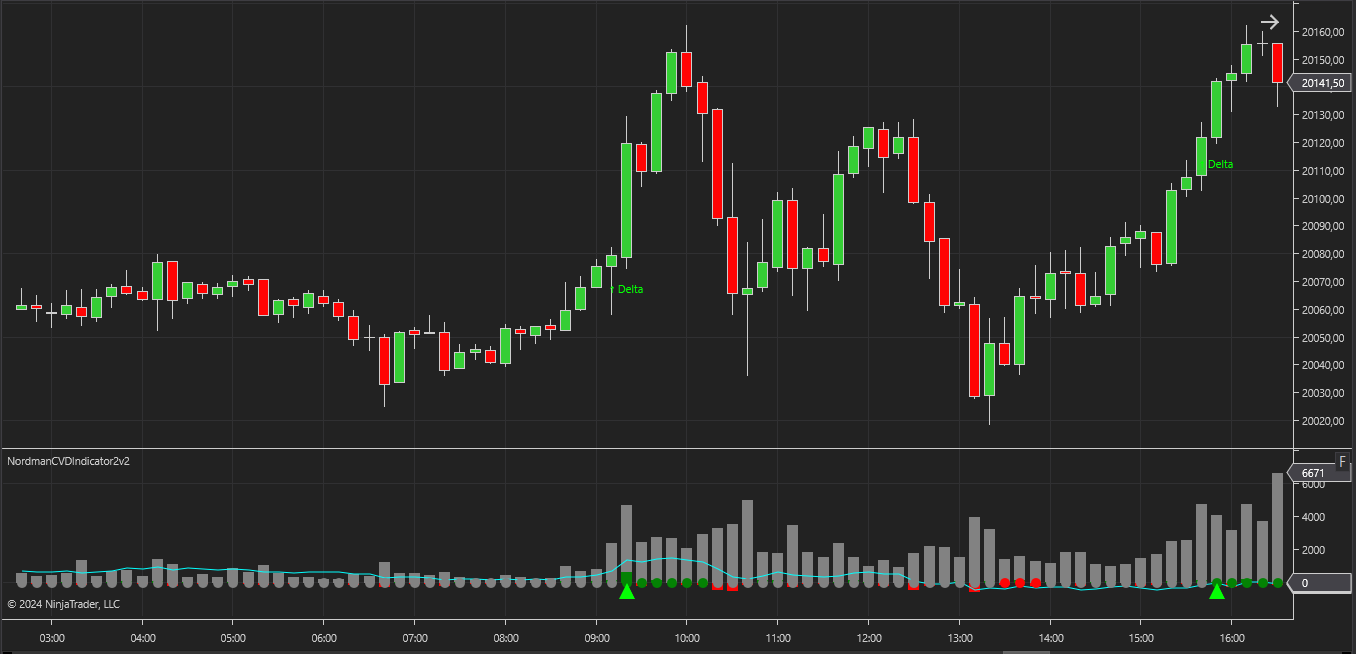
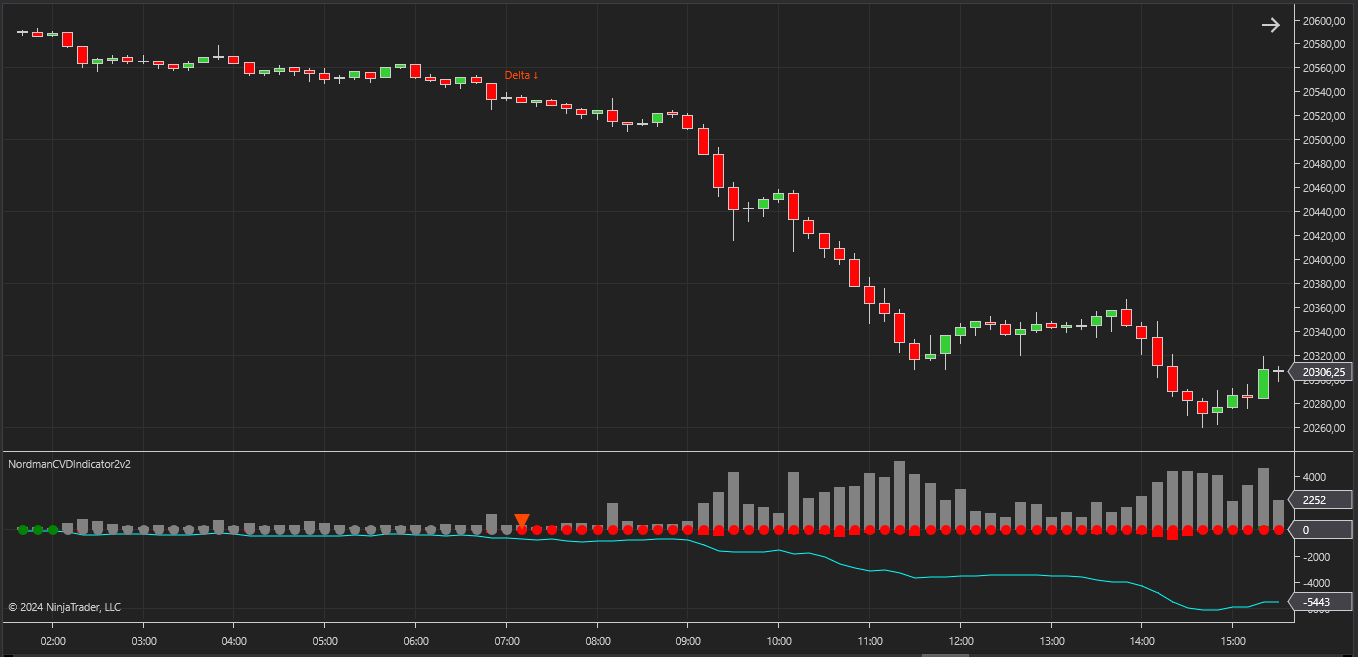
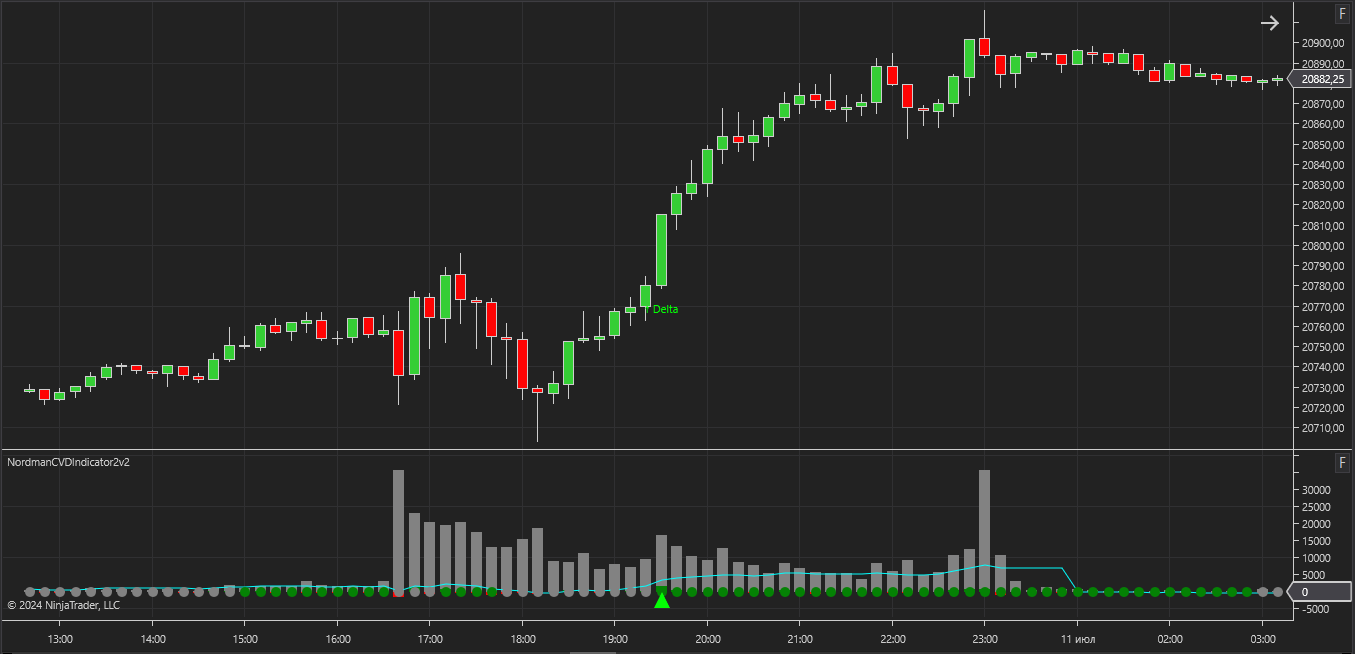
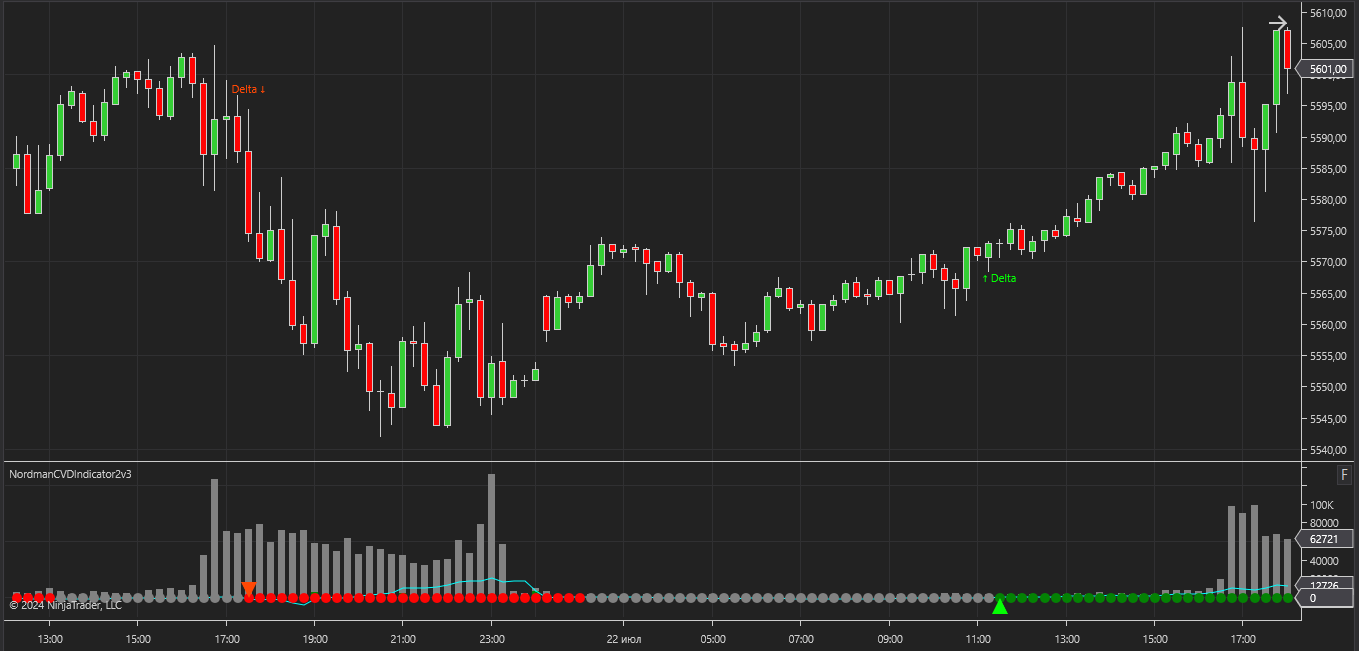
Market phase dots are displayed on the histogram:
CVD directional labels — “⭡Delta” is displayed when CVD has reached values that meet the configured conditions reflecting upward directional context. “⭣Delta” is displayed when CVD conditions reflect downward directional context. These labels do not function as buy or sell instructions — they indicate that the CVD has reached a defined threshold state relative to the configured filters.
Volume filters are available to restrict label generation to periods where total volume or delta volume meets a defined minimum — preventing labels from appearing during low-activity periods where the CVD reading may carry less analytical weight.
The CVD can be calculated by time period or by bar count. At the end of each configured period or after the specified number of bars, the accumulated CVD resets to zero and begins accumulating again.
CVD smoothing options are available: Pure (raw accumulated delta), SMA (simple moving average applied to CVD), or EMA (exponential moving average applied to CVD).
The indicator has the following parameters:
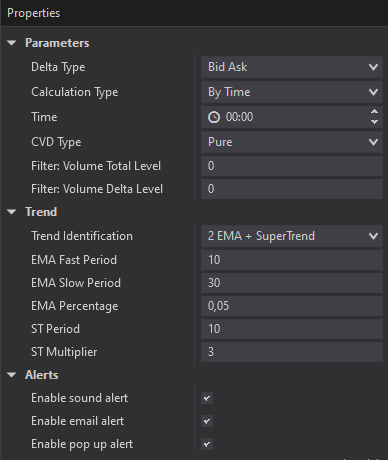
Delta Type — selects the delta calculation method: BidAsk, UpDownTick, or UpDownTick (Forex mod.).
Calculation Type — selects whether CVD accumulates over a defined time period or a defined bar count.
Time / Bars — the time duration or number of bars after which the accumulated CVD resets to zero.
CVD Type — selects the CVD output type: Pure, SMA, or EMA.
Filter: Volume Total Level — sets the minimum total volume required for a label to be generated. Set to 0 to disable this filter.
Filter: Volume Delta Level — sets the minimum volume delta required for a label to be generated. Set to 0 to disable this filter.
Trend Identification — selects the trend phase components: dual EMA only, SuperTrend only, or both combined.
EMA Fast / Slow Period — configures the periods for the fast and slow EMA used in phase identification.
EMA Percentage — sets the minimum percentage difference between fast and slow EMA readings required to register a directional trend phase.
ST Period / Multiplier — configures the core parameters of the SuperTrend component used in phase identification.
Alerts — configure alert delivery: sound notifications, email, and pop-up messages — each configurable independently.

We can customize this indicator to your needs — adding functions, modifying logic, or integrating it with other tools for your workflow.
We also convert indicators into Automated Trading Strategies with advanced functions (trailing stops, risk management, filters) tailored to your trading style strictly according to your specifications.
Request a free consultation to discuss the technical scope and timeline of your project.
We are committed to the ongoing development and refinement of our indicators. If you’ve spotted a bug, feel that something essential is missing, or have ideas that could make the indicator even better, just send us a message. Your feedback helps us improve and deliver tools that truly meet traders’ needs.
Nordman Algorithms is a trade name of Nordman Algorithms OÜ (Reg. No. 14435535), registered in Tallinn, Estonia.
Software Nature & User Responsibility — Nordman Algorithms provides algorithmic software tools for technical analysis. Nordman Algorithms is not a financial advisor and is not liable for any losses. All trades conducted based on the software’s output are executed at the user’s sole discretion and risk.
Visual Markers & Signal Disclosure — This software may display visual markers (such as arrows, dots, or alerts) when predefined mathematical conditions are met. These markers are provided for educational and analytical purposes only, must not be interpreted as financial guidance, and do not constitute a recommendation to buy, sell, or hold any financial instrument. Users must independently validate all visual cues within their own trading methodology.
No Financial Advice — Nordman Algorithms does not provide discretionary trading signals, investment advice, or managed signal services. Our software represents a mathematical visualization of historical and real-time data. The appearance of a visual marker does not guarantee a profitable trade or predict future market behavior.
Trading Risk Warning — Futures, Forex, and options trading involve significant risk. Risk capital is money that can be lost without jeopardizing financial security. Only risk capital should be used for trading. Past performance is not indicative of future results. View Full Risk Disclosure: https://www.nordman-algorithms.com/risk-disclosure/
ESMA Risk Warning — Financial instruments, especially those involving leverage such as CFDs and Forex, are complex and carry a high risk of rapid financial loss. Our software provides analytical outputs and visual markers based on predefined mathematical conditions and does not mitigate or reduce inherent market risks. You should carefully consider whether you understand how leveraged financial instruments work and whether you can afford the high risk of losing your capital.
CFTC Rule 4.41 — Hypothetical or simulated performance results have inherent limitations. Unlike actual performance records, simulated results do not represent real trading. Because trades have not actually been executed, these results may under- or over-compensate for the impact of market factors such as liquidity. No representation is being made that any account will achieve profits or losses similar to those shown.
Trademark Notice — NinjaTrader® is a registered trademark of NinjaTrader Group, LLC. No NinjaTrader company has any affiliation with the owner, developer, or provider of the products or services described herein, or any interest, ownership or otherwise, in any such product or service, or endorses, recommends or approves any such product or service.