NinjaTrader CCI + MA (EMA / SMA) Indicator brings together two standard technical analysis tools to support a structured approach to market analysis. Using two MAs with different averaging periods, the prevailing market bias (directional phase) is identified.
The relative positioning of moving averages is a commonly used method for assessing trend structure in technical analysis.
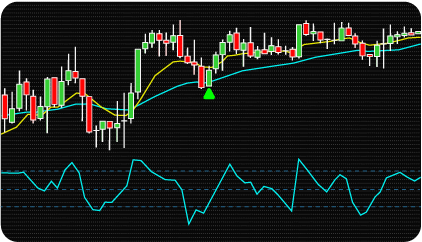
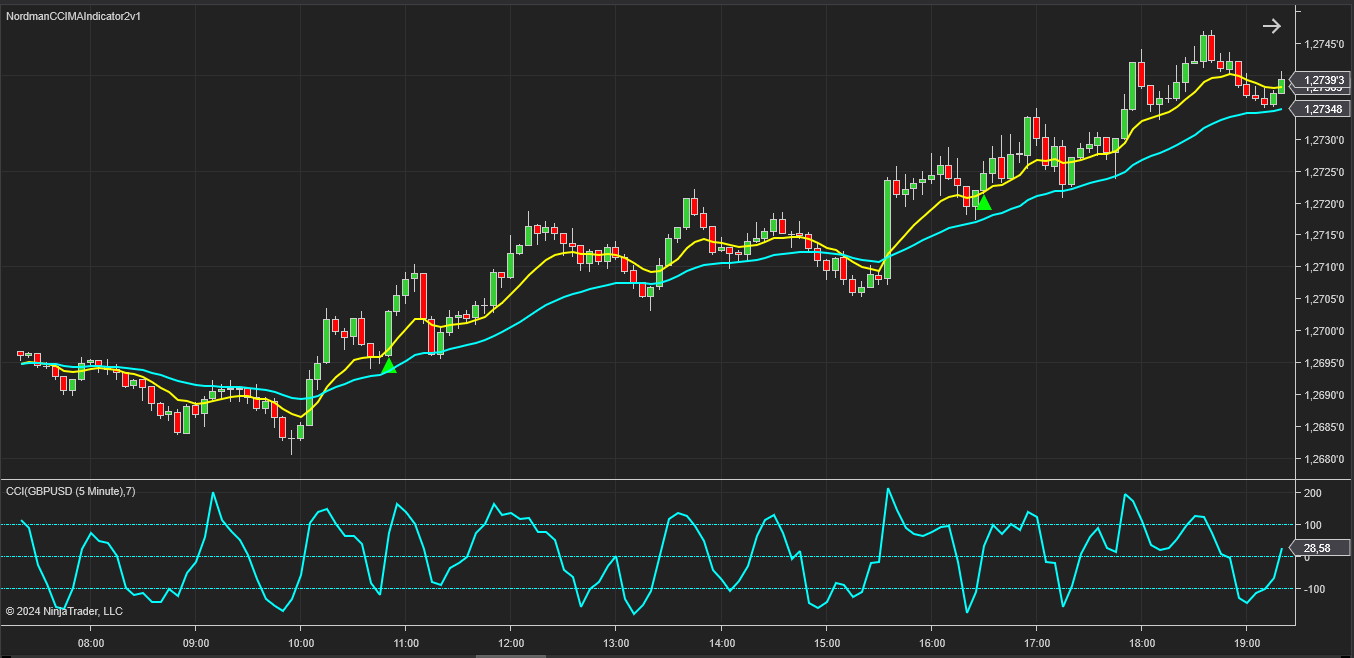
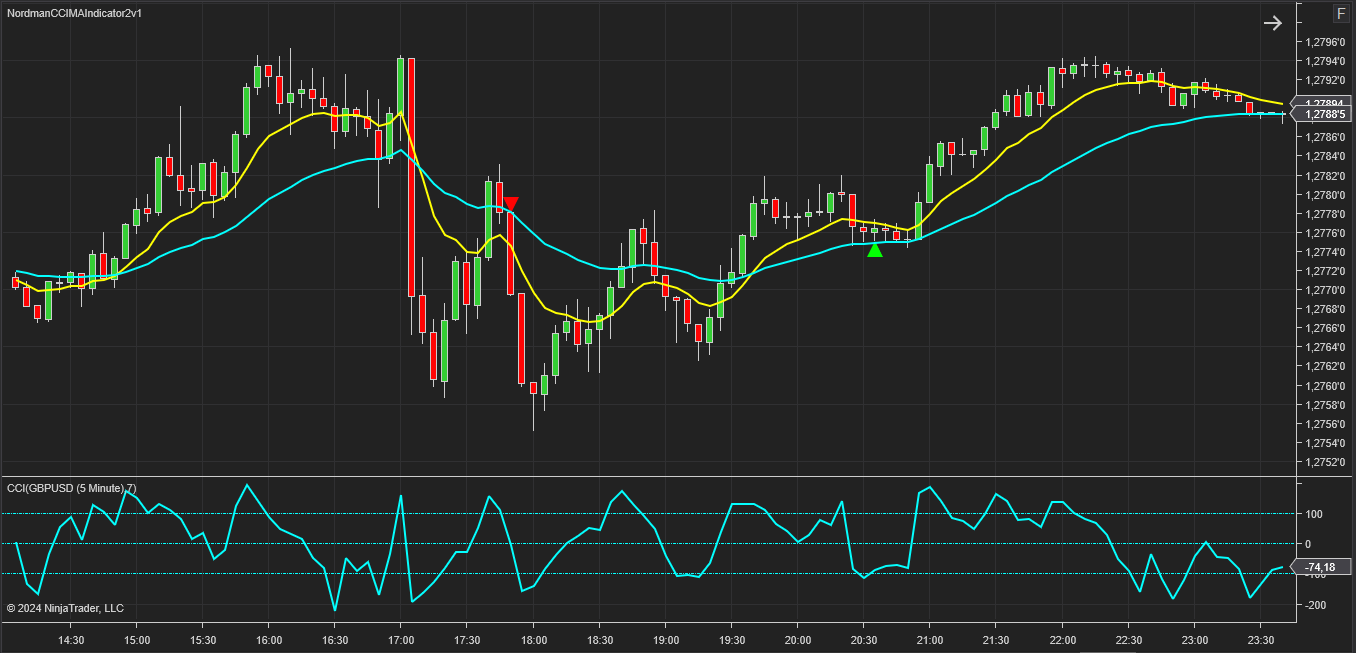
When a fast MA (having a shorter averaging period) crosses a slow MA (having a longer averaging period) from bottom to top, this indicates the presence of an uptrend in the market. Accordingly, when a fast MA crosses a slow one from top to bottom, this may reflect the emergence of a downward trend condition.
Using two MAs with different averaging periods — rather than a single MA — provides a relative rather than absolute reference for trend direction. A single MA can only show whether price is above or below one fixed level, which shifts with every new bar. The relationship between a fast and a slow MA reflects the rate of change between two timeframes simultaneously, making the trend assessment more resistant to short-term price noise and consolidation periods.
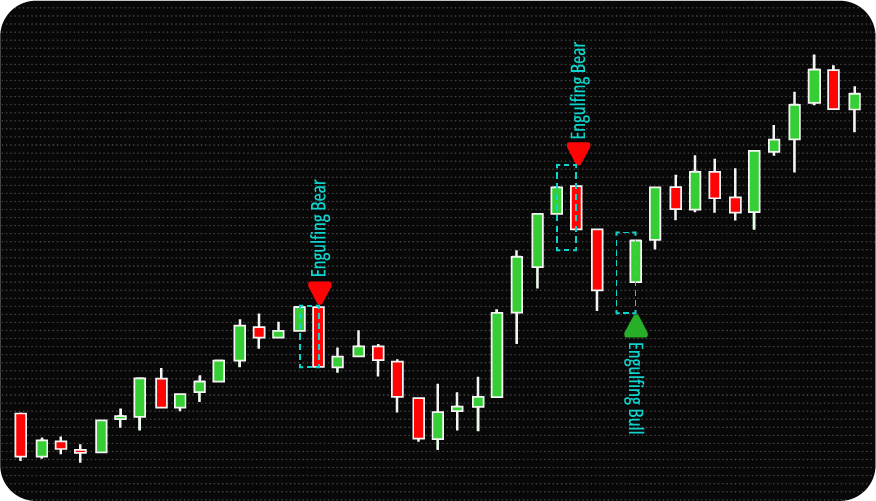
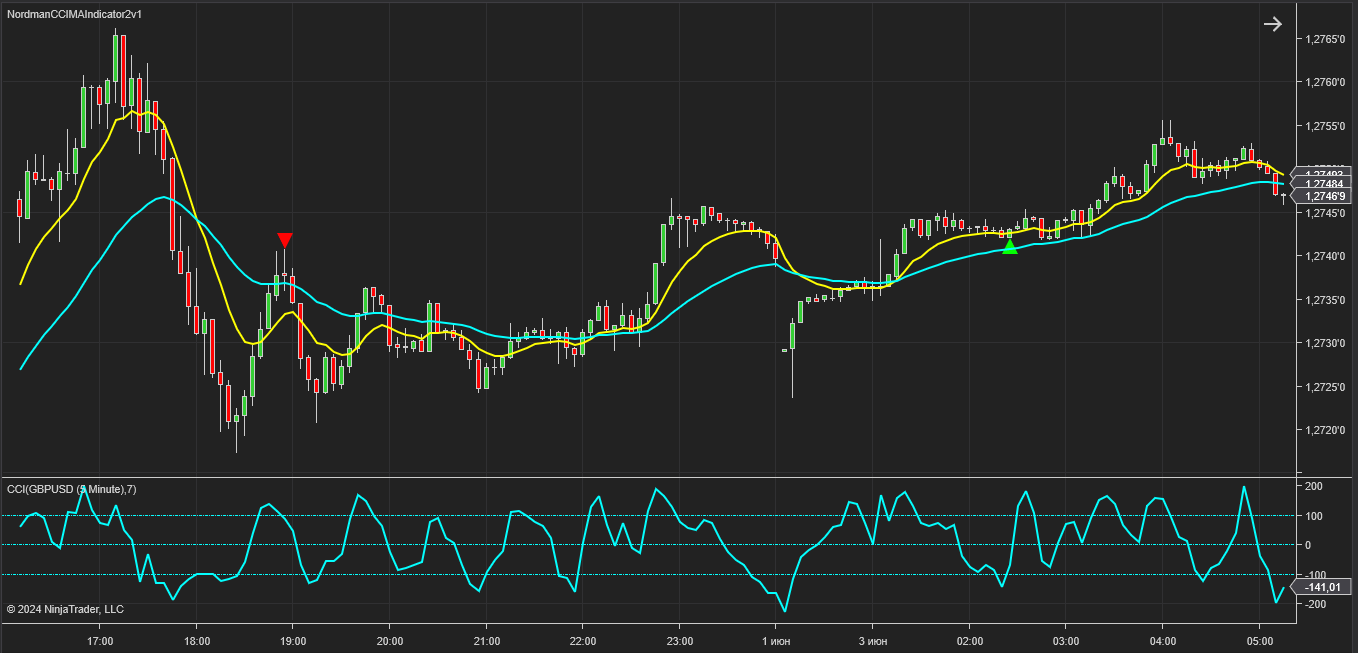
It is known that the moment immediately after the crossover of two MAs is not a technically relevant context for evaluation, since the price is at the peak of its movement. As a rule, after crossing, the momentum weakens and the price moves in the opposite direction for some time. If, after such a reverse movement, the price resumes its movement in the direction of the initial impulse, then a technically relevant condition emerges for further evaluation. If price continues moving against the initial direction, a reverse crossover occurs — filtering out the initial crossover as a low-context event.
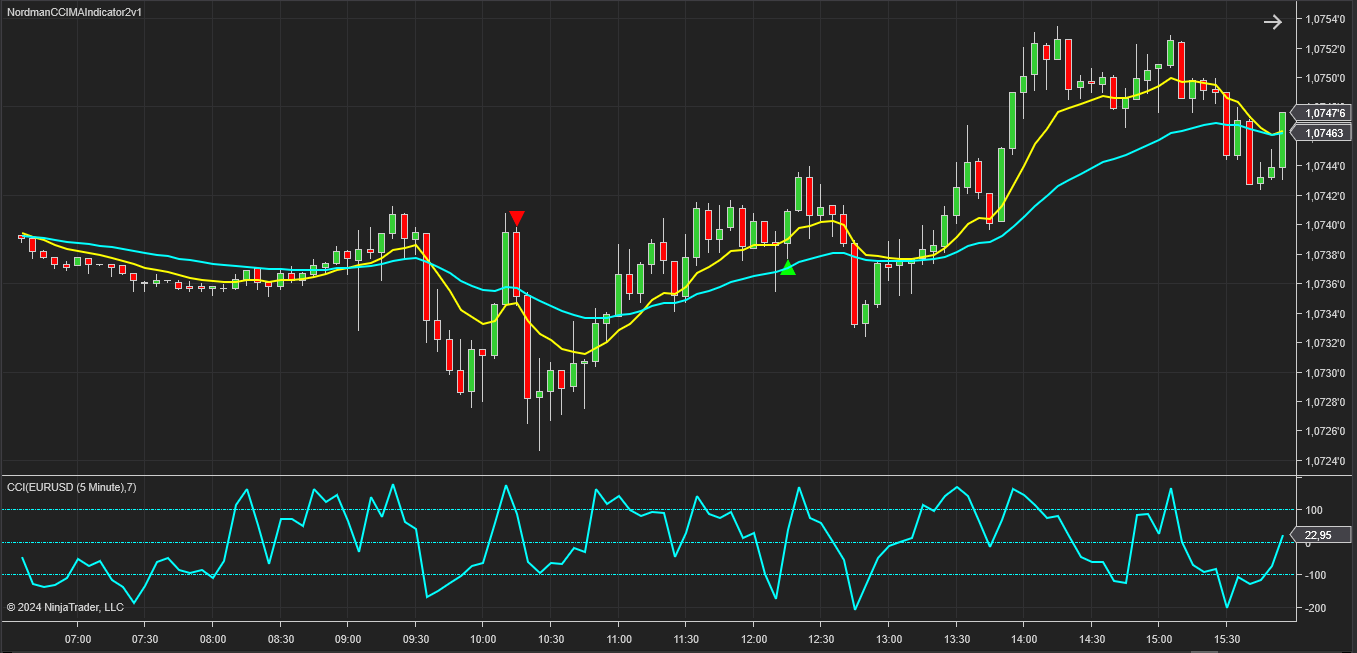
Immediately after the crossover of two MAs, tracking of the CCI oscillator is activated. In an uptrend context, the CCI line is observed falling below the -100 level. When CCI then crosses back above -100, the indicator registers an upward condition. In a downtrend context, the CCI is observed rising above the 100 level before returning below it — registering a downward condition.
The CCI oscillator is sensitive to relatively small price movements. In practice, even moderate pullbacks within a trend are often sufficient to bring CCI back to its threshold levels — which means the indicator tends to register conditions without requiring large retracements.
The indicator includes an optional MA delta filter, which may help reduce low-context crossover events during periods of subdued price movement. The crossover of two MAs is considered to have taken place only if their lines not only crossed, but then diverged by a certain amount, determined in the indicator settings.
To support timely awareness of registered conditions, the indicator includes configurable alert settings. When a visual marker appears on the chart, the indicator can notify the trader in any of three ways, which can be turned on / off independently of each other: sound (with the ability to select a sound file), by email, and a pop-up message.
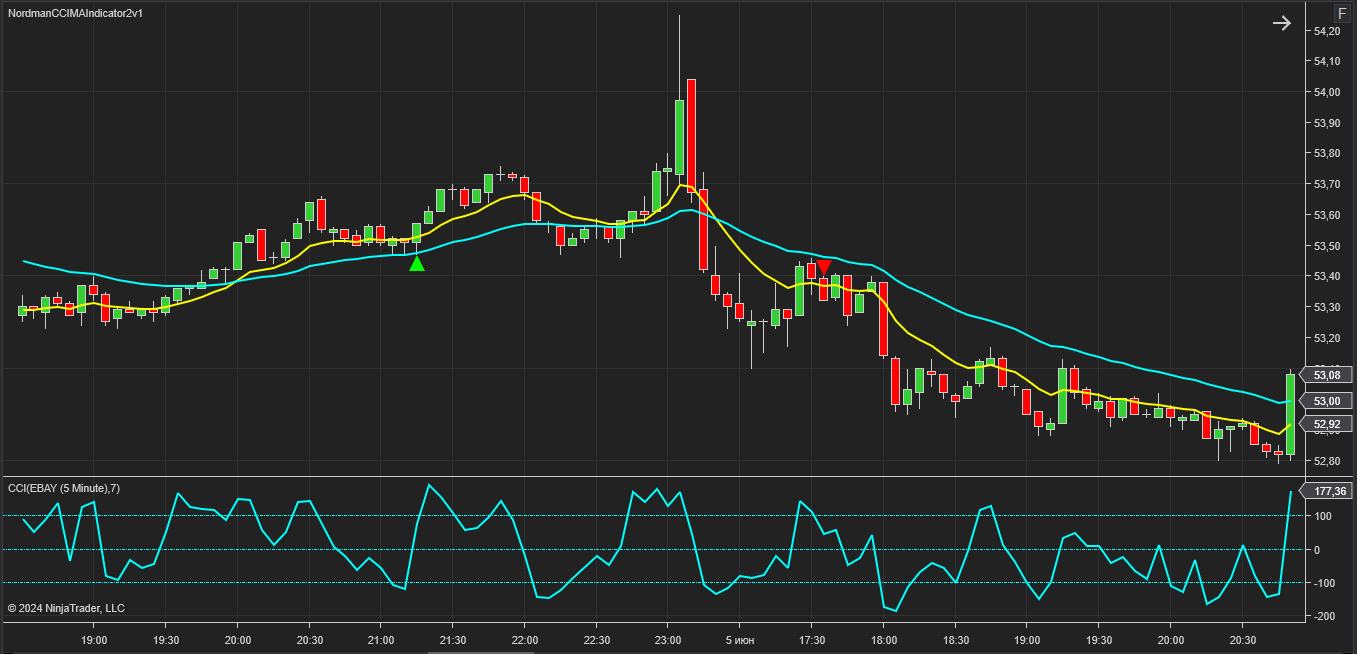
The CCI + MA approach combines two analytical functions: trend direction assessment through MA positioning, and momentum context through CCI threshold behavior. The MA component reflects whether price is developing above or below a moving reference, while the CCI component evaluates whether momentum has extended to a historically significant level relative to recent price action.
An upward condition is registered when the fast MA crosses above the slow MA and the CCI subsequently exits the oversold zone. A downward condition is registered when the fast MA crosses below the slow MA and the CCI exits the overbought zone.
Indicator Limitations
The CCI + MA indicator identifies mathematical conditions based on historical price data. It does not predict future price movement, does not account for fundamental factors or news events, and does not guarantee that any registered condition will develop in a particular direction. All analytical output should be evaluated within a broader trading methodology and used at the trader’s own discretion.
The indicator has the following parameters:
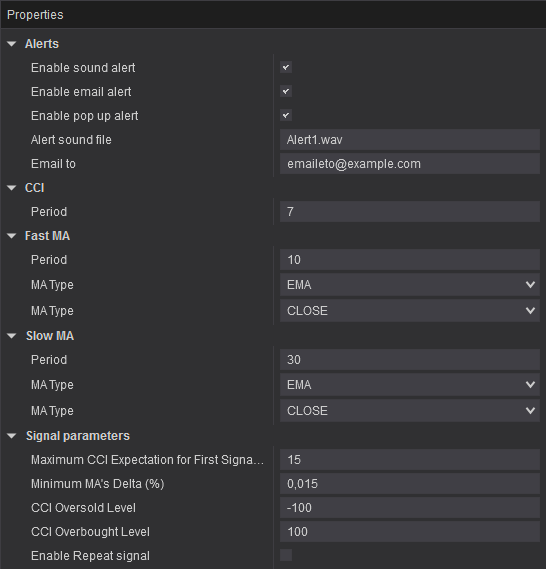
Alerts – setting up various types of alerts.
Maximum CCI Expectation – period of waiting for the CCI to exit the overbought / oversold zone after crossing the fast and slow MA (in bars).
Minimum MA’s Delta (%) – parameter that determines the minimum difference in values between the fast and slow moving averages at which the crossover will be considered valid. This setting allows you to filter out frequent MA crossings that may occur during periods of minor market movement.
CCI Oversold / Overbought Level – setting the values of overbought / oversold CCI levels.
Enable Repeat signal – activation of a repeated visual marker. The condition marker is replotted if the crossing of the fast and slow MA remains in effect, and the CCI returns through the threshold a second time.

We can customize this indicator to your needs — adding functions, modifying logic, or integrating it with other tools for your workflow.
We also convert indicators into Automated Trading Strategies with advanced functions (trailing stops, risk management, filters) tailored to your trading style strictly according to your specifications.
Request a free consultation to discuss the technical scope and timeline of your project.
We are committed to the ongoing development and refinement of our indicators. If you’ve spotted a bug, feel that something essential is missing, or have ideas that could make the indicator even better, just send us a message. Your feedback helps us improve and deliver tools that truly meet traders’ needs.
Nordman Algorithms is a trade name of Nordman Algorithms OÜ (Reg. No. 14435535), registered in Tallinn, Estonia.
Software Nature & User Responsibility — Nordman Algorithms provides algorithmic software tools for technical analysis. Nordman Algorithms is not a financial advisor and is not liable for any losses. All trades conducted based on the software’s output are executed at the user’s sole discretion and risk.
Visual Markers & Signal Disclosure — This software may display visual markers (such as arrows, dots, or alerts) when predefined mathematical conditions are met. These markers are provided for educational and analytical purposes only, must not be interpreted as financial guidance, and do not constitute a recommendation to buy, sell, or hold any financial instrument. Users must independently validate all visual cues within their own trading methodology.
No Financial Advice — Nordman Algorithms does not provide discretionary trading signals, investment advice, or managed signal services. Our software represents a mathematical visualization of historical and real-time data. The appearance of a visual marker does not guarantee a profitable trade or predict future market behavior.
Trading Risk Warning — Futures, Forex, and options trading involve significant risk. Risk capital is money that can be lost without jeopardizing financial security. Only risk capital should be used for trading. Past performance is not indicative of future results. View Full Risk Disclosure: https://www.nordman-algorithms.com/risk-disclosure/
ESMA Risk Warning — Financial instruments, especially those involving leverage such as CFDs and Forex, are complex and carry a high risk of rapid financial loss. Our software provides analytical outputs and visual markers based on predefined mathematical conditions and does not mitigate or reduce inherent market risks. You should carefully consider whether you understand how leveraged financial instruments work and whether you can afford the high risk of losing your capital.
CFTC Rule 4.41 — Hypothetical or simulated performance results have inherent limitations. Unlike actual performance records, simulated results do not represent real trading. Because trades have not actually been executed, these results may under- or over-compensate for the impact of market factors such as liquidity. No representation is being made that any account will achieve profits or losses similar to those shown.
Trademark Notice — NinjaTrader® is a registered trademark of NinjaTrader Group, LLC. No NinjaTrader company has any affiliation with the owner, developer, or provider of the products or services described herein, or any interest, ownership or otherwise, in any such product or service, or endorses, recommends or approves any such product or service.