MT5 BOS & CHoCH and FVG Indicator
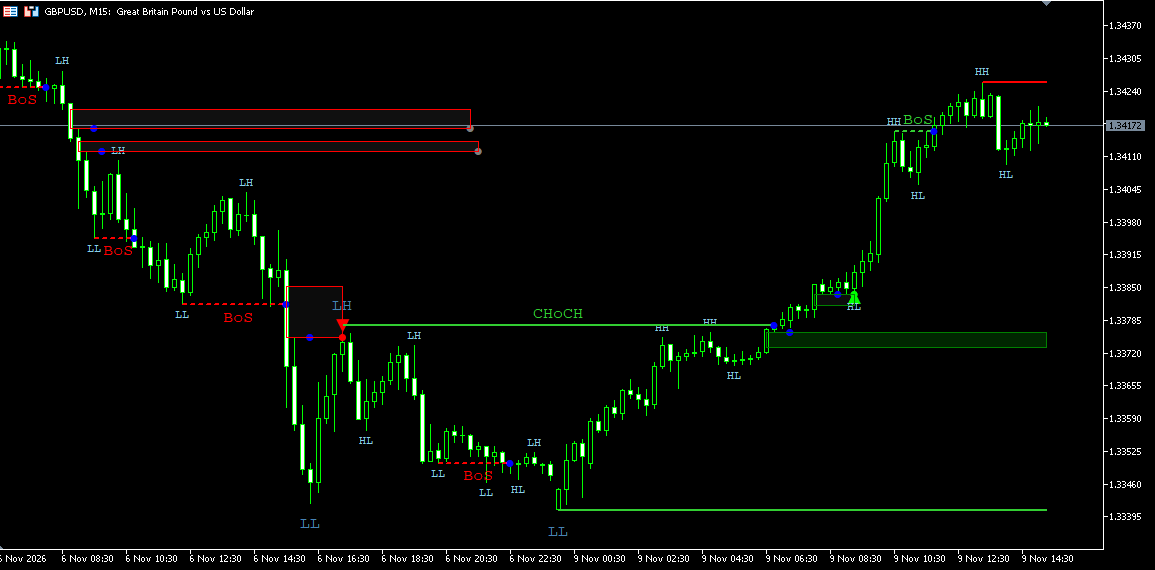
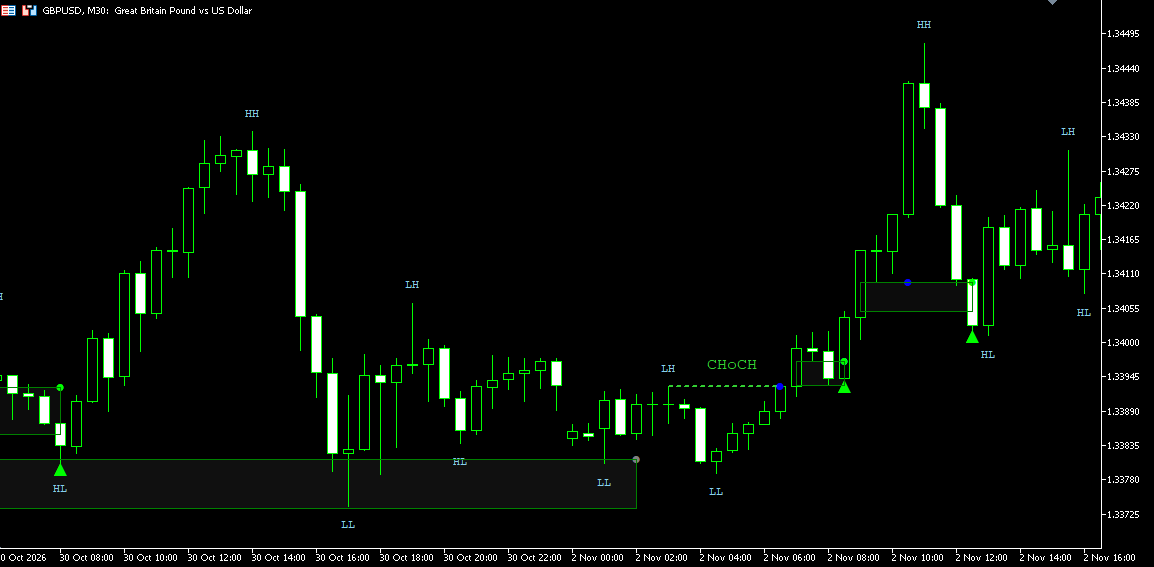
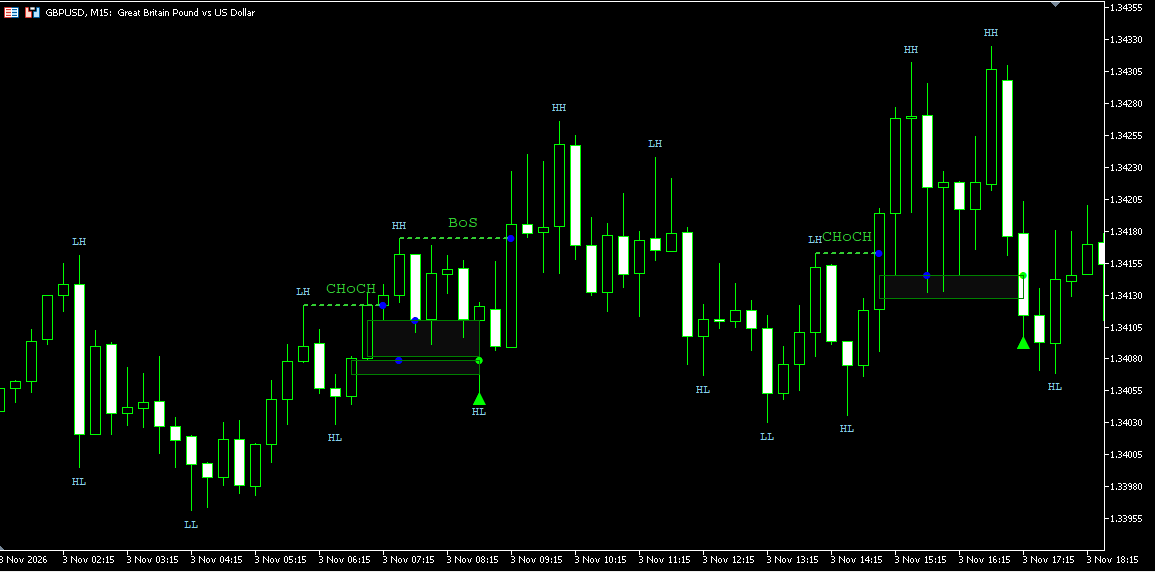
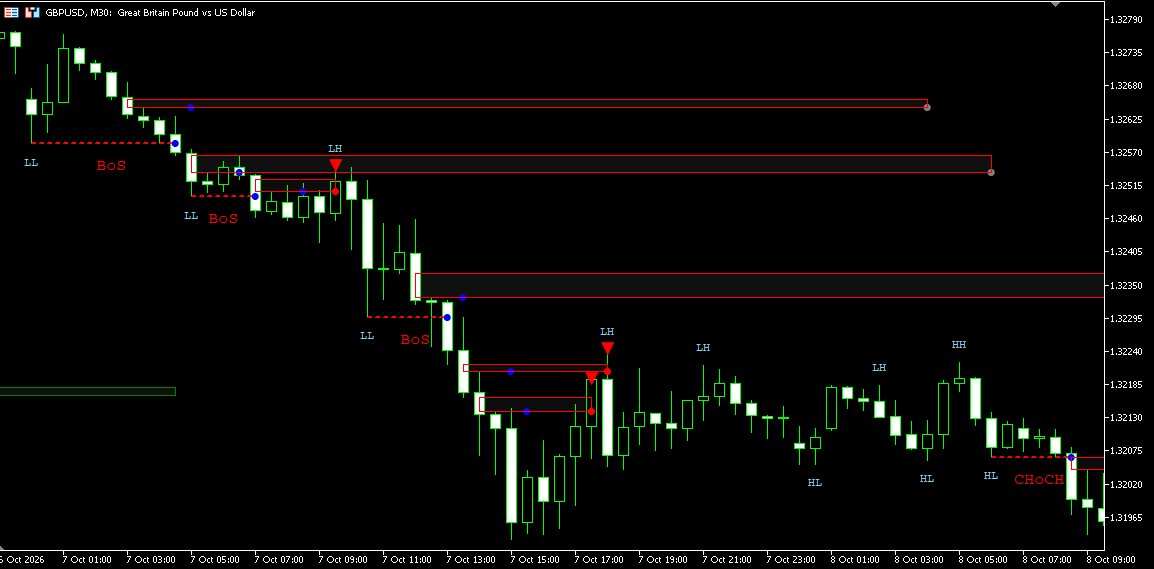
MT5 BOS & CHoCH and FVG Indicator labels swing highs and lows, draws BoS and CHoCH from the swing sequence on two scales, and finds fair value gaps around each break. When price returns into a gap, a Long or Short marker appears and an alert can be sent.
Already a subscriber or have purchased a product?
BOS, CHoCH and Fair Value Gaps Explained
A break of structure (BoS) is a break of the last swing in the direction of the trend. A change of character (CHoCH) is a break against it. A fair value gap (FVG) is a price gap left by a fast three-candle move. This indicator links the three: it searches for fair value gaps around each structure break and marks the bar where price returns into one.
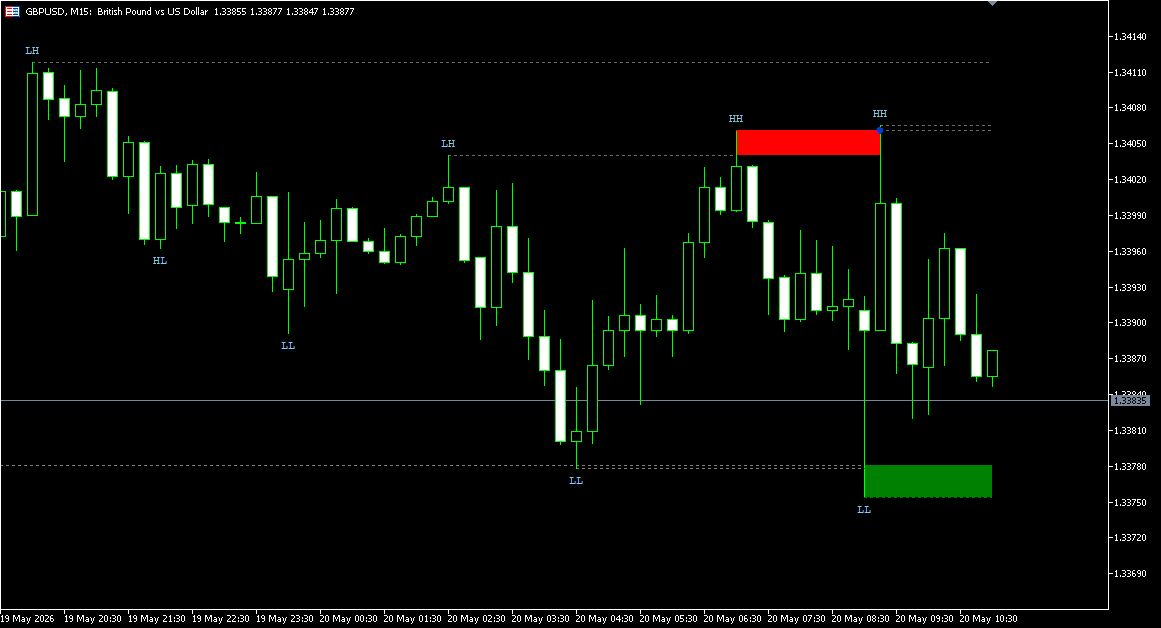
The MT5 BOS & CHoCH and FVG Indicator labels swing highs and lows as HH, LH and EH, and LL, HL and EL, on two scales at once: weak swings for the minor turns and strong swings for the larger ones. From the order of those swings it draws a BoS when price breaks the last swing with the trend and a CHoCH when it breaks against it. A break that does not follow the expected swing sequence is not labelled.
After each break the indicator looks for fair value gaps in the same direction: in the bars after the break, inside the impulse that made it, or both. Every gap is then followed until price returns into it, by the rule you choose. That return places a Long or Short marker on the chart, can send an alert, and is written to a buffer that an Expert Advisor can read.
A built-in MFE/MAE Tracker measures how far price moved after those markers. For the background, see BOS vs CHoCH: Why the Same Move Gets Two Labels and Do Fair Value Gaps Work?
BOS & CHoCH and FVG Indicator — Key Features
Two Swing Scales
Weak swings for minor turns, strong swings for larger ones.
A weak swing high is a bar whose high is not exceeded by the 3 bars on either side, set by Weak Swing Strength; a weak swing low is the mirror image. It appears once those 3 bars have closed.
Strong swings mark the turns between larger legs. A bar becomes a strong swing high when its high stays above the highs of the next 30 bars, set by Strong Swing Strength, at the point where a rising leg turns into a falling one; strong swing lows work the other way round. Strong swings therefore alternate between highs and lows and appear 30 bars after the swing bar.
Each new swing is compared with the previous swing on the same side: HH, LH or EH for highs, LL, HL or EL for lows, where EH and EL mark equal highs and lows. Weak swings use small labels and dashed structure lines, strong swings large labels and solid lines. Either scale can be switched off.
Weak Swings
Strong Swings
BoS and CHoCH
Structure breaks confirmed by the swing sequence.
A break is labelled only when the swings before it form one of these sequences. Each arrow points to the next swing; the last step is the break of the marked swing, up for bullish breaks and down for bearish ones.
| Type | Classic sequence | Allowed variation |
|---|---|---|
| Bullish BoS | HL → HH → break of HH ↑ | HL → HH → HL → break of HH ↑ |
| Bearish BoS | LH → LL → break of LL ↓ | LH → LL → LH → break of LL ↓ |
| Bullish CHoCH | LL → LH → break of LH ↑ | LL → LH → one or two lows → break of LH ↑ |
| Bearish CHoCH | HH → HL → break of HL ↓ | HH → HL → one or two highs → break of HL ↓ |
In the CHoCH variations, the swings that form before the break must all be on the same side: only lows before a bullish CHoCH, only highs before a bearish one. Equal highs and lows, EH and EL, are handled in the same way as HH and LL. The structure line runs from the swing to the break bar, where a blue point marks the break. Weak and strong swings are evaluated separately, so one move can be a CHoCH on one scale and a BoS on the other.
Break Confirmation
Close or High / Low, with an optional minimum distance.
BoS and CHoCH each have their own confirmation price type. Close, the default, needs a bar to close beyond the swing level; High / Low counts the wick. With Close, a break on the forming bar is drawn as soon as price is beyond the level and removed if the bar closes back.
An optional break confirmation threshold requires price to clear the level by a minimum distance: in ticks, 5 by default, in points as a price distance on the chart, or as a percentage of the level. A percentage that suits one symbol can be far too wide for another: 2% of a level at 1.10000 is 0.02200.
FVG Detection Modes
Fair value gaps searched only around structure breaks.
A bullish fair value gap is a three-candle pattern in which the low of the third candle stays above the high of the first, and the middle candle spans the gap; a bearish gap is the mirror image. The indicator looks only for gaps in the direction of the latest break:
- After BOS/CHoCH checks the first 5 three-candle patterns that start at the break bar, set by Max Bars To Find FVG, so the break bar itself can be the first candle of a gap.
- BOS/CHoCH Impulse finds gaps inside the move from the broken swing to the break: from a few bars before the break bar, 18% of the move’s length and at least 2 bars, to 7% of its length and at least 1 bar after it. A gap is skipped if price came back more than 20% into it before the break.
- Combined, the default, uses both.
After BOS/CHoCH
BOS/CHoCH Impulse
Combined
Gap Size and Minimum Length
Small and short-lived gaps are filtered out.
A gap must be at least the minimum size, 5 ticks by default, set in ticks, in points as a price distance, or as a percentage of price. It is shown only after it has stayed open for 3 bars, set by FVG Min Length. A gap that price fills sooner is not drawn and gives no signal.
Mitigated Mode
Define when price has returned into a gap.
Partially, the default, mitigates a gap at the first touch of its near edge. Threshold mitigates it when price reaches a dotted line inside the gap, 30% by default, measured from the edge price reaches first. Fully waits until price has crossed the whole gap.
Mitigated Price Type decides which price counts: High / Low, the default, or Close. With Close, a mitigation on the forming bar is confirmed when the bar closes and removed if the close no longer qualifies. Mitigated gaps turn grey and stop extending.
Partially
Threshold 70%
Fully
Long and Short Markers
A marker on the bar where price returns into a gap.
When a bullish gap is mitigated, a green triangle marks a Long signal on that bar; when a bearish gap is mitigated, a red triangle marks a Short signal. Each gap gives at most one signal, and a gap that has already expired gives none. The markers are signals of the indicator’s conditions, not entries, stops or targets.
Shrink Display
The open part of a gap narrows as price fills it.
FVG Display Type set to Shrink redraws the open part of each active gap bar by bar, moving the near edge to the deepest price reached so far. Default keeps every gap at its original size.
FVG Display Type: Shrink
Gap Expiry and States
Active, mitigated and expired gaps in their own colours.
With Max FVG Duration enabled, a gap that is still active 50 bars after it formed, or after a set number of minutes, expires and is marked with a grey point. When the structure on the same swing scale turns the other way, active gaps of the old direction expire as well.
Active gaps are drawn green and red, mitigated gaps grey and expired gaps dark grey, each with its own opacity. Show FVG Type displays all gaps, only active ones, or only mitigated or expired ones.
Active, Mitigated and Expired FVGs
Strong Trend High and Low
Lines at the extremes of the current strong leg.
With strong swings enabled, two lines run to the current bar: a red one from the highest high since the last strong swing high and a green one from the lowest low since the last strong swing low. They move as price sets new extremes.
Display and Colours
Labels, lines and colours set separately.
Swing labels for weak and strong swings can be shown or hidden and sized separately, in a standard blue tone or in bullish and bearish colours. The BoS and CHoCH label text, font size and style, the colours of bullish and bearish structures and the colours of each gap state can all be changed.
Alerts
Pop-up, sound and email on Long and Short signals.
An alert is sent when a Long or Short marker appears in real time, at most once per bar, as a pop-up, a sound and an email, each switched on or off separately. BoS, CHoCH and new gaps do not trigger alerts. Emails go to the address set in MetaTrader 5 under Tools → Options → Email.
Built-In MFE/MAE Tracker
Measures price movement after Long and Short markers.
When enabled, the tracker records the maximum favourable and maximum adverse excursion after each Long and Short signal over up to four holding periods, set in seconds, minutes or days, and optionally until the opposite signal. Excursions are calculated from minute or tick data. The table shows the median MFE/MAE ratio for each period, and an Export button saves it to a file.
See how the MFE/MAE Tracker is calculated and how to read the table →
Signals Readable by Expert Advisors
Structure, gap and signal events stored in indicator buffers.
All events are available to an Expert Advisor through iCustom() and CopyBuffer(): buffers 0–1 hold the Long and Short signals, 2–3 the strong trend high and low, 4–13 gap detection, boundaries, mitigation and expiry, 14–17 bullish and bearish BoS and CHoCH, 18–29 the weak and strong swing types, and 30–39 the MFE/MAE values. Bars without a value hold EMPTY_VALUE.
How to Read and Use Structure Breaks and Fair Value Gaps
Reading the Chart
Swing labels show the structure: higher highs and higher lows in a rise, lower highs and lower lows in a fall. A BoS line marks a break with the trend, a CHoCH line a break against it. Green and red boxes are bullish and bearish fair value gaps that are still active; grey boxes are gaps price has already returned into or that have expired. Triangles mark the Long and Short signals on the bars where gaps were mitigated.
Choosing the Swing Scales
Weak swings follow the small pullbacks and react first; strong swings follow the larger legs and change less often. When both are on, the same move can be a CHoCH for the weak swings and a BoS for the strong ones: the weak swings see a short pullback turning, the strong swings see the main trend continuing. Many traders choose one scale for signals and keep the other for context.
Strong swings are confirmed 30 bars after the swing bar with the default Strong Swing Strength, so their labels and breaks appear later than the weak ones.
Close or High / Low
Close confirmation waits for a bar to close beyond the level and ignores wicks that poke through and close back inside. High / Low reacts on the first wick through the level, earlier and to more false breaks. A minimum break distance in ticks or points is easier to keep consistent on a single symbol than a percentage.
Choosing the FVG Detection Mode
After BOS/CHoCH keeps the gaps that form once the break is in place. BOS/CHoCH Impulse keeps the gaps the breaking move left behind. Combined shows both and therefore more gaps. A larger Max Bars To Find FVG widens the search after a break.
Choosing the Mitigation Settings
Partially gives a signal at the first touch of a gap. Threshold waits until price reaches the set depth inside it. Fully waits until price has crossed the whole gap, which produces fewer and later signals. Close-based settings ignore wicks and confirm the mitigation at the bar close.
Measuring Signals with the MFE/MAE Tracker
Enable the tracker and set holding periods that match how long you usually keep a trade. The table shows, for each period, the median ratio between the favourable and the adverse move after the Long and Short signals on the loaded history. The results describe past price movement after the signals and say nothing certain about future trades. For a broader look at fair value gap returns, see Do Fair Value Gaps Work?
Limitations
- Swings are confirmed only after the bars that follow them have closed: 3 bars for weak swings and 30 bars for strong swings by default. Breaks and gaps depend on those swings.
- With Close confirmation, a break or mitigation on the forming bar can be removed if the bar closes back.
- Fair value gaps are searched only around structure breaks and only in their direction. Gaps elsewhere on the chart are not drawn.
- The indicator processes the last 1,500 bars by default, set by History Bars To Process.
- The indicator does not provide entry levels, stop-loss levels or targets.
Indicator Settings & Parameters
Inputs as they appear in the indicator’s Inputs tab.
| Parameter | Description |
|---|---|
| License | |
| License Email | The email used for your trial, subscription or purchase. The license is verified with this email. |
| Alerts | |
| Enable pop up alert | Shows a pop-up alert. Default: true. |
| Enable sound alert | Plays a sound when an alert is triggered. Default: true. |
| Alert sound file | Sound file played for alerts. Default: Alert1.wav. |
| Enable email alert | Sends an email. Default: true. |
| Email to | Emails are sent to the address set in MetaTrader 5 under Tools → Options → Email. |
| General | |
| History Bars To Process | Number of past bars the indicator calculates. Default: 1500. |
| Swing Detection | |
| Enable Weak Swings | Detects weak swings and their breaks. Default: true. |
| Weak Swing Strength | Bars on each side that a weak swing high or low must exceed. Default: 3. |
| Enable Strong Swings | Detects strong swings, their breaks and the strong trend high and low. Default: true. |
| Strong Swing Strength | Bars after a strong swing that must stay below its high or above its low. Default: 30. |
| BoS and CHoCH | |
| Enable BoS | Detects and draws breaks of structure. Default: true. |
| BoS Confirmation Price Type | Close or High / Low. Default: Close. |
| Enable CHoCH | Detects and draws changes of character. Default: true. |
| CHoCH Confirmation Price Type | Close or High / Low. Default: Close. |
| Enable Break Confirmation Threshold | Requires price to clear the swing level by a minimum distance. Default: false. |
| Threshold Type | Ticks, Points or Percent. Default: Ticks. |
| Threshold (Ticks) | Default: 5. |
| Threshold (%) | Percentage of the swing level. Default: 2. |
| Threshold (Points) | Price distance on the chart. Default: 0.5. |
| FVG | |
| FVG Detection Mode | After BOS/CHoCH, BOS/CHoCH Impulse or Combined. Default: Combined. |
| Max Bars To Find FVG | Number of three-candle patterns checked after a break, starting at the break bar, in After BOS/CHoCH and Combined modes. Default: 5. |
| Show FVG Type | All, Active, Unactive: All, Unactive: Mitigated or Unactive: Expired. Default: All. |
| FVG Display Type | Default or Shrink. Default: Default. |
| Mitigated Mode | Fully, Partially or Threshold. Default: Partially. |
| Threshold Value (%) | Depth of the threshold line inside the gap, measured from the edge price reaches first. Default: 30. |
| Mitigated Price Type | High / Low or Close. Default: High / Low. |
| Gap Size Mode | Ticks, Points or Price Percent. Default: Ticks. |
| Minimum FVG Gap Size (Ticks) | Default: 5. |
| Minimum FVG Gap Size (Points) | Price distance on the chart. Default: 1.25. |
| Minimum FVG Gap Size (%) | Percentage of price. Default: 0.1. |
| FVG Min Length (bars) | Bars a gap must stay open before it is shown. Default: 3. |
| Max FVG Duration | Ends active gaps after a set time. Default: true. |
| FVG Duration Type | Bars or Minutes. Default: Bars. |
| FVG Duration in Bars | Default: 50. |
| FVG Duration in Minutes | Default: 60. |
| Display and Visualization | |
| Show Swing Points (Weak) | Default: true. |
| Weak Swings Label Font Size | Default: 8. |
| Show Swing Points (Strong) | Default: true. |
| Strong Swings Label Font Size | Default: 12. |
| Swing Label Font Style | Normal or Bold. Default: Normal. |
| Swing Points Color Mode | Standard draws swing labels in blue tones; Colored uses the colours below. Default: Standard. |
| Weak Swing Points Color (HH/HL/EH) | Default: lime green. |
| Weak Swing Points Color (LL/LH/EL) | Default: red. |
| Strong Swing Points Color (HH/HL/EH) | Default: lime green. |
| Strong Swing Points Color (LL/LH/EL) | Default: red. |
| BoS Label Text | Default: BoS. |
| CHoCH Label Text | Default: CHoCH. |
| BoS/CHoCH Label Font Size | Default: 12. |
| BoS/CHoCH Label Font Style | Normal or Bold. Default: Normal. |
| Bullish / Bearish Structures Color | Colours of structure lines, labels and the strong trend high and low. Defaults: lime green and red. |
| Bullish / Bearish FVG Color and Opacity | Colours of active gaps. Defaults: green and red, 30%. |
| Mitigated FVG Color and Opacity | Default: grey, 10%. |
| Expired FVG Color and Opacity | Default: dark grey, 10%. |
| MFE/MAE Tracker | |
| Enable Tracker | Turns the MFE/MAE Tracker and its table on or off. Default: false. |
| Enable Opposite Signal | Adds a column that measures each signal until the next opposite signal. Default: true. |
| Calculation Precision | Data used for the excursions: Tick or Minute. Default: Minute. |
| Enable Period 1–4 | Turns each holding period on or off. Default: true. |
| Period 1–4 Type | Seconds, Minutes or Days. Default: Minutes. |
| Period 1–4 Value | Length of each holding period. Defaults: 30, 60, 180 and 360. |
| Track Long Signals / Track Short Signals | Includes Long or Short signals in the table. Default: true. |
| Show Indicator Name | Shows the indicator name in the table. Default: false. |
| Table Width (%) | Default: 35. |
| Table Font Size | Default: 10. |
Frequently Asked Questions
BOS, CHoCH & FVG Basics
A BoS is a break of the last swing in the direction of the trend, for example above the last higher high in a rise. A CHoCH is a break against it, for example below the last higher low in a rise. The indicator labels a break only when the swings before it form the expected sequence.
Weak and strong swings are evaluated separately. On a short pullback inside a rise, the weak swings see a small downtrend that has just turned and print a CHoCH, while the strong swings still see the rise and print a BoS when price clears the strong high.
A strong swing is confirmed only when the next 30 bars, set by Strong Swing Strength, have stayed below its high or above its low. A lower value makes strong swings appear sooner and more often.
From three candles: for a bullish gap, the low of the third candle stays above the high of the first and the middle candle spans the space between them; a bearish gap is the mirror image. The gap must be at least the minimum size and in the direction of the latest structure break.
Gaps are searched only around BoS and CHoCH breaks and only in their direction. A gap must also reach the minimum size and stay open for 3 bars; one that price fills sooner is not drawn. Show FVG Type can hide active, mitigated or expired gaps.
Setup & Use
When price returns into a gap by the selected Mitigated Mode: a bullish gap gives a Long signal, a bearish gap a Short signal. Each gap gives at most one signal, and an expired gap gives none.
Swings and gaps are confirmed on closed bars and do not change afterwards. With Close confirmation, a break or mitigation on the forming bar can appear and be removed if the bar closes back. With High / Low, it is confirmed as soon as price reaches the level.
Alerts are sent only for Long and Short signals, at most once per bar and in real time. Breaks of structure and new gaps are shown on the chart and in the buffers.
To the address set in MetaTrader 5 under Tools → Options → Email. The terminal’s email settings must be filled in for emails to be delivered.
How far price moved for and against each Long and Short signal over the holding periods you set, and optionally until the opposite signal.
Yes. Long and Short signals are in buffers 0 and 1, gaps in 4–13, BoS and CHoCH in 14–17, swings in 18–29 and MFE/MAE values in 30–39. Bars without a value hold EMPTY_VALUE.
System Requirements & Installation
What you need to run the indicator, how to download and install it in MetaTrader 5, and how the license works.
System Requirements
- Platform
- MetaTrader 5 (Desktop)
- Operating system
- Windows 10 or Windows 11
- Instruments
- Forex pairs, metals, indices, CFDs and other symbols available from your broker in MetaTrader 5
- Data
- Your broker’s price feed in MetaTrader 5
Not available on MetaTrader 5 Web or Mobile. Custom indicators run in the MetaTrader 5 desktop terminal only.
License Terms
- Lifetime License
- This indicator only, 1 live and 1 demo account, one-time payment, free updates included.
- All-Access Subscription
- All indicators and trade copiers, billed monthly, cancel anytime, updates included while the subscription is active.
- Free trial
- 5 days on the subscription plan. If not cancelled, the subscription starts automatically.
- License binding
- Linked to your email and to your MetaTrader 5 trading accounts: one live account and one demo account.
- Computers
- Not restricted. The license is linked to your trading accounts, not to a specific computer.
Installation
- Get access
Start the free trial, subscribe, or buy a lifetime license on this page.
- Download
The indicator is not sent by email. Open (top right of this page) and enter the email you used for your trial, subscription or purchase. The indicator file (.ex5) downloads to your computer.
- Copy to the MetaTrader 5 data folder
In MetaTrader 5, go to
File → Open Data Folder, openMQL5 → Indicatorsand copy the downloaded .ex5 file there. - Add to a chart
Restart MetaTrader 5 or right-click Indicators in the Navigator window and select Refresh. Then drag the indicator from the Navigator onto a chart.
- Activate the license
In the indicator inputs, enter the same email. On first activation, the license is linked to that email and to the trading account the terminal is logged into.
The license check needs DLL imports. Allow them in the indicator’s Common tab or under
Tools → Options → Expert Advisors. Without them, or without a valid email, the indicator shows a message and does not load.
Updating: When a new version is released, download it again through and replace the existing .ex5 file in the same folder.
Installation questions? Contact support, Monday to Friday.
"Best Seller" and "Trending" reflect Nordman Algorithms sales and usage data, January–September 2026.
Disclaimer — Software Use & Risk Disclosure
Nordman Algorithms is a trade name of Nordman Algorithms OÜ (Reg. No. 14435535), registered in Tallinn, Estonia.
Software Use
Software Nature & User Responsibility — Nordman Algorithms provides algorithmic software tools for technical analysis. Nordman Algorithms is not a financial advisor and is not liable for any losses. All trades conducted based on the software’s output are executed at the user’s sole discretion and risk.
Visual Markers & Signal Disclosure — This software may display visual markers (such as arrows, dots, or alerts) when predefined mathematical conditions are met. These markers are provided for educational and analytical purposes only, must not be interpreted as financial guidance, and do not constitute a recommendation to buy, sell, or hold any financial instrument. Users must independently validate all visual cues within their own trading methodology.
No Financial Advice — Nordman Algorithms does not provide discretionary trading signals, investment advice, or managed signal services. Our software represents a mathematical visualization of historical and real-time data. The appearance of a visual marker does not guarantee a profitable trade or predict future market behavior.
Read the full Terms of Service →Risk Disclosure
Trading Risk Warning — Futures, Forex, and options trading involve significant risk. Risk capital is money that can be lost without jeopardizing financial security. Only risk capital should be used for trading. Past performance is not indicative of future results. An investor could potentially lose all or more than the initial amount committed.
ESMA Risk Warning — Financial instruments, especially those involving leverage such as CFDs and Forex, are complex and carry a high risk of rapid financial loss. Our software provides analytical outputs and visual markers based on predefined mathematical conditions and does not mitigate or reduce inherent market risks. You should carefully consider whether you understand how leveraged financial instruments work and whether you can afford the high risk of losing your capital.
CFTC Rule 4.41 — Hypothetical or simulated performance results have inherent limitations. Unlike actual performance records, simulated results do not represent real trading. Because trades have not actually been executed, these results may under- or over-compensate for the impact of market factors such as liquidity. Simulated results are also subject to the benefit of hindsight. No representation is being made that any account will achieve profits or losses similar to those shown.
Read the full Risk Disclosure →Trademark Notice — MetaTrader 5 and MT5 are trademarks of MetaQuotes Ltd. Nordman Algorithms is an independent software developer and is not affiliated with, sponsored by, or endorsed by MetaQuotes Ltd. References to MetaTrader 5 identify software compatibility.
Need a different setup?
We can customize this indicator to your specifications: add new functions, modify the logic, refine visuals, or integrate it with other MetaTrader 5 tools. We also convert indicators into Expert Advisors with trailing stops, position parameter controls, execution filters and rule-based automation built to your technical specifications.
Every project is delivered with full source code and post-delivery support. Fixed-price quote before development begins.