cTrader SMT Divergence Indicator
cTrader SMT Divergence Indicator is a multi-instrument market structure tool that detects both Classic and Hidden SMT divergence between correlated assets. The indicator supports Forming and Confirmed SMT states, configurable swing validation, multiple qualification filters — Volume, EMA, Higher Timeframe EMA, VWAP, and Kill Zones — and a dedicated correlated asset panel with support for a second correlated instrument.
Already a subscriber or have purchased a product?
SMT Divergence Concept Explained
The cTrader SMT Divergence Indicator is built around SMT (Smart Money Technique) Divergence, an intermarket divergence concept used in ICT (Inner Circle Trader) and Smart Money Concepts (SMC) methodologies.
Correlated instruments usually move with similar structure. When one instrument makes a new high or low and the correlated one does not confirm it, that mismatch is often read as weakening momentum or a shift in participation between the two instruments.
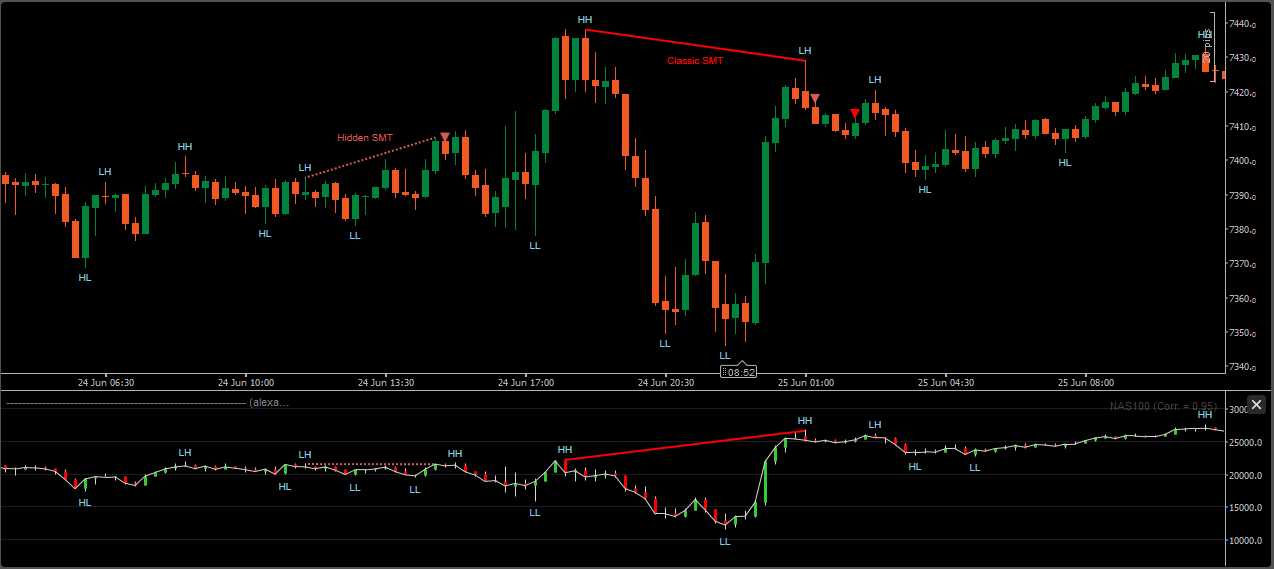
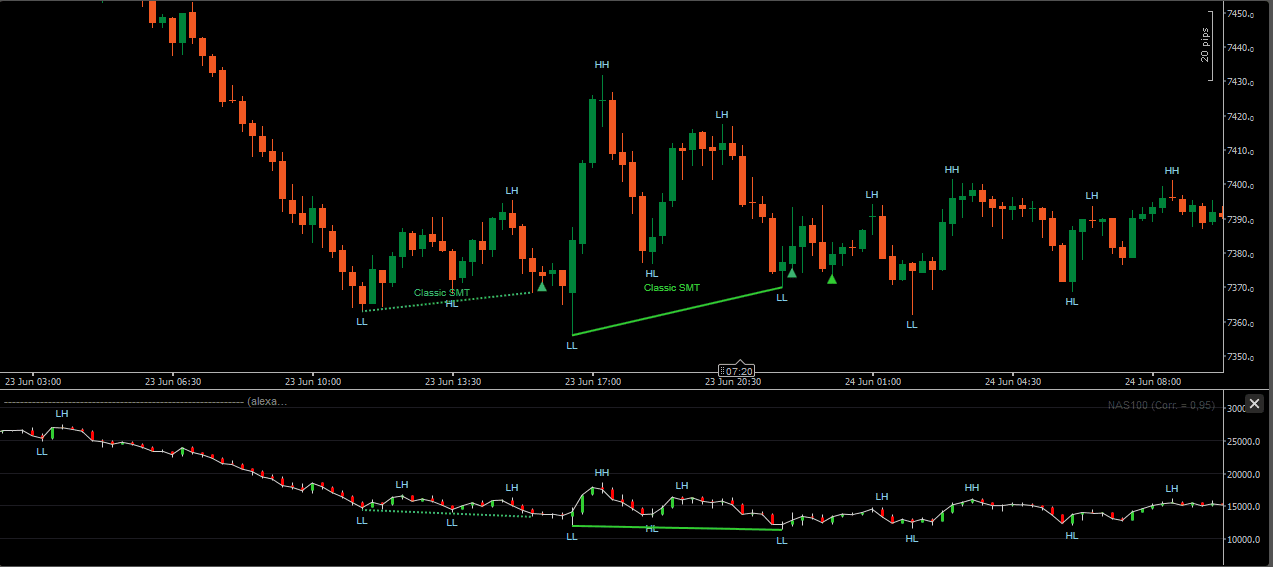
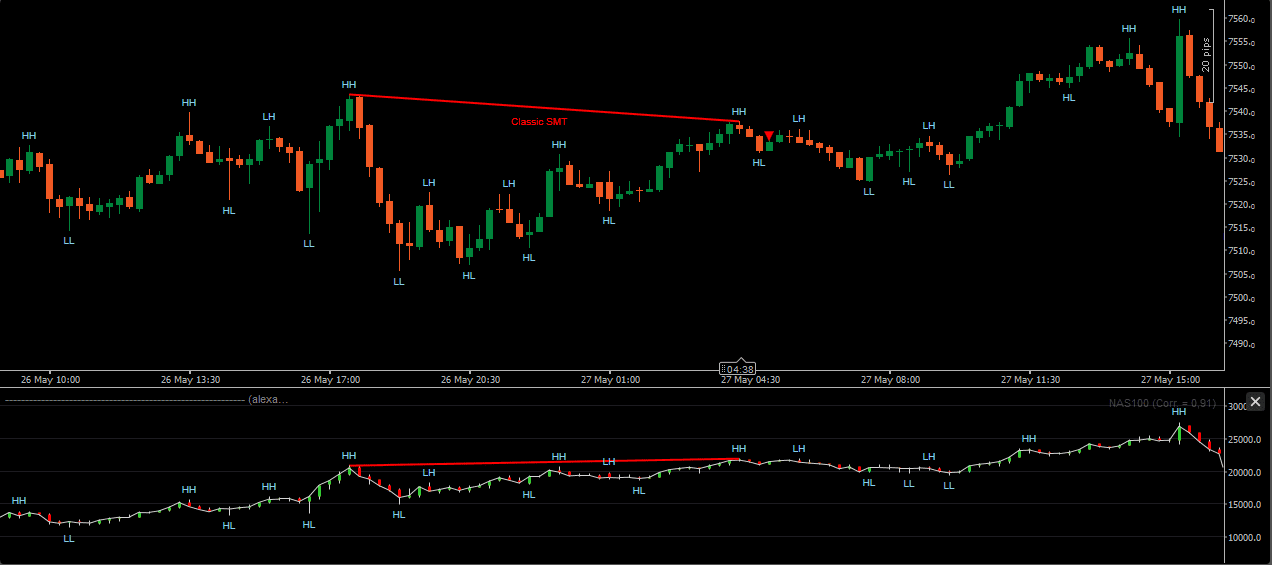
Classic SMT is built around that failed confirmation at highs or lows. A bearish Classic SMT appears when one instrument makes a higher high and the correlated instrument does not. Bullish Classic SMT follows the same logic on lows.
The indicator also supports Hidden SMT divergence, which is the inverted version of Classic SMT and is usually read as continuation rather than reversal. In bearish Hidden SMT, the correlated instrument keeps pushing higher while the analyzed instrument does not show the same strength. Hidden bullish SMT follows the same idea on lows.
Because SMT depends on swing structure and timing alignment between two instruments, small changes in swing validation can affect whether a divergence is detected. The indicator handles this with configurable swing logic, timing tolerance, and structural filters instead of relying on a fixed pattern.
SMT Divergence Indicator — Key Features
Classic & Hidden SMT Detection
The indicator supports two SMT types: Classic and Hidden.
In Classic SMT, one instrument makes a new high or low while the correlated instrument fails to follow. That mismatch shows up at the structural extreme.
Hidden SMT flips that pattern. The correlated instrument pushes further, while the analyzed instrument does not. This is generally read as continuation rather than reversal.
Each divergence type can be toggled independently, so the indicator can run Classic only, Hidden only, or both at the same time — for bullish and bearish structures alike.
Classic SMT Divergence
Hidden SMT Divergence
Forming & Confirmed SMT States
SMT can be tracked in two distinct states: Forming and Confirmed.
A Forming SMT condition appears while the swing point is still developing, before it passes Swing Strength validation. It’s an early read of the structure.
A Confirmed SMT condition appears only after the swing passes validation. The structure is already settled by the time it shows up.
If the swing later passes validation, the Forming marker is replaced by the Confirmed SMT. If it does not, the Forming marker stays on the chart while Forming SMT markers are enabled.
Speed versus certainty — the indicator lets both states run side by side.
Swing Structure & SMT Validation
SMT detection is based on swing structure, not raw candle patterns, so the quality of the swings directly affects how divergence is detected.
Swing Strength sets the bar for what counts as a valid high or low. Raise it and only more developed swings qualify; lower it and the indicator reacts to shorter-term structure.
Vertex Match Tolerance controls how far apart two swings can be and still count as a match. The correlated instrument does not need to form its swing on the same bar — the indicator checks within a configurable number of bars on either side.
SMT Min Bars Distance filters out swing points that are too close together, which helps remove shallow, short-lived structures.
A separate strength filter can require a minimum price displacement before a divergence qualifies, measured in either ticks or percentage.
SMT Detection Filters
Beyond swing validation, optional filters can decide whether a divergence is allowed to appear at all.
Available filters:
- Volume Filter
- EMA Filter
- Higher Timeframe EMA Filter
- VWAP Filter
- Kill Zones Filter
The Volume Filter compares current activity with a lookback average before letting an SMT condition through. The EMA and Higher Timeframe EMA filters require price to be on a specific side of a moving average — one on the chart timeframe, the other on a higher timeframe. The VWAP Filter works the same way relative to session VWAP.
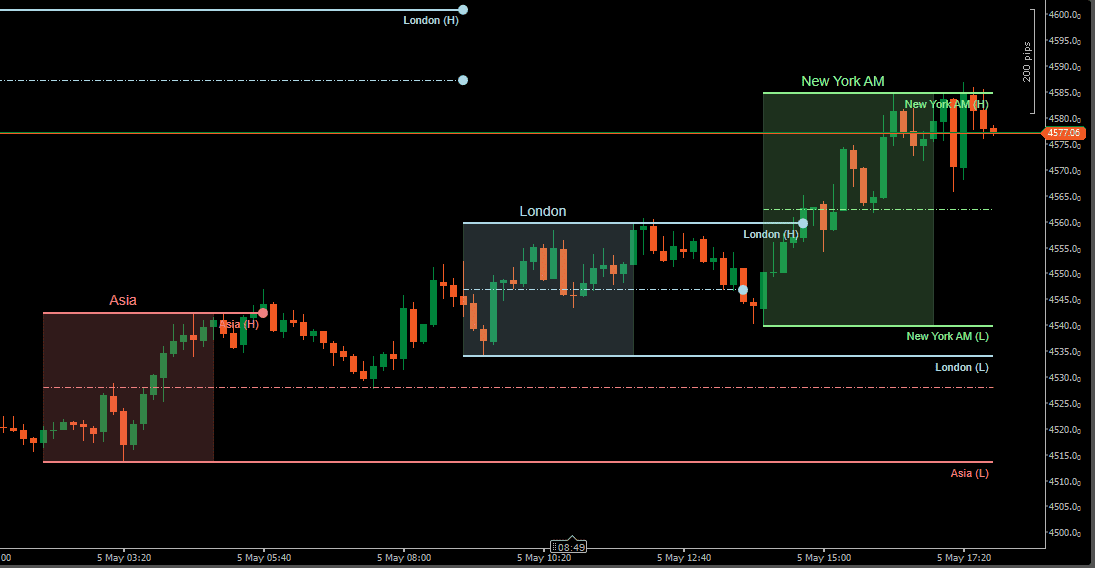
Kill Zones restrict detection to chosen time windows — Asia, London, New York, or a custom session — so SMT conditions outside those hours are ignored.
Each filter runs independently and can be combined with any of the others.
Correlated Asset Comparison
A separate panel shows the correlated instrument alongside the primary chart, so a second chart window isn’t needed.
SMT divergence lines appear on both the primary chart and the correlated panel, making the relationship between the two instruments easier to see at a glance.
A second correlated instrument can also be added, so the primary chart can be compared against two markets at once. SMT markers stay on the primary chart; the correlated panel itself is reserved for structural comparison.
Visual Customization
SMT structures, swing labels, and the correlated asset panel can all be styled independently from the main chart.
Bullish, bearish, Forming, and Confirmed SMT structures each have their own color, and when a second correlated instrument is active, its SMT structures use a separate color set so the two comparisons stay visually distinct.
Classic and Hidden SMT labels can be renamed or hidden, and swing labels and SMT labels can be adjusted in size and color.
Inside the correlated asset panel, candles, candle body width, outline and wick color, and the correlated instrument’s value display can all be shown or hidden and styled separately from the primary chart.
How to Interpret and Use the SMT Divergence Indicator
Reading Classic SMT Divergence
A Classic SMT condition appears when the analyzed instrument and its correlated counterpart stop agreeing at the structural extremes.
In a bearish Classic SMT, the analyzed instrument prints a higher high while the correlated instrument fails to follow with its own higher high. A bullish Classic SMT mirrors this on the low side.
Because the two instruments are usually expected to move together, disagreement at a key swing point is often read as a sign that the move is losing the confirmation it would normally have.
Understanding Hidden SMT Divergence
Hidden SMT uses the inverted version of the same relationship and is generally read in the opposite context from Classic SMT.
In a bearish Hidden SMT, the correlated instrument keeps printing stronger highs while the analyzed instrument fails to match that strength. Bullish Hidden SMT follows the same pattern on lows.
Same comparison between two instruments. Different structural setup, different interpretation.
Forming vs Confirmed SMT
A Forming SMT condition appears before the swing point behind it has been fully validated — the structure is still taking shape.
A Confirmed SMT condition only appears once that swing point clears the Swing Strength validation. By the time it shows up, the structure behind it is already settled.
Forming SMT gets there first. Confirmed SMT gets there with more behind it.
Using Correlated Asset Comparison
The correlated panel puts both instruments in view at once, so structural divergence doesn’t have to be pieced together by switching between two separate charts.
Divergence lines appear on both the primary chart and the correlated panel simultaneously, making it straightforward to follow how the two instruments diverge from each other as the structure develops.
With a second correlated instrument enabled, the primary instrument can be compared against two separate markets at the same time — which makes it possible to see whether a divergence is isolated to one relationship or shows up across both.
Using Filters and Kill Zones
Each filter narrows down when an SMT condition is allowed to register, rather than changing how SMT itself is detected.
The Volume Filter holds back SMT conditions during periods of weaker participation. The EMA, Higher Timeframe EMA, and VWAP filters require price to sit on a specific side of their respective reference line before a divergence qualifies.
Kill Zones restrict detection to selected time windows — Asia, London, New York, or a custom session — so SMT conditions outside those hours are ignored, regardless of how the filters above are configured.
Indicator Settings & Parameters
Full parameter reference, grouped by configuration area.
| Parameter | Description |
|---|---|
| SMT Settings | |
| Swing Strength | Sets how strictly highs and lows must be validated before they qualify as structural swing points. |
| Correlated Instrument | Selects the primary correlated instrument used for SMT divergence comparison. |
| Enable Second Correlated Instrument | Allows the primary instrument to be compared against an additional correlated instrument. |
| Second Correlated Instrument | Selects the optional second correlated instrument. |
| Enable Classic SMT | Enables detection of Classic SMT divergence. |
| Enable Hidden SMT | Enables detection of Hidden SMT divergence. |
| SMT Min Bars Distance | Sets the minimum number of bars required between the swing points used in an SMT structure. |
| Vertex Match Tolerance | Sets how closely swing points between correlated instruments must align in time. |
| SMT Strength Calculation Type | Selects whether SMT strength is measured in ticks or as a percentage.
|
| SMT Min Strength Ticks | Sets the minimum SMT strength required when strength is measured in ticks. |
| SMT Min Strength Percentage | Sets the minimum SMT strength required when strength is measured as a percentage. |
| Enable Forming SMT | Enables early-stage SMT detection before the related swing structure is fully confirmed. |
| Filters | |
| Enable Volume Filter | Enables volume-based filtering for SMT conditions. |
| SMT Volume Lookback | Sets the lookback period used for volume comparison. |
| SMT Min Volume Multiplier | Sets the minimum volume threshold required for SMT validation. |
| Enable HTF Filter | Enables Higher Timeframe EMA filtering for SMT detection. |
| Higher Timeframe Type | Selects the higher timeframe unit used for HTF filtering.
|
| Higher Timeframe Minutes / Hours / Days | Sets the specific higher timeframe value used by the HTF filter. |
| HTF EMA Period | Sets the EMA period used for higher timeframe filtering. |
| Enable EMA Filter | Enables EMA-based filtering on the current chart timeframe. |
| EMA Filter Period | Sets the EMA period used by the EMA filter. |
| Enable VWAP Filter | Enables VWAP-based filtering for SMT conditions. |
| Enable KillZones | Restricts SMT detection to selected trading session windows. |
| Enable #1–#4 Session | Enables individual Kill Zone sessions independently. |
| Label | Sets the display label for each Kill Zone session. |
| Start Session (EST) / End Session (EST) | Sets the active time window for each Kill Zone session. |
| Session Color | Sets the background color for each Kill Zone session. |
| Session Opacity | Sets the transparency of the Kill Zone background. |
| Alerts & Markers | |
| Enable Confirmed SMT Alert | Triggers an alert when a Confirmed SMT condition appears. |
| Enable Confirmed SMT Marker | Displays a marker on the chart when a Confirmed SMT condition is detected. |
| Enable Forming SMT Alert | Triggers an alert when a Forming SMT condition appears. |
| Enable Forming SMT Marker | Displays a marker on the chart when a Forming SMT condition is detected. |
| Alerts | |
| Enable pop up alert | Displays an on-screen popup when an SMT alert event occurs. |
| Enable sound alert | Plays a sound notification when an alert is triggered. |
| Alert sound file | Selects the audio file used for sound alerts. |
| Enable email alert | Sends an email notification when an SMT alert event occurs. |
| Email to | Defines the recipient email address for alert notifications. |
Frequently Asked Questions
SMT Basics
SMT divergence is an intermarket divergence concept used in ICT and Smart Money Concepts methodologies. The cTrader SMT Divergence Indicator detects this condition when one instrument makes a new high or low while a correlated instrument fails to confirm the same move.
Classic SMT is built around failed confirmation at highs or lows and is generally read as a possible reversal. Hidden SMT uses the inverted version of that relationship and is generally read as continuation rather than reversal.
A Forming SMT condition appears before the related swing point has passed Swing Strength validation. A Confirmed SMT condition only appears once that swing point clears validation. Forming SMT reacts earlier; Confirmed SMT reacts later, with more structure behind it.
When a Forming SMT is later confirmed, its marker is replaced by the Confirmed SMT. When the swing does not pass validation, the Forming marker stays on the chart while Forming SMT markers are enabled, rather than disappearing retroactively. Forming SMT still represents developing structure, while Confirmed SMT requires fully validated swing points.
Features & Configuration
The cTrader SMT Divergence Indicator combines configurable Swing Strength, a timing tolerance between the two instruments’ swings (Vertex Match Tolerance), separate Forming and Confirmed states, multiple qualification filters, and support for a second correlated instrument — alongside a dedicated panel for visually comparing the correlated asset against the primary chart.
Yes. A second correlated instrument can be enabled in addition to the primary one, allowing the analyzed instrument to be compared against two separate markets at the same time.
It controls how far apart in time two swing points are allowed to be while still counting as a match. The correlated instrument’s swing does not need to form on the exact same bar — the indicator checks within a configurable number of bars on either side.
Yes. The Kill Zones filter can restrict SMT detection to Asia, London, New York, or a custom session window, so conditions outside those hours are ignored.
System Requirements & Installation
What you need to run the indicator, how to download and install it in cTrader, and how the license works.
System Requirements
- Platform
- cTrader for Windows
- Operating system
- Windows 10 or Windows 11
- Instruments
- Forex pairs, indices, metals, CFDs and other symbols available from your broker in cTrader
- Data
- Your broker’s price feed in cTrader, including the correlated instruments you select
Not available on cTrader Web or Mobile. cTrader runs custom indicators only in its desktop applications; Web and Mobile support built-in indicators only.
License Terms
- Lifetime License
- This indicator only, 1 live and 1 demo account, one-time payment, free updates included.
- All-Access Subscription
- All indicators and trade copiers, billed monthly, cancel anytime, updates included while the subscription is active.
- Free trial
- 5 days on the subscription plan. If not cancelled, the subscription starts automatically.
- License binding
- Linked to your email and to your cTrader trading accounts: one live account and one demo account.
- Computers
- Not restricted. The license is linked to your trading accounts, not to a specific computer.
Installation
- Get access
Start the free trial, subscribe, or buy a lifetime license on this page.
- Download
The indicator is not sent by email. Open (top right of this page) and enter the email you used for your trial, subscription or purchase. The indicator file (.algo) downloads to your computer.
- Install in cTrader
With cTrader installed, double-click the downloaded .algo file, or right-click it and choose
Open with → cTrader. cTrader installs the indicator and adds it to the Indicators tab of cTrader Algo. - Add to a chart
Open a chart, click the Indicators icon, type the indicator name and select it. Set the parameters and click OK.
- Activate the license
In the indicator parameters, enter the same email. On first activation, the license is linked to that email and to the trading account cTrader is logged into.
Updating: When a new version is released, download it again through and double-click the new .algo file to replace the installed version.
Installation questions? Contact support, Monday to Friday.
Related Products
"Best Seller" and "Trending" reflect Nordman Algorithms sales and usage data, January–September 2026.
Disclaimer — Software Use & Risk Disclosure
Nordman Algorithms is a trade name of Nordman Algorithms OÜ (Reg. No. 14435535), registered in Tallinn, Estonia.
Software Use
Software Nature & User Responsibility — Nordman Algorithms provides algorithmic software tools for technical analysis. Nordman Algorithms is not a financial advisor and is not liable for any losses. All trades conducted based on the software’s output are executed at the user’s sole discretion and risk.
Visual Markers & Signal Disclosure — This software may display visual markers (such as arrows, dots, or alerts) when predefined mathematical conditions are met. These markers are provided for educational and analytical purposes only, must not be interpreted as financial guidance, and do not constitute a recommendation to buy, sell, or hold any financial instrument. Users must independently validate all visual cues within their own trading methodology.
No Financial Advice — Nordman Algorithms does not provide discretionary trading signals, investment advice, or managed signal services. Our software represents a mathematical visualization of historical and real-time data. The appearance of a visual marker does not guarantee a profitable trade or predict future market behavior.
Read the full Terms of Service →Risk Disclosure
Trading Risk Warning — Forex, CFDs, futures, options, and other leveraged financial instruments involve significant risk. Risk capital is money that can be lost without jeopardizing financial security. Only risk capital should be used for trading. Past performance is not indicative of future results. An investor could potentially lose all or more than the initial amount committed.
ESMA Risk Warning — Financial instruments, especially those involving leverage such as CFDs and Forex, are complex and carry a high risk of rapid financial loss. Our software provides analytical outputs and visual markers based on predefined mathematical conditions and does not mitigate or reduce inherent market risks. You should carefully consider whether you understand how leveraged financial instruments work and whether you can afford the high risk of losing your capital.
CFTC Rule 4.41 — Hypothetical or simulated performance results have inherent limitations. Unlike actual performance records, simulated results do not represent real trading. Because trades have not actually been executed, these results may under- or over-compensate for the impact of market factors such as liquidity. Simulated results are also subject to the benefit of hindsight. No representation is being made that any account will achieve profits or losses similar to those shown.
Read the full Risk Disclosure →Trademark Notice — cTrader is a registered trademark of Spotware Systems Ltd. Nordman Algorithms is an independent software developer and is not affiliated with, sponsored by, or endorsed by Spotware Systems Ltd. References to cTrader are used to indicate software compatibility.
Need a different setup?
We can customize this indicator to your specifications: add new functions, modify the logic, refine visuals, or integrate it with other cTrader tools. We also convert indicators into cBots with trailing stops, position parameter controls, execution filters and rule-based automation built to your technical specifications.