Nordman Algorithms · Technical review by Alexei Kuntysh, founder
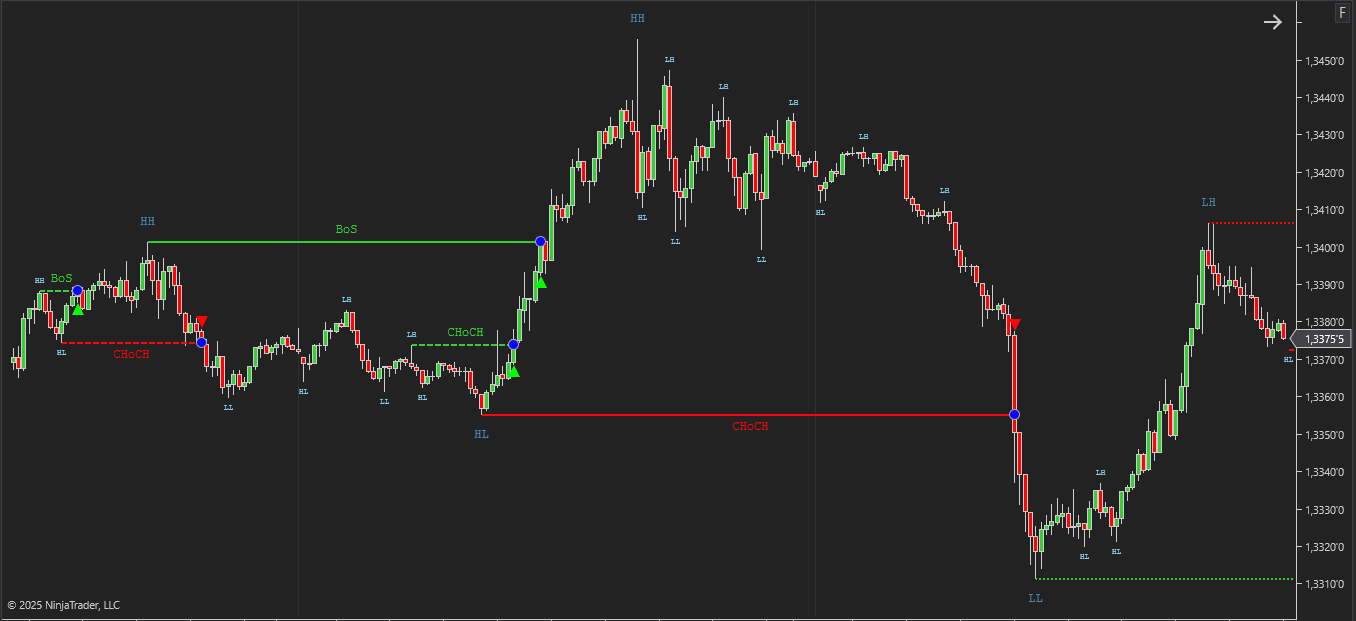
The rally in the middle of the chart above carries two labels from the same indicator. A few bars into the move a dashed green line reads CHoCH, a change of character, which says the trend has just turned. A little higher a solid green line reads BoS, a break of structure, which says the trend never stopped. The indicator is counting two sizes of swing at once, and the two sizes disagree about whether the trend ever turned. When two structure indicators on one chart contradict each other, the cause is usually the same, a different idea of what counts as a swing.
Everything here is built on swings. A swing high is a peak with lower bars on both sides, and a swing low is a dip with higher bars on both sides. In an uptrend each peak is higher than the one before, which traders write as HH for a higher high, and each dip is higher too, an HL or higher low. In a downtrend it’s the other way round, with lower highs (LH) and lower lows (LL).
Both labels describe the same event, price breaking the last swing. What differs is the direction of that break compared with the trend.
The textbook version on a NinjaTrader 8 chart looks like this.
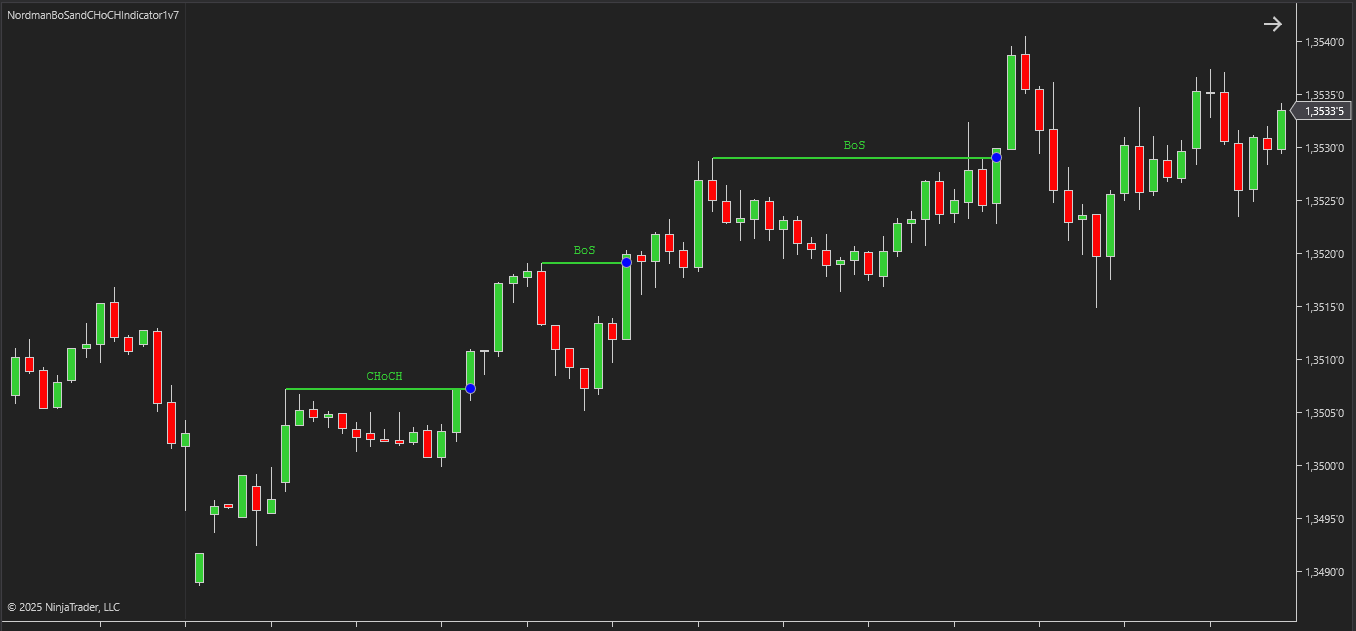
On the left price is falling. It bottoms just under 1.3490 and then goes sideways for a while. The first green line, near 1.3507, is the CHoCH, because it’s the first time price breaks a high after a run of falling highs. The next two lines say BoS, near 1.3519 and 1.3529, and each one is a new high breaking the high before it.
A CHoCH opens a new direction and a BOS keeps it going, provided everyone counts the same swings.
To decide what counts as a swing, most indicators use a size setting: how many bars a peak needs on each side before it counts. In ours it’s called Swing Strength. A low value turns every small wiggle into a swing, while a high value keeps only the bigger turns.
Our indicator also sorts swings into two kinds and can show either kind or both. Strong swings are the major turning points, and weak swings are the minor pullbacks between them.
The chart at the top of this article shows both kinds at once, weak swings with small labels and dashed lines and strong swings with large labels and solid lines. In the middle of the chart price drifts down in small steps and then pushes up hard. The weak swings see a short downtrend that has just broken, so they print a dashed green CHoCH. The strong swings still see an uptrend, because the higher low is holding, and when price clears the big high a few bars later they print a solid green BoS.
Both labels are correct because they answer different questions. The weak swings ask whether the last small move turned, and the strong swings ask whether the main trend is still intact. The same thing happens on the way down, as this drop from a different chart shows with both kinds of swings switched on.
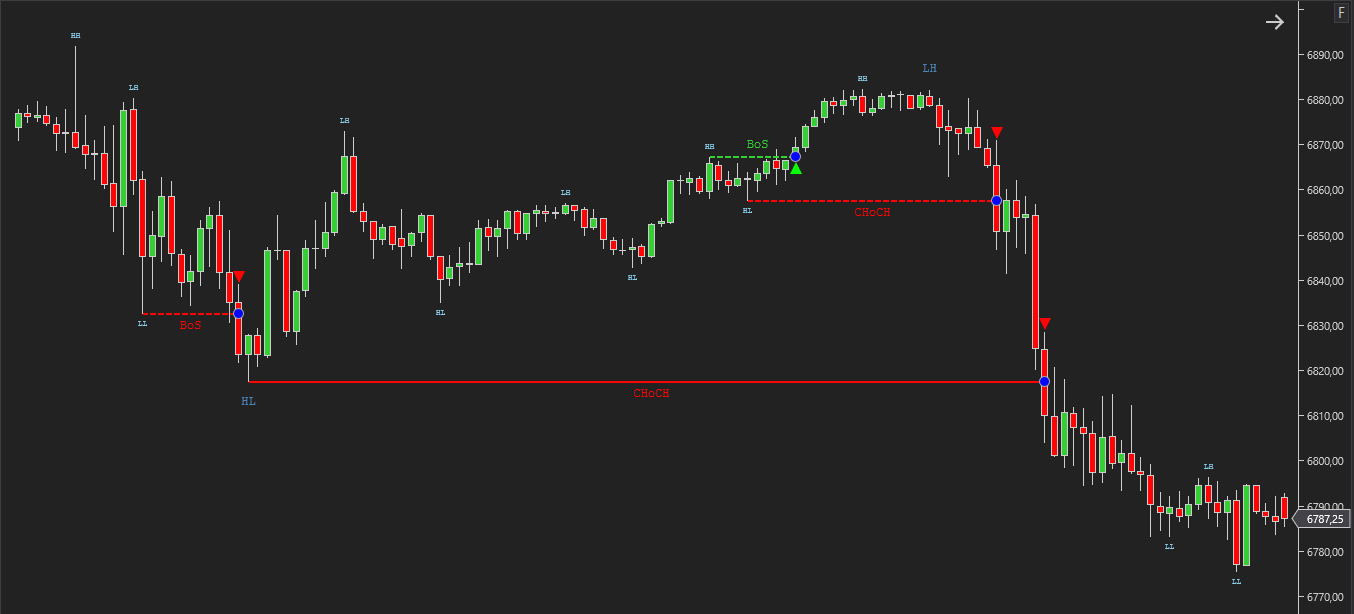
The dashed red CHoCH from the weak swings sits near 6857, and the solid red CHoCH from the strong swings sits near 6817, about 40 points lower on the same fall. The weak swings gave the earlier warning on this drop. On a pullback that comes to nothing they give the same kind of warning, and the strong swings stay quiet.
The charts in this article come from our NinjaTrader Market Structure (BOS & CHOCH) Indicator. It can draw strong and weak swings together or one at a time.
A CHoCH is a reversal signal, so if you trade it, you’re turning your position around, and that’s where small swings get expensive. In June a member of the NinjaTrader forum asked how to reverse trades without losing money in sideways markets. The problem fit in one line: “Reversal trades can become extremely expensive during consolidations and choppy market conditions” (MannyVill, NinjaTrader forum, Jun 2026).
One reply questioned the setup rather than the reversal: “If you have to keep reversing, do you, in fact, have a proven entry location?” (QuantKey_Bruce, NinjaTrader forum, Jun 2026).
That reply is right, and no swing setting fixes an entry that has no edge. What the setting changes is how often the indicator asks you to make the decision. In a sideways session small swings flip direction all the time and print a CHoCH on each flip, so a rule of “reverse on every CHoCH” keeps you reversing all day. Big swings print far fewer CHoCH lines in the same range, at the price you saw on the drop above, where the strong swings called the turn 40 points later.
We’d choose the swing size for the move you actually trade and then leave it alone. A setting changed after every losing day will always find a way to agree with you.
Swing size is the big setting, but two smaller ones also move the label, and they decide which bar it lands on.
The first is whether a wick through the level is enough, or whether a bar has to close beyond it. Below is the same bearish BoS with each option.
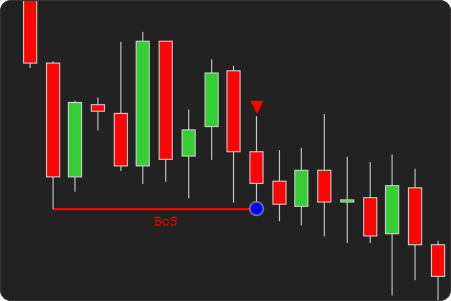
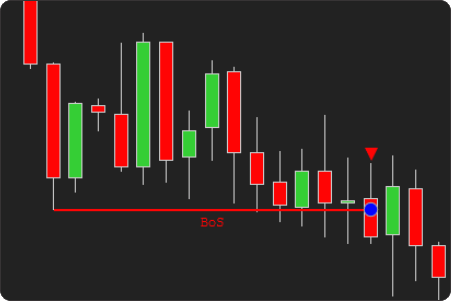
On the left the break counts on the wick, so the marker sits on the bar that first dips through the line. On the right the break needs a close, and the marker comes five bars later, on the first bar that actually closes below. The level and the move are the same, but the bar is different, and if you enter on the label, so is your entry price. Wick confirmation reacts first and also reacts to a quick poke through the level that closes back inside, which close confirmation ignores.
The second setting is a minimum distance, so a break only counts if price clears the level by enough. You can set it in ticks, points or percent.
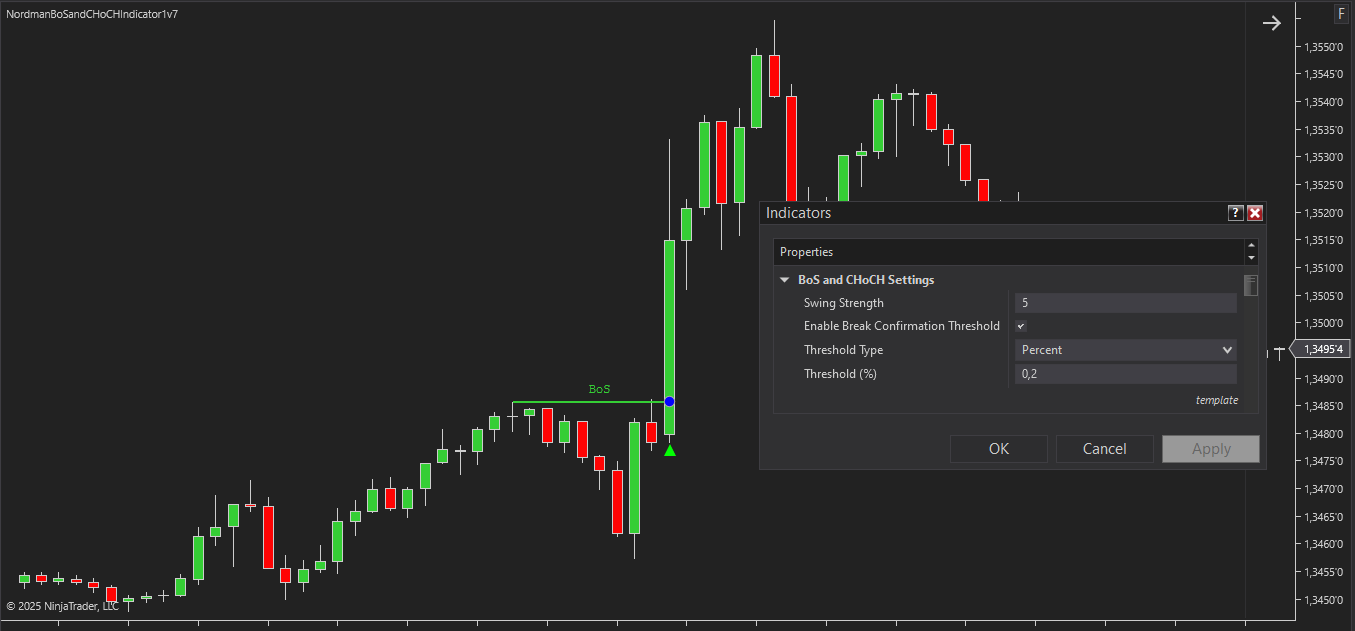
In this setup Swing Strength is 5 and the threshold is 0.2 percent. With the level near 1.3486, that’s about 27 pips, so the break only counts once price trades around 1.3513, which the long green candle does in one go. On ES near 6800 the same 0.2 percent would be about 14 points, so a percentage that suits one market can be far too wide or too tight for another. Ticks or points are easier to reason about when you trade a single instrument.
There’s a third name you’ll meet, MSS or Market Structure Shift. Many traders use it as another word for CHoCH, but in our tools the two mean different things. On small swings an MSS and a CHoCH can land on the same bar. What differs is the job each tool does. The BOS and CHoCH indicator follows the whole structure and labels both continuations and reversals. The MSS indicator marks only the turns, built to catch them early, with its own filter for how many swings the previous move must have had.
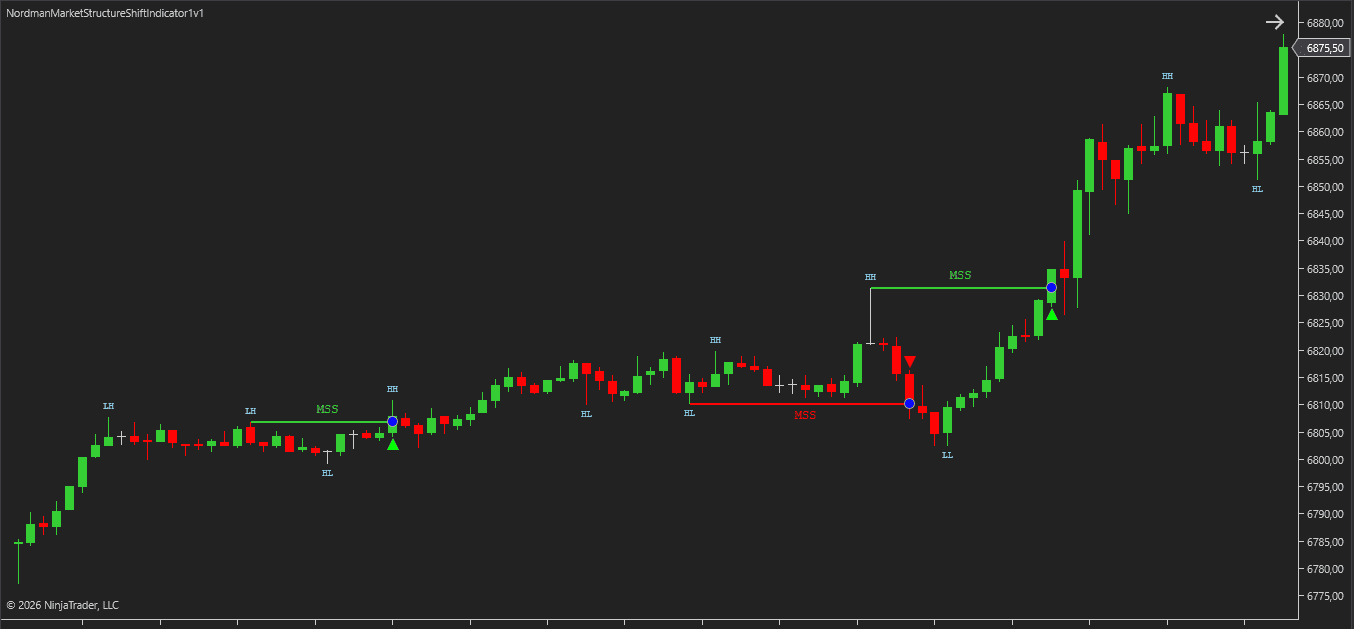
Overall this market climbs from about 6785 to above 6870. Inside that climb the MSS indicator prints three shifts: up near 6807, down near 6810 and up again near 6831. The first two sit three points apart, which is the kind of flip-flop small swings produce on their own.
On its own an MSS can be that noisy, so traders tend to read it with context, most often a liquidity sweep. A sweep tells you a level was taken, and an MSS right after it tells you the short-term flow turned against the side that took it. We showed that sequence on a live ES chart in What Are Liquidity Sweeps and Why They Matter.
| BOS | CHoCH | MSS | |
|---|---|---|---|
| What breaks | The last swing in the trend’s direction | The last swing against the main trend | A recent swing against the local move |
| What it suggests | The trend continues | The trend may be turning | A short-term turn |
| Scale | Whatever swing size the indicator uses | Local swings | |
| What it doesn’t promise | That the next push goes as far | That a new trend has started | That the main trend changed |
| What changes the label | Swing size, wick or close confirmation, minimum break distance | ||
Before acting on a BOS or CHoCH from any indicator, by any vendor, check three things. Find the swing size it uses and whether that matches the move you trade, see whether the label printed on a wick or on a close, and look for a minimum break distance. Without that last one, a single tick through the level counts as structure.
When two indicators disagree on your chart again, the quickest way to settle it is to find out which swings each one is counting, rather than to add a third indicator and take a vote.
It suits traders on NinjaTrader 8 who already think in highs and lows and want BOS and CHoCH marked by one fixed rule rather than by eye. It shows strong and weak swings together, lets you choose wick or close and a minimum break, and exposes alerts and plots that strategy builders such as BloodHound and BlackBird can read.
A BOS or CHoCH describes a break that has already happened. Without your own rules for entries and exits, a structure label is a description of the past few bars and says nothing certain about the next ones.
The indicator is part of the Nordman subscription at €25 a month, with five free days to try it, or you can buy a lifetime licence for this indicator alone at €175 for one PC. A short overview video shows it on a live chart. If you also want fair value gaps marked after each break, there’s the NinjaTrader BOS & CHOCH and FVG Indicator.
See the Market Structure (BOS & CHoCH) Indicator →
Need something custom built? We develop automation to order → NinjaTrader developers
A BOS is a break of the last swing in the trend’s direction, so the trend continues. A CHoCH is a break of the last swing against the trend, so the trend may be turning. Which label a move gets depends on which swings the indicator counts.
They are probably counting different swings. Small swings see small trends, so a push that ends a short pullback is a CHoCH for them. Big swings see the main trend, so the same push is a BOS. Wick or close confirmation and a minimum break distance can also move the label.
Many traders use the two words for the same thing. In our indicators they differ. A CHoCH is a break against the main structure, a sign the bigger trend may be turning. An MSS is a local reversal pattern, built to catch a turn early.
It depends on how much a false break costs you. Wick confirmation is faster and gets fooled more often by a quick poke through the level. Close confirmation is slower and filters more of those.
Nordman Algorithms provides software infrastructure for trade automation and does not offer financial advice, trading signals, or managed trading services. Visual markers are produced when predefined mathematical conditions are met and do not constitute a recommendation to buy, sell, or hold any instrument. This article is for informational and educational purposes only. Chart screenshots illustrate indicator behaviour on historical data and are not a record of trading results. Prices in the text are read from the charts shown. Forum quotations are reproduced verbatim from public threads for illustration and do not constitute endorsement. Trading leveraged instruments such as Forex, CFDs and futures carries a high level of risk and may not be suitable for all investors. Only risk capital should be used. Full Risk Disclosure: https://www.nordman-algorithms.com/risk-disclosure/