CVD Divergence Concept Explained
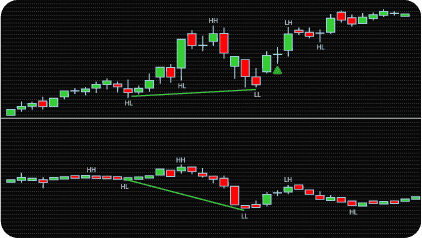
The NinjaTrader CVD Divergence Indicator detects divergence between price and Cumulative Volume Delta (CVD) — a volume analysis tool that tracks the difference between buying and selling volume over time.
Standard divergence indicators compare price structure against an oscillator such as RSI or MACD. The CVD Divergence Indicator uses a different source — the cumulative buying and selling volume imbalance. When price and CVD stop confirming each other structurally, a divergence condition appears.
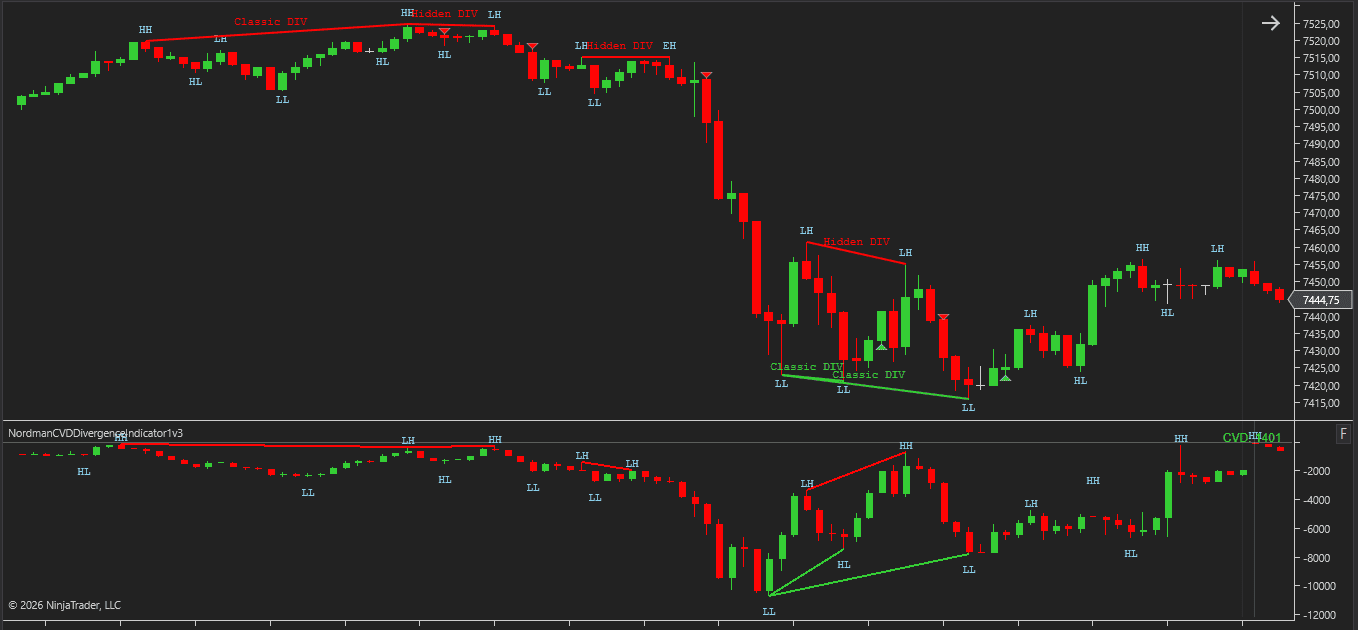
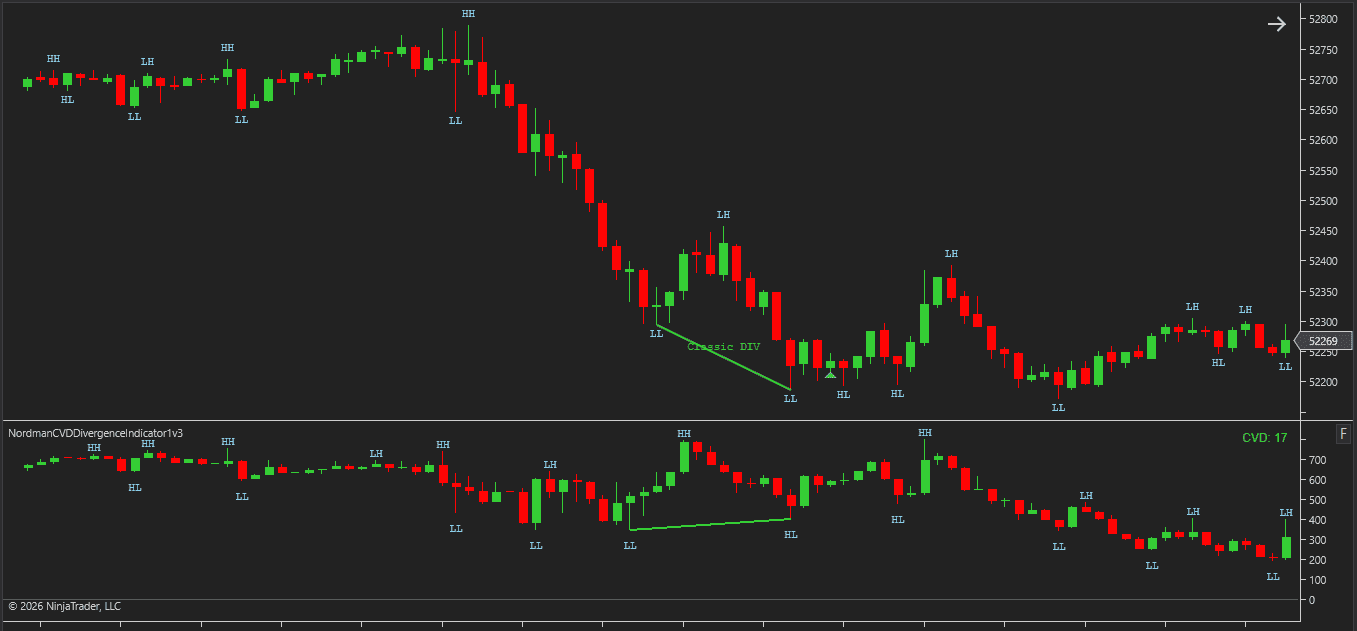
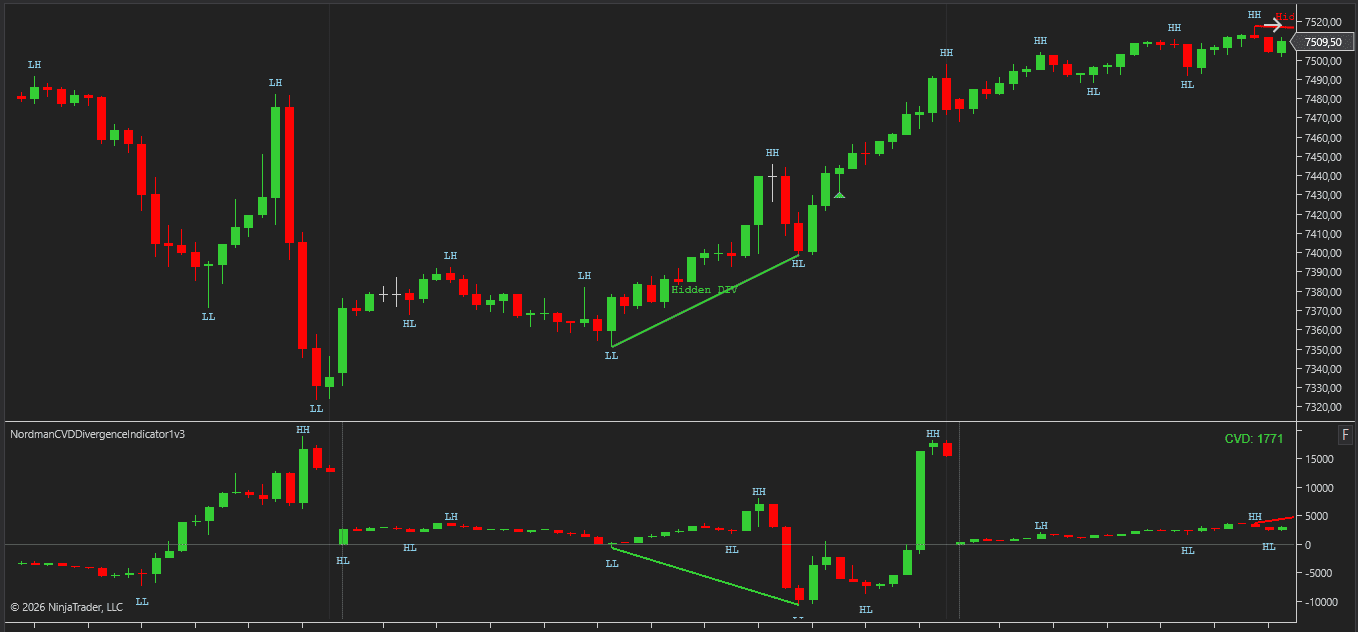
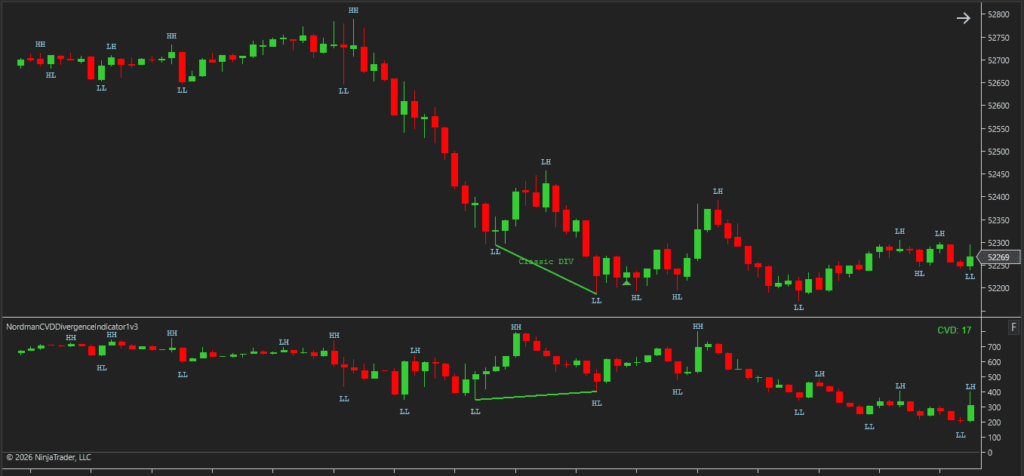
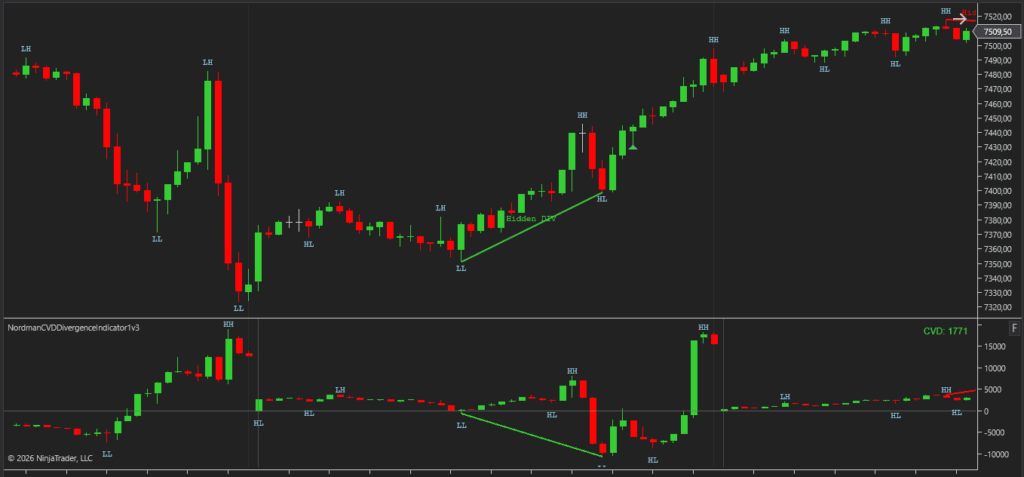
Classic CVD Divergence occurs when price forms a new structural extreme — a higher high or lower low — while CVD fails to confirm that move. Hidden CVD Divergence uses the opposite relationship: CVD extends to a new extreme while price does not follow. Classic divergence is generally read in a reversal context; Hidden divergence is generally read as continuation.
Because the divergence source is volume-based rather than momentum-based, CVD Divergence captures a different kind of structural conflict from traditional oscillator divergence — one rooted in the classified buying and selling volume imbalance.
NinjaTrader CVD Divergence Indicator — Key Features
CVD Divergence Detection — Classic & Hidden
The NinjaTrader CVD Divergence Indicator detects both Classic and Hidden divergence between price swings and the CVD series.
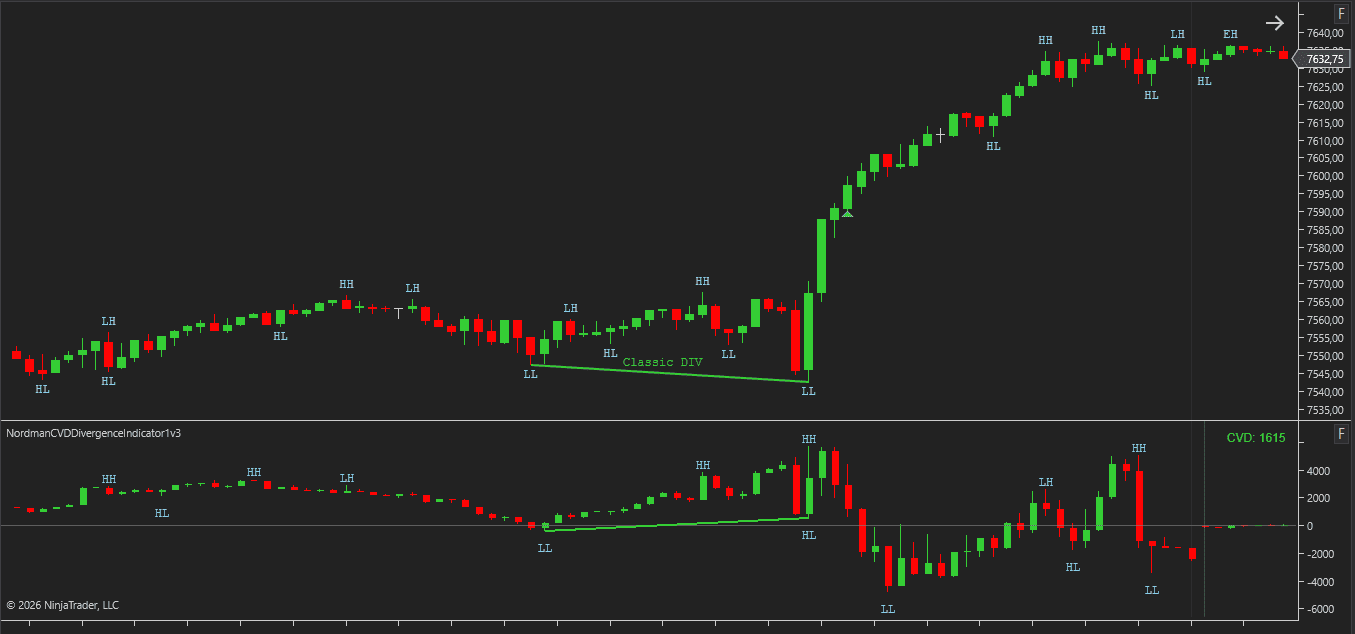
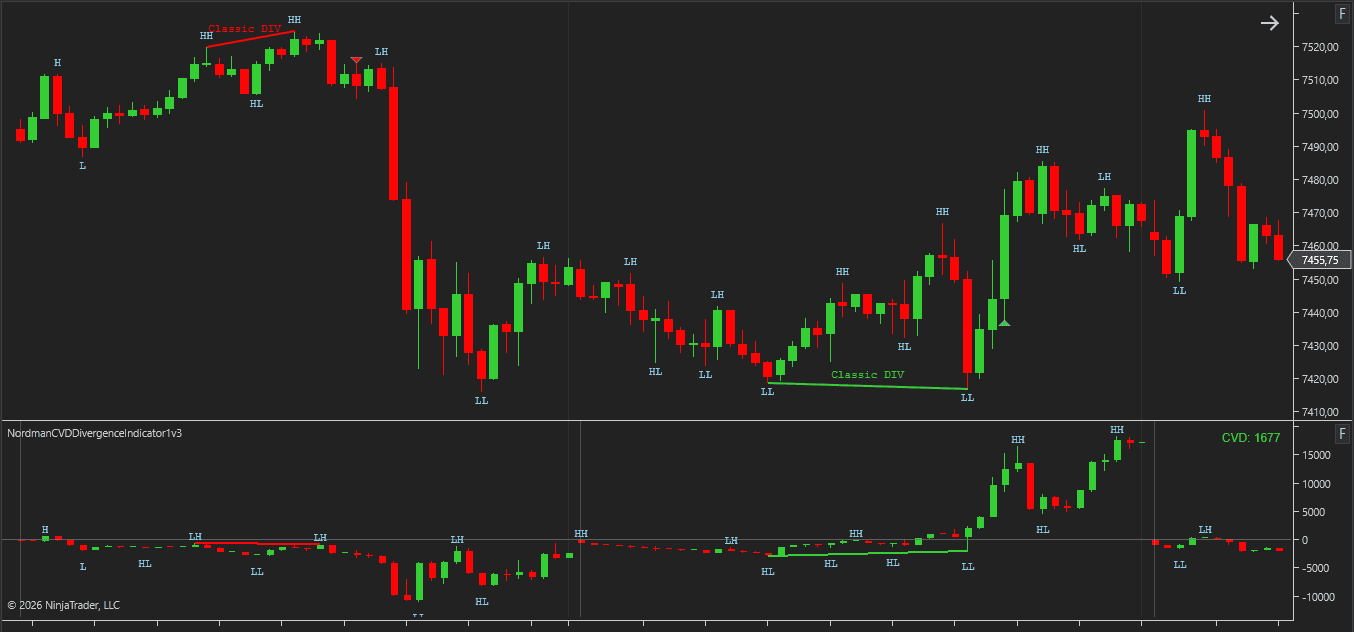
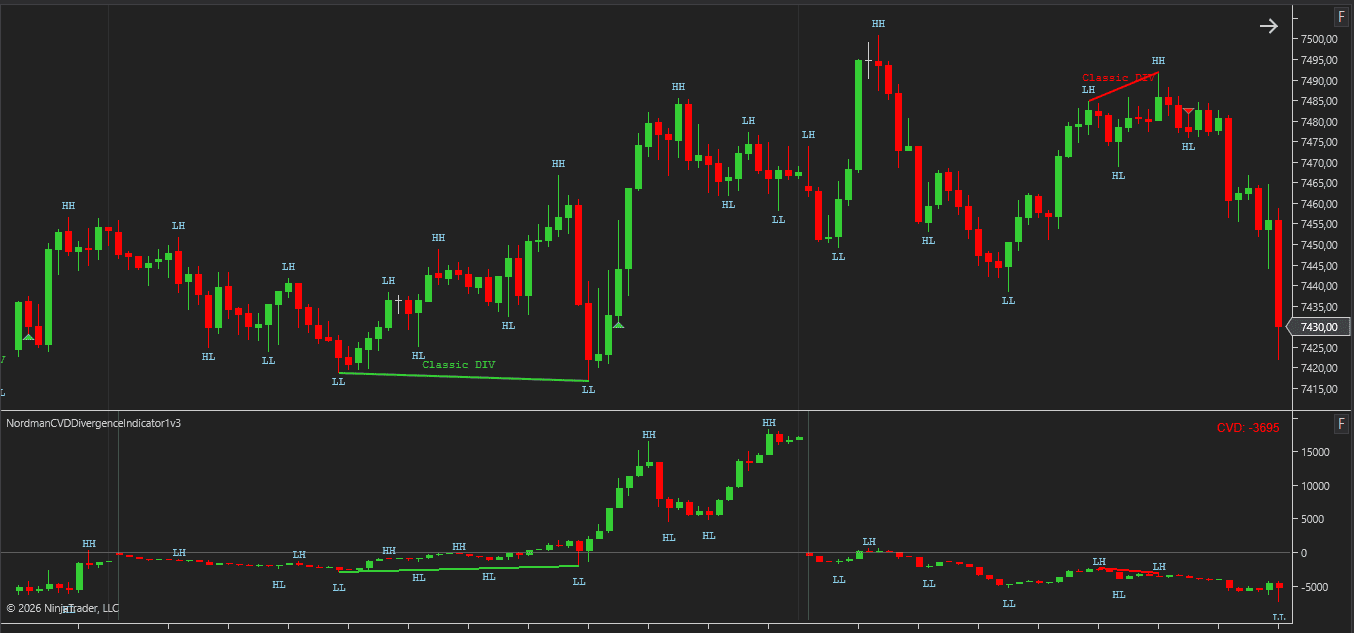
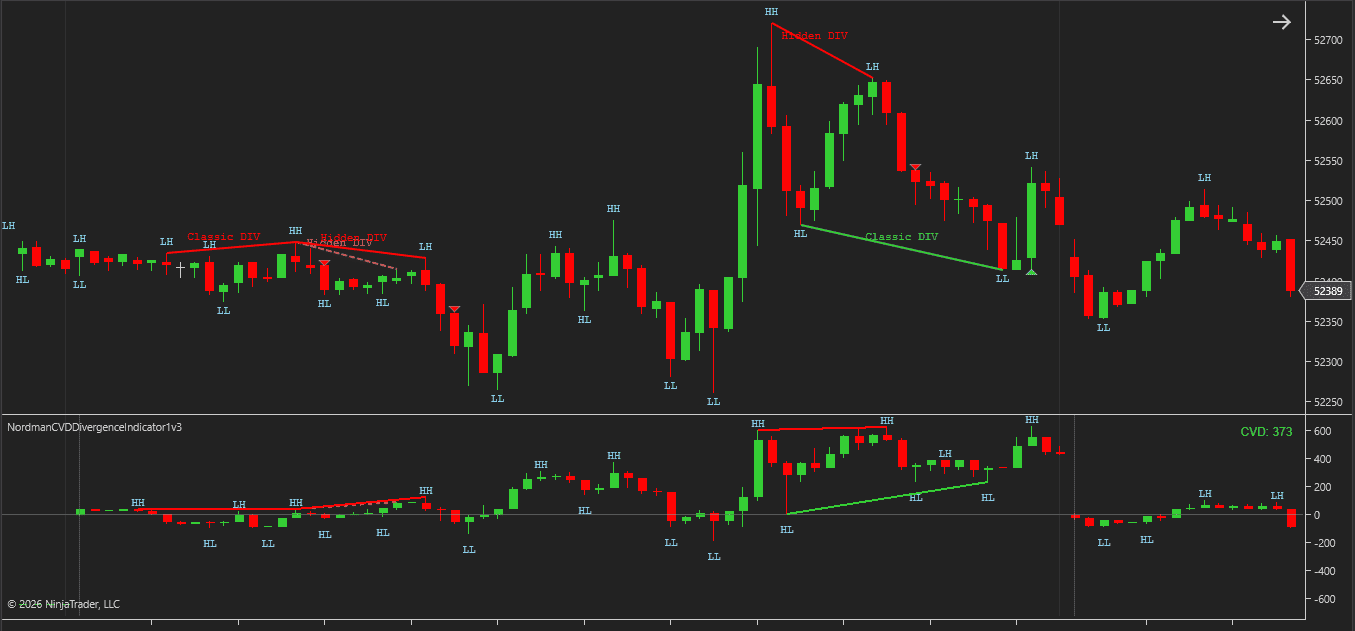
In Classic CVD Divergence, price makes a new structural high or low while CVD fails to confirm the same move. A bearish Classic condition appears when price prints a higher high and CVD does not reach a corresponding higher high. In a bullish Classic condition, price prints a lower low while CVD does not confirm it.
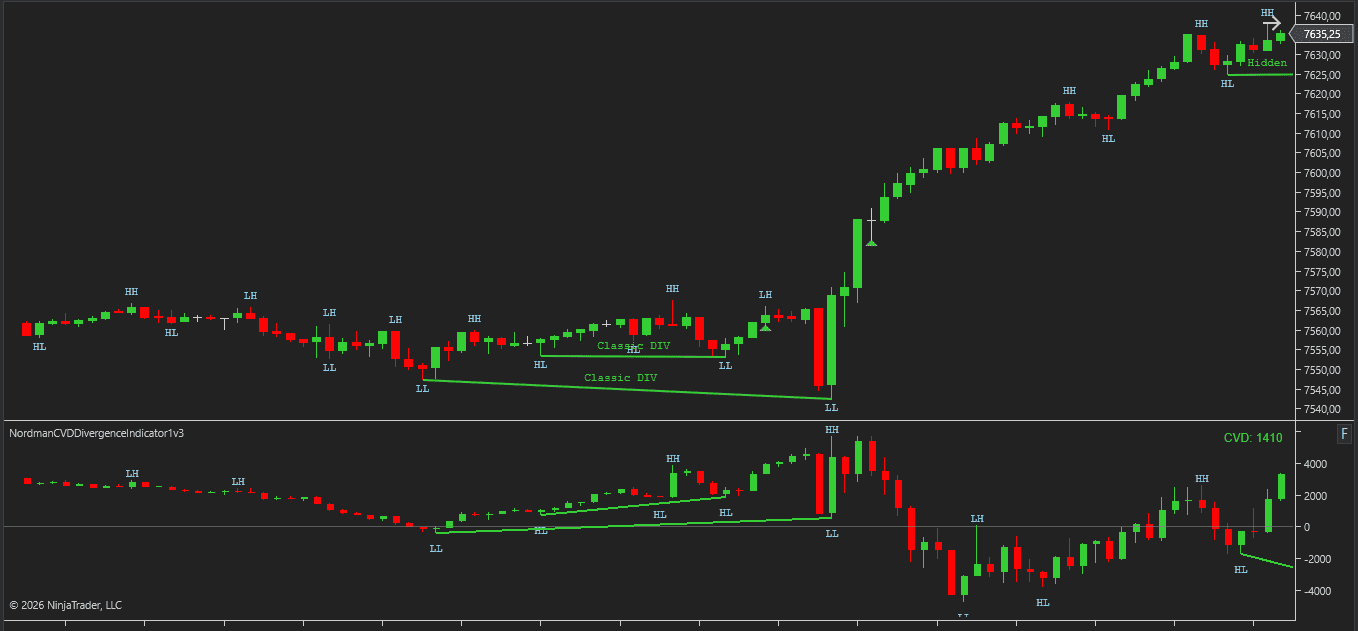
In Hidden CVD Divergence, the relationship is inverted. CVD makes a new extreme while price does not follow. Bearish Hidden divergence forms when CVD reaches a higher high that price does not confirm. Bullish Hidden divergence mirrors this at lows.
Both Classic and Hidden detection can be enabled independently, and each supports bullish and bearish conditions separately.
-
-
Classic CVD Divergence
-
-
Hidden CVD Divergence
Forming & Confirmed Divergence States
The NinjaTrader CVD Divergence Indicator supports two divergence states: Forming and Confirmed.
Forming divergence appears before the associated swing structure is fully confirmed. Confirmed divergence appears only after all involved swing points pass Swing Strength validation.
| State |
Detection Timing |
Advantages |
Considerations |
| Forming Divergence |
Detected before swing confirmation is complete. |
Potential divergence conditions become visible earlier, allowing developing structures to be monitored before full swing confirmation. |
Based on an unconfirmed swing structure. If confirmation does not occur, the divergence may no longer satisfy the conditions required for Confirmed divergence, but a registered Forming marker remains on the chart. |
| Confirmed Divergence |
Detected only after all required swing points have been confirmed. |
Based on completed swing structures that satisfy the selected validation rules. |
Divergence markers appear later because confirmation requires additional bars to complete the swing structure. |
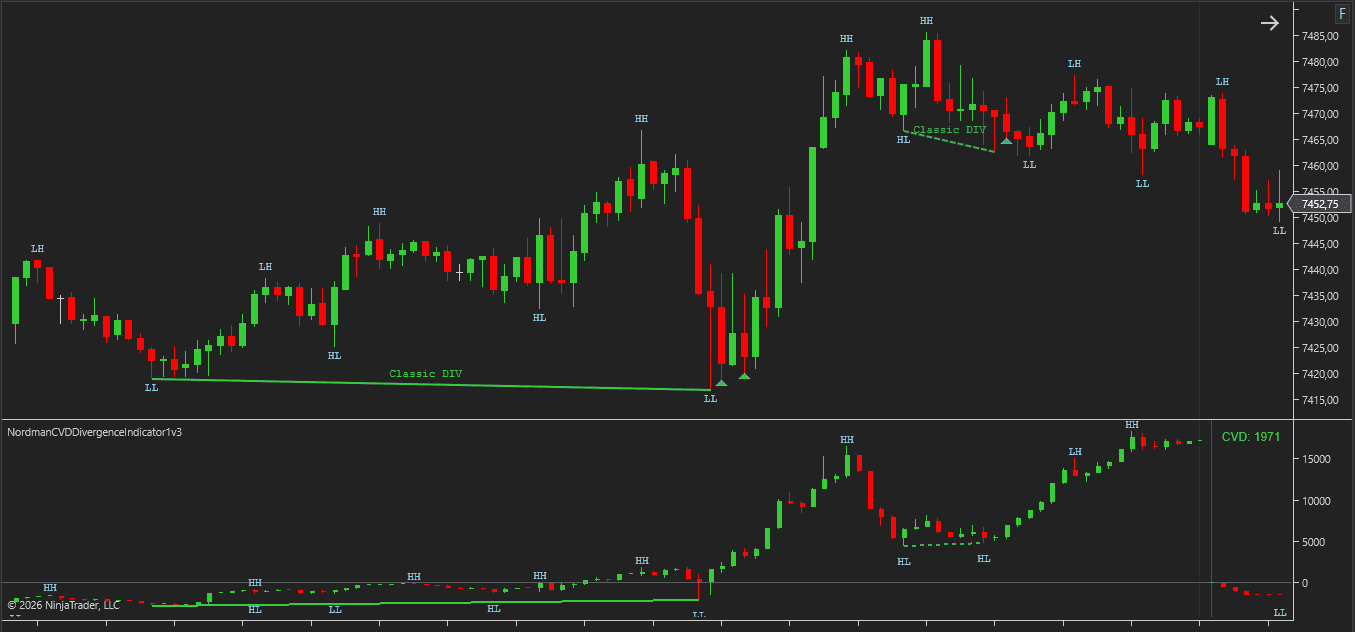
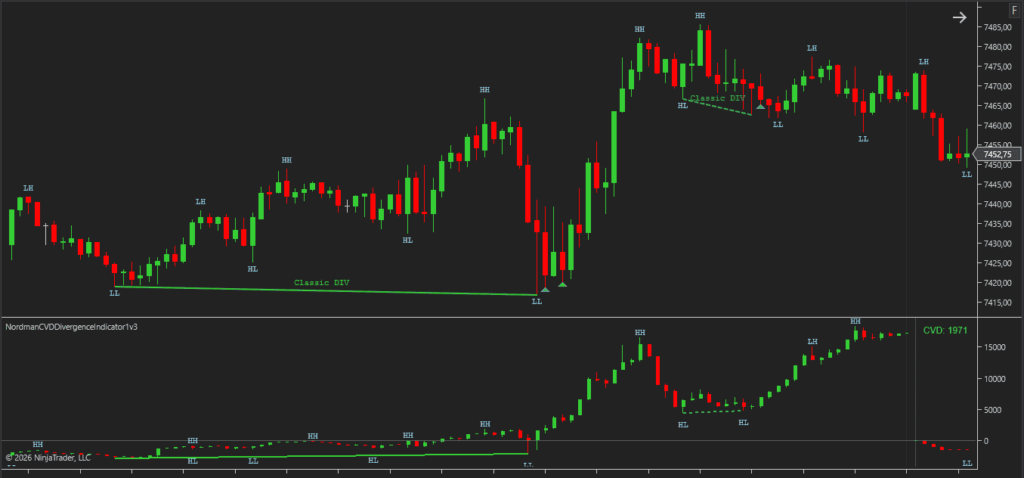
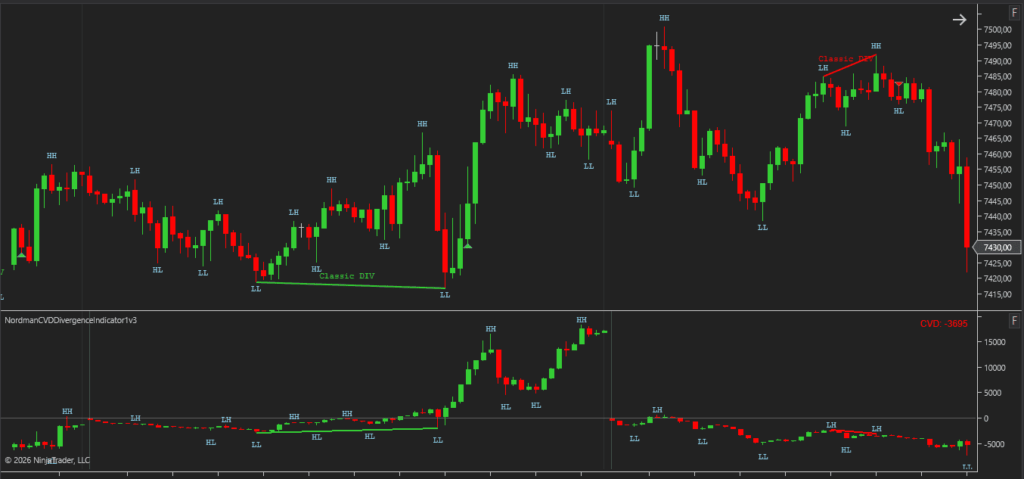
Forming and Confirmed divergences are also visually distinguished on the chart by line style. Forming divergence is displayed with a dashed line, Confirmed divergence with a solid line — making it easy to separate developing conditions from fully validated structures at a glance.
Forming divergence detection can be enabled or disabled independently. Confirmed divergence remains part of the core detection logic, while alerts and markers can be configured separately for each state.
-
-
Forming and Confirmed CVD Divergence
-
-
Confirmed CVD Divergence Only
Divergence Validation & Filtering
Detection quality is controlled by structural validation settings that define what counts as a valid divergence.
Swing Strength sets how strictly highs and lows must be validated before they qualify as structural swing points. Higher values require more developed swings; lower values make detection more reactive.
Vertex Match Tolerance controls how far apart in time the price swing and the CVD swing are allowed to be while still counting as a matching pair. The two series do not need to peak on the same bar — the indicator matches swings within a configurable bar window.
Min Bars Distance / Max Bars Distance define the minimum and maximum number of bars allowed between the two swing points that form a divergence. Structures that are too short or too wide are excluded.
Min Price Difference sets a minimum price movement between the two price swing points — measured in ticks or percentage. Divergences between swings that are too close in price are filtered out.
Min DIV Gap sets a minimum difference between the two CVD swing values — measured as an absolute value or percentage. This filters out divergences where the gap between the two CVD swings is too small to qualify.
Max Lookback Swings optionally limits how many historical swings the algorithm considers when searching for divergence pairs.
CVD Configuration
The indicator builds a Cumulative Volume Delta series and uses it as the basis for divergence detection. Its calculation method and accumulation behavior are configurable.
Delta Type defines how volume is classified into buying and selling components. Up Down Tick uses tick direction and works with standard tick data. Bid Ask uses bid/ask transaction data and requires Tick Replay to be enabled in the Data Series settings along with bid/ask tick data from your data provider.
Accumulation Period defines how long the CVD series accumulates before resetting: Session, Day, Week, Custom Session, Fixed Bars Count, or Unlimited.
Reset Mode applies to Session, Day, and Week accumulation. Auto follows the selected period boundary. Manual Time resets the CVD at a specified time and, for Week accumulation, a selected day of the week.
DIV Search Period defines the time window within which the divergence algorithm searches for swing pairs. This is separate from the CVD accumulation period — the two can be set independently.
Minimum Trade Size excludes trades below the specified size from delta calculations.
Display Modes
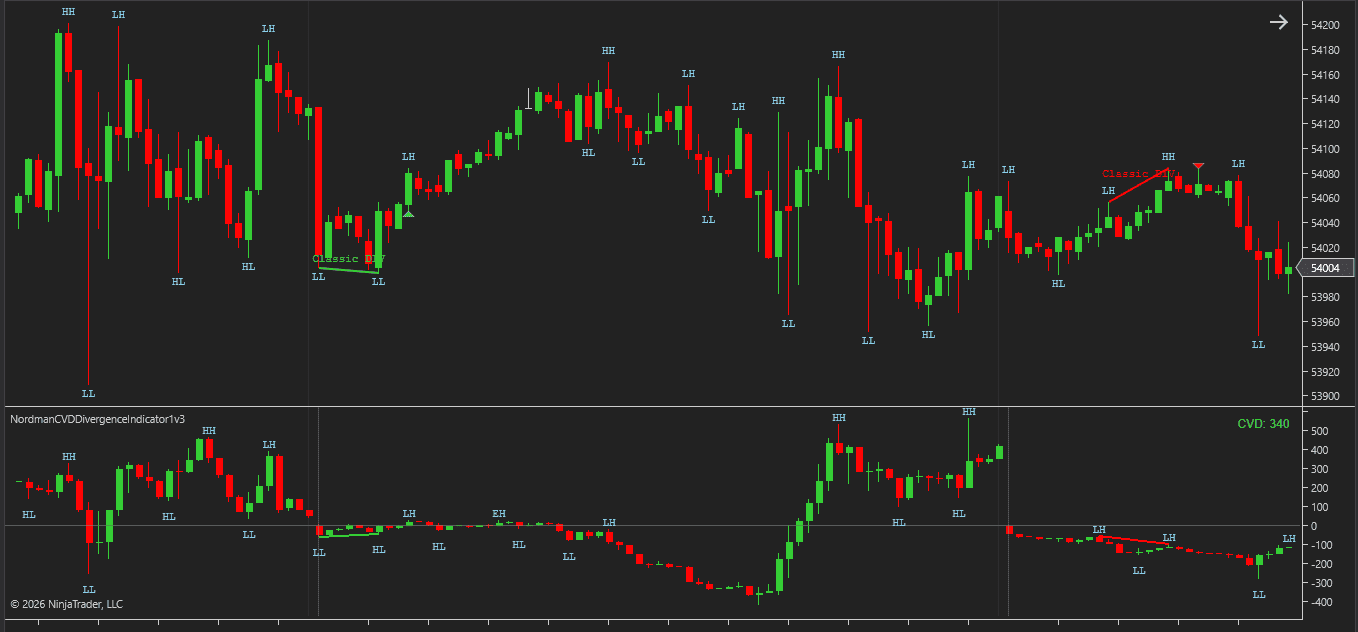
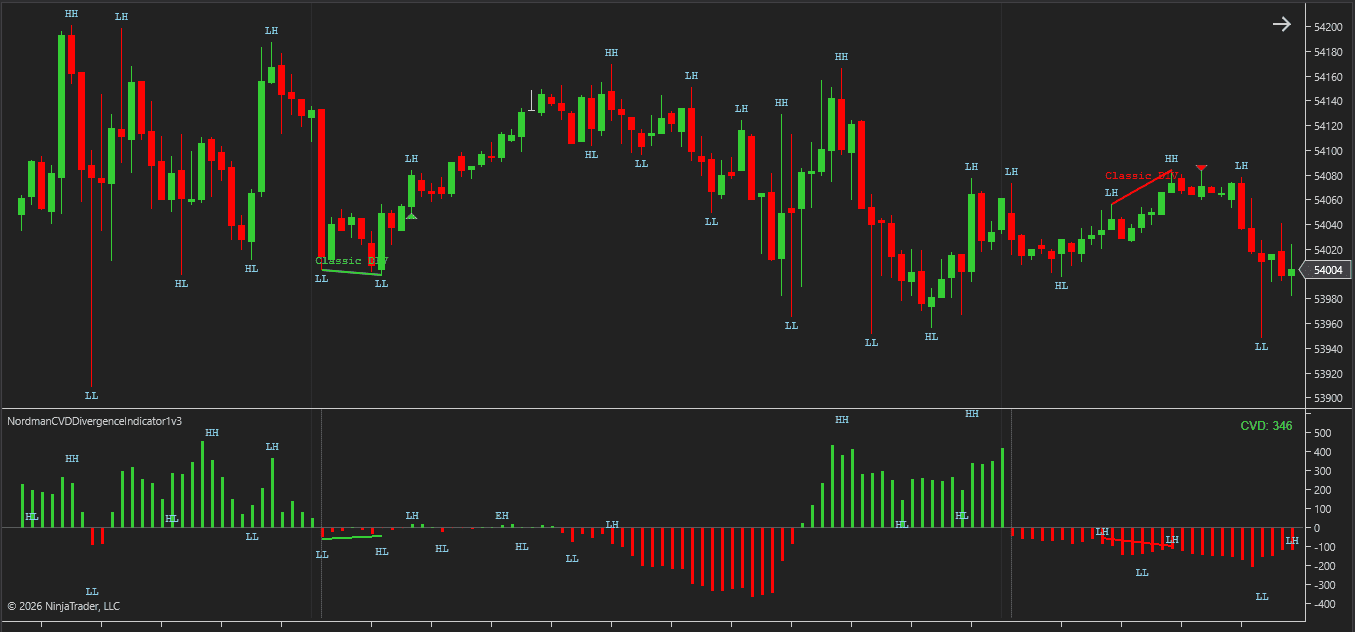
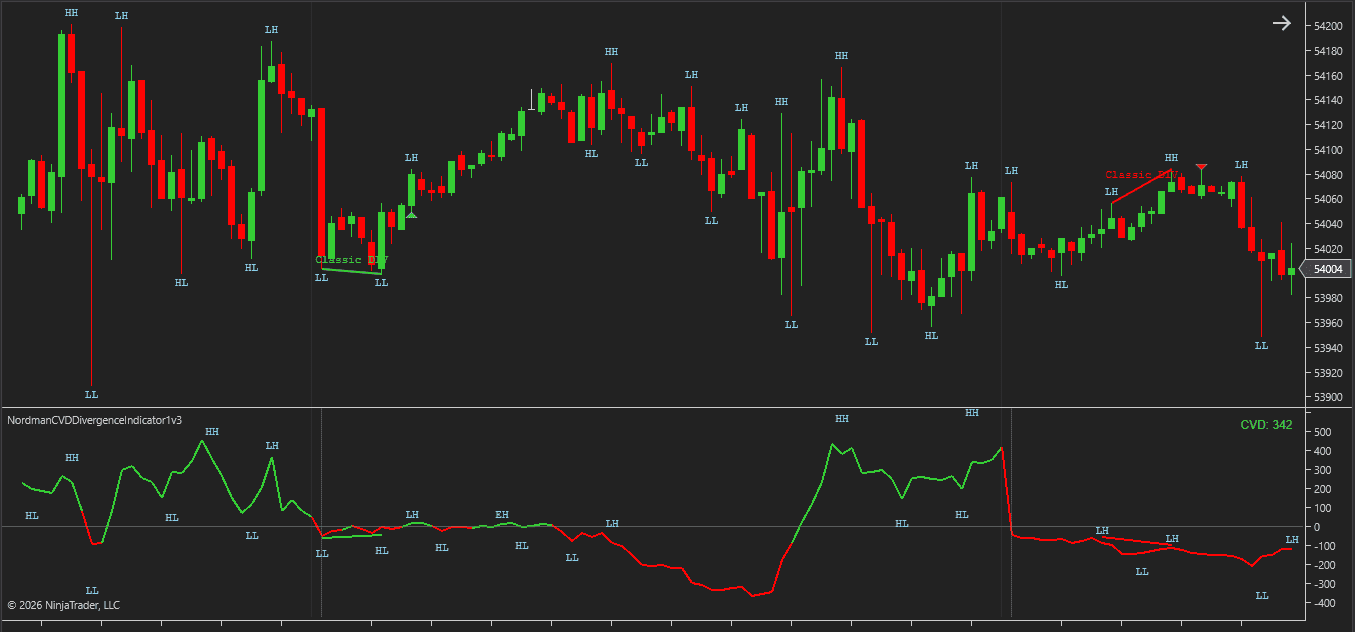
The CVD series can be visualized in three display modes.
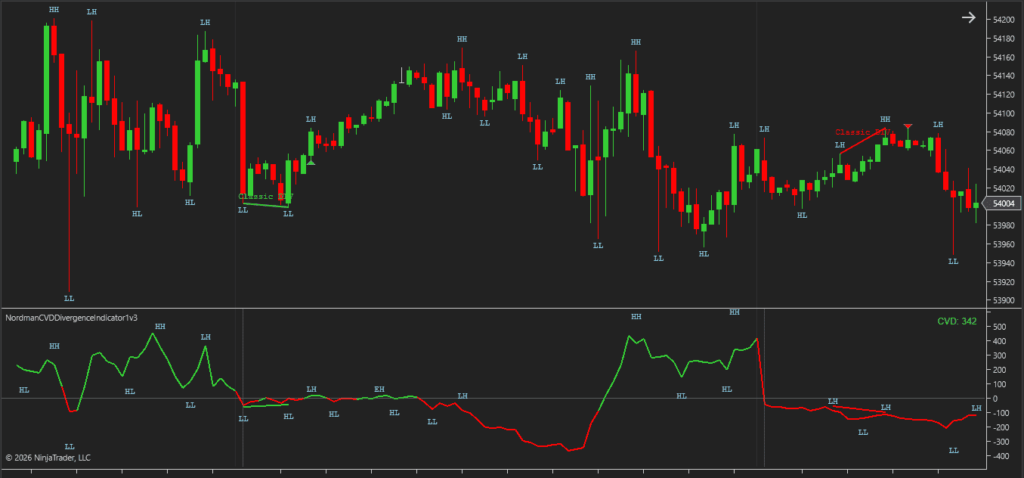
Line plots a continuous line connecting CVD close values across bars.
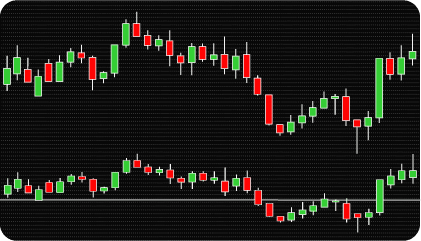
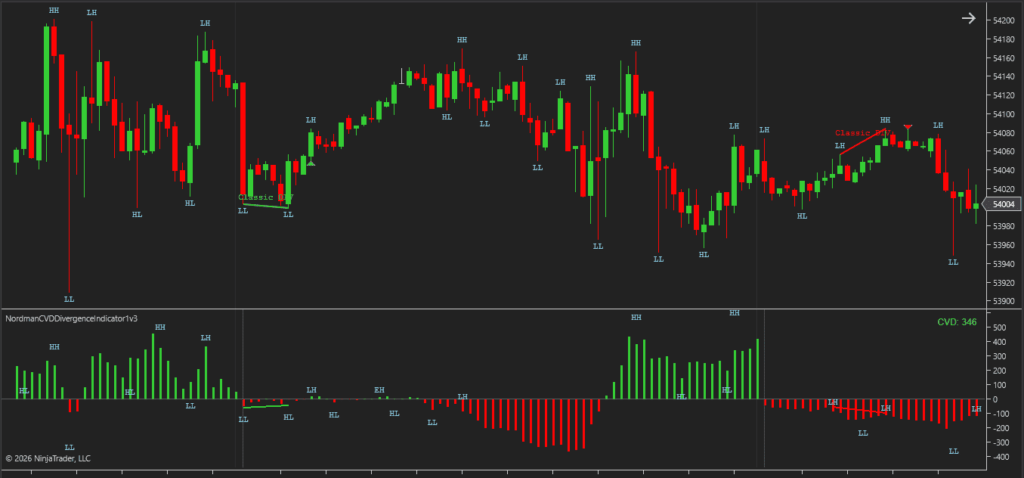
Histogram displays each bar’s cumulative CVD close value as a vertical bar extending from the zero line, making positive and negative cumulative readings easier to compare.
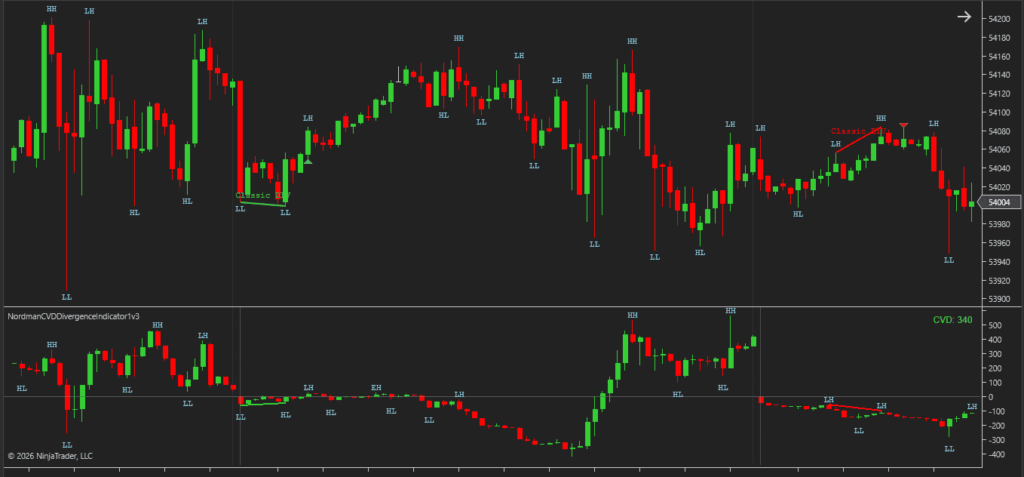
Candle renders the CVD series as Open/High/Low/Close candles, showing how the cumulative total moved within each bar rather than just where it closed.
All three modes support independent positive and negative color settings. In Line and Histogram modes, colors reflect whether the cumulative value is above or below zero. In Candle mode, colors reflect whether the CVD candle closed above or below its open. A zero line and reset markers can also be displayed as additional visual references.
-
-
CVD Candle Mode
-
-
CVD Histogram Mode
-
-
CVD Line Mode
Detection Filters
Five optional filters control when a CVD divergence condition is allowed to register.
Volume Filter compares the volume of the most recent price swing bar against the average volume of the preceding lookback period. Divergence conditions that do not meet the configured threshold are not registered.
EMA Filter requires price to be positioned on a specific side of a moving average on the current chart timeframe before a divergence qualifies.
Higher Timeframe EMA Filter applies the same directional logic on a selected higher timeframe — Minute, Hour, or Day — using a configurable EMA period.
VWAP Filter evaluates divergence conditions relative to session VWAP. Bullish conditions require price above VWAP, while bearish conditions require price below VWAP.
Kill Zones Filter restricts detection to selected session windows — Asia, London, New York, or a custom session. Divergence conditions that form outside the active sessions are ignored.
Each filter is independent and any combination can be active at the same time.
Alerts, Markers & Analytical Plot Outputs
The indicator provides alerts and chart markers for both Confirmed and Forming divergence events — separately for each state.
Confirmed divergence alerts trigger when a fully validated CVD divergence condition appears. Forming divergence alerts trigger when an early-stage condition is detected before swing confirmation is complete.
Popup, sound, and email notifications are available for both Confirmed and Forming alerts. Chart markers can also be enabled independently for each state. Bullish and bearish markers appear on the price chart at the bar where the divergence event is registered.
Divergence lines are drawn across the corresponding swing points on both the price chart and the CVD panel.
The indicator also exposes analytical plot outputs that can be accessed by NinjaTrader strategies, Strategy Builder workflows, BloodHound, and other compatible automation frameworks. CVD divergence conditions can then be used as inputs in automated analysis and trading systems.
Built-In MFE/MAE Tracker
The indicator includes an MFE/MAE Tracker module that measures how price has moved after each signal — how far it moved in the favorable direction and how far it moved against it, tracked across several configurable holding periods at once.
Results are shown directly on the chart as a dashboard and can be exported to CSV, giving a way to review signal behavior across a large sample rather than relying on visual impression from scrolling the chart. See how the MFE/MAE Tracker is calculated and how to read the dashboard →
How to Interpret and Use the NinjaTrader CVD Divergence Indicator
Reading Classic CVD Divergence
A Classic CVD Divergence condition appears when price and the CVD series reach a structural extreme but only one of them confirms it.
In a bearish Classic condition, price prints a higher high while CVD does not reach a corresponding higher high. In a bullish Classic condition, price prints a lower low while CVD does not confirm it.
The divergence marks the point where price and CVD stop agreeing at the swing extreme.
Reading Hidden CVD Divergence
Hidden CVD Divergence uses the inverted version of the same comparison.
In a bearish Hidden condition, CVD extends to a stronger high while price does not follow. Bullish Hidden divergence mirrors this at lows — CVD breaks to a lower low while price holds above.
Because the structural relationship is inverted relative to Classic CVD Divergence, Hidden conditions are generally read in a continuation context rather than a reversal one.
Forming vs Confirmed CVD Divergence
A Forming condition appears before all involved swing points pass Swing Strength validation. The structure is still developing. If the swing does not confirm, the condition may no longer satisfy the requirements for Confirmed divergence, although a registered Forming marker remains on the chart.
A Confirmed condition only appears once all swing points have cleared validation. The structural picture behind it is complete.
Forming and Confirmed conditions are visually distinguished by line style — dashed for Forming, solid for Confirmed.
Using Validation Parameters
The validation parameters work together to control what reaches the chart as a divergence.
Swing Strength determines how developed a swing must be before it qualifies. Vertex Match Tolerance handles the timing gap between price and CVD swings. Min and Max Bars Distance set boundaries on the structural width of the divergence. Min Price Difference and Min DIV Gap add minimum size requirements on the price and CVD sides respectively.
Using Detection Filters
The five detection filters each add a separate condition that must be met before a divergence is registered — without changing how CVD divergence itself is detected.
The Volume Filter evaluates the volume recorded at the most recent price swing. EMA and Higher Timeframe EMA filters evaluate directional context according to divergence type and direction. The VWAP Filter evaluates bullish and bearish conditions relative to session VWAP. Kill Zones work differently — they restrict detection to a defined time window regardless of other filter conditions.
All five can be combined. The more filters are active, the narrower the set of conditions that qualify.
Indicator Settings & Parameters
Alerts
- Enable Pop Up Alert — Displays an on-screen popup when a divergence alert event occurs.
- Enable Sound Alert — Plays a sound notification when an alert is triggered.
- Alert Sound File — Selects the audio file used for sound alerts.
- Enable Email Alert — Sends an email notification when a divergence alert event occurs.
- Email To — Defines the recipient email address for alert notifications.
Delta Calculation
Delta Type
Defines how volume is classified into buying and selling components.
- Up Down Tick — uses tick direction, works with standard tick data, no Tick Replay required
- Bid Ask — uses bid/ask transaction data, requires Tick Replay and bid/ask tick data from your data provider
Accumulation Period
Defines how long the CVD series accumulates before resetting.
- Session — resets at the start of each trading session
- Day — resets at the start of each calendar day
- Week — resets at the beginning of each trading week
- Custom Session — user-defined time window with manual start and end time
- Fixed Bars Count — accumulates over a set number of bars
- Unlimited — never resets, accumulates from the first available bar
Reset Mode
Applies to Session, Day, and Week accumulation.
- Auto — resets follow the selected period boundary automatically
- Manual Time — resets the CVD at a specified time; for Week accumulation, a day of the week can also be selected
- Reset Time (HH:mm:ss) — Defines the reset time when Manual Time reset mode is selected.
- Reset Day Of Week — Defines the reset day when Week accumulation and Manual Time reset mode are selected.
- Start Time (HH:mm:ss) — Defines the start time of the custom accumulation window when Custom Session period is selected.
- End Time (HH:mm:ss) — Defines the end time of the custom accumulation window when Custom Session period is selected.
- Bars Count — Defines the number of bars used for accumulation when Fixed Bars Count period is selected.
- Minimum Trade Size — Excludes trades below the specified size from delta calculations. Set to 0 to include all trades.
Divergence
DIV Search Period
Defines the time window within which the algorithm searches for divergence swing pairs. Independent from the CVD accumulation period. Supports the same period types as Accumulation Period.
- Swing Strength — Sets how strictly highs and lows must be validated before they qualify as structural swing points.
- DIV Search Periods — Number of consecutive periods used for divergence search when a time-based DIV Search Period is selected.
- DIV Search Start Time / End Time — Defines the custom session window for divergence search when Custom Session DIV Search Period is selected.
- DIV Search Bars Count — Defines the number of bars for divergence search when Fixed Bars Count DIV Search Period is selected.
- Detect Classic Bullish / Bearish — Enables detection of bullish and bearish Classic CVD divergence independently.
- Detect Hidden Bullish / Bearish — Enables detection of bullish and bearish Hidden CVD divergence independently.
- Min Bars Distance — Sets the minimum number of bars required between the two swing points that form a divergence.
- Max Bars Distance — Sets the maximum number of bars allowed between the two swing points that form a divergence.
- Vertex Match Tolerance — Sets how many bars apart the price swing and CVD swing are allowed to be while still counting as a matching pair.
- Min Price Difference Mode — Selects whether the minimum price difference is measured in Ticks or Percentage.
- Min Price Difference — Sets the minimum price movement required between the two price swing points.
- Min DIV Gap Mode — Selects whether the minimum CVD gap is measured as Absolute value or Percentage.
- Min DIV Gap — Sets the minimum difference required between the two CVD swing values.
- Detect Forming DIV — Enables early-stage divergence detection before swing confirmation is complete.
- Enable Max Lookback Swings — Enables a limit on how many historical swings the algorithm considers.
- Max Lookback Swings — Defines the maximum number of historical swings used in divergence search when the limit is enabled.
Alerts & Markers
- Enable Confirmed Divergence Alert — Triggers an alert when a Confirmed CVD divergence condition appears.
- Enable Confirmed Divergence Marker — Displays a marker on the price chart when a Confirmed divergence is detected.
- Enable Forming Divergence Alert — Triggers an alert when a Forming CVD divergence condition appears.
- Enable Forming Divergence Marker — Displays a marker on the price chart when a Forming divergence is detected.
Filters
- Enable Volume Filter — Enables volume-based filtering for divergence detection.
- Volume Lookback — Sets the lookback period used for volume comparison.
- Min Volume Multiplier — Sets the minimum volume threshold required for divergence qualification.
- Enable HTF Filter — Enables Higher Timeframe EMA filtering for divergence detection.
- Higher Timeframe Type — Selects the higher timeframe unit (Minute, Hour, or Day) used for HTF filtering.
- Higher Timeframe Minutes / Hours / Days — Sets the specific higher timeframe value used by the HTF filter.
- HTF EMA Period — Sets the EMA period used for higher timeframe filtering.
- Enable EMA Filter — Enables EMA-based filtering on the current chart timeframe.
- EMA Filter Period — Sets the EMA period used by the EMA filter.
- Enable VWAP Filter — Enables VWAP-based filtering for divergence detection.
- Enable Kill Zones — Restricts divergence detection to selected session windows.
- Enable #1–#4 Session — Enables individual Kill Zone sessions independently.
- Label — Sets the display label for each Kill Zone session.
- Start Session (EST) / End Session (EST) — Sets the active time window for each Kill Zone session.
- Session Color / Opacity — Controls the visual appearance of Kill Zone session backgrounds.
Display
Display Mode
Selects how the CVD series is visualized on the chart.
- Line — continuous line connecting CVD close values
- Histogram — vertical bars from the zero line showing cumulative CVD close values
- Candle — Open/High/Low/Close candles showing intrabar CVD movement
- Show Current Value — Displays the current CVD value as text on the indicator panel.
- Show Zero Line — Displays a horizontal reference line at zero.
- Zero Line Color / Size — Controls the appearance of the zero reference line.
- Show Reset Markers — Displays vertical markers at bars where the accumulation period resets.
- Reset Marker Color / Size — Controls the appearance of reset markers.
- Positive Color — Sets the color used for CVD values above zero in Line and Histogram modes, and for candles that close at or above their open in Candle mode.
- Negative Color — Sets the color used for CVD values below zero in Line and Histogram modes, and for candles that close below their open in Candle mode.
- Classic / Hidden DIV Labels — Enables and customizes the labels displayed on price divergence lines.
- Labels Font Size — Sets the font size used for divergence and swing labels.
- Swing Labels Color — Sets the color of CVD swing structure labels.
- Confirmed DIV Bullish / Bearish Color — Sets the colors used for Confirmed bullish and bearish divergence lines and markers.
- Forming DIV Bullish / Bearish Color — Sets the colors used for Forming bullish and bearish divergence lines and markers.
Custom Programming
Need changes to this indicator? We can customize it to your specifications — adding new functions, modifying logic, refining visuals, or integrating it with other NinjaTrader tools.
We also convert indicators into Automated Trading Strategies with advanced features such as trailing stops, position parameter controls, execution filters, and rule-based automation built to your technical specifications.
Request a free consultation to discuss the technical scope, timeline, and available development options.
We Value Your Feedback
We are committed to the ongoing development and refinement of our indicators. If you’ve spotted a bug, feel that something essential is missing, or have ideas that could make the indicator even better, just send us a message. Your feedback helps us improve and deliver tools that truly meet traders’ needs.
Exposed Analytical Plots for Strategy Builder Integration
The indicator provides a set of exposed analytical plot outputs designed for structured integration with third-party strategy builders and automation tools such as BloodHound and BlackBird (SharkIndicators), as well as other algorithmic trading environments.
| Analytical Plot Name |
Output Values |
| CVD Open |
Value |
| CVD High |
Value |
| CVD Low |
Value |
| CVD Close |
Value |
| Classic Bullish Confirmed DIV Signal |
> 0 |
| Classic Bearish Confirmed DIV Signal |
> 0 |
| Classic Bullish Forming DIV Signal |
> 0 |
| Classic Bearish Forming DIV Signal |
> 0 |
| Hidden Bullish Confirmed DIV Signal |
> 0 |
| Hidden Bearish Confirmed DIV Signal |
> 0 |
| Hidden Bullish Forming DIV Signal |
> 0 |
| Hidden Bearish Forming DIV Signal |
> 0 |
| Swing HH |
Value |
| Swing LH |
Value |
| Swing EH |
Value |
| Swing LL |
Value |
| Swing HL |
Value |
| Swing EL |
Value |
| Long MFE/MAE Period 1 |
Value |
| Short MFE/MAE Period 1 |
Value |
| Long MFE/MAE Period 2 |
Value |
| Short MFE/MAE Period 2 |
Value |
| Long MFE/MAE Period 3 |
Value |
| Short MFE/MAE Period 3 |
Value |
| Long MFE/MAE Period 4 |
Value |
| Short MFE/MAE Period 4 |
Value |
| Long MFE/MAE Opposite |
Value |
| Short MFE/MAE Opposite |
Value |
Plot output names and descriptions are technical identifiers intended solely for software integration purposes and do not constitute trading advice, signals, or recommendations.
FAQ
1. What is CVD Divergence?
CVD Divergence is a divergence concept that compares price swing structure against Cumulative Volume Delta — the accumulated difference between buying and selling volume over a selected period. When price and CVD develop conflicting structural behavior, a divergence condition is identified.
2. How is CVD Divergence different from standard price divergence?
Standard divergence compares price against a momentum oscillator such as RSI or MACD. CVD Divergence uses the cumulative buying and selling volume imbalance as the comparison source rather than a momentum-based series.
3. What is the difference between Classic and Hidden CVD Divergence?
Classic CVD Divergence occurs when price makes a new structural extreme while CVD fails to confirm it. Hidden CVD Divergence uses the inverted relationship — CVD extends to a new extreme while price does not follow. Classic is generally read in a reversal context; Hidden in a continuation context.
4. What is the difference between Forming and Confirmed divergence?
Forming divergence appears earlier, before full swing confirmation. Confirmed divergence appears later, after all swing points pass validation. Forming uses a dashed line; Confirmed uses a solid line. Forming detection is optional and can be enabled or disabled independently. Confirmed divergence remains active as part of the main detection logic, while alerts and markers can be configured separately for each state.
5. Do Forming divergence markers disappear if the swing does not confirm?
A registered Forming divergence remains on the chart even if the structure does not later qualify as Confirmed divergence. A condition that is still developing intrabar may change before it is registered as a completed Forming event.
6. What is the DIV Search Period and how is it different from the Accumulation Period?
The Accumulation Period controls how long the CVD series accumulates before resetting. The DIV Search Period defines the time window within which the divergence algorithm searches for swing pairs. The two are independent — each can be configured separately.
7. What parts of CVD divergence detection can be configured?
The indicator provides separate Classic and Hidden divergence controls for bullish and bearish conditions, Forming and Confirmed event handling, configurable Swing Strength and Vertex Match Tolerance, Min and Max Bars Distance, Min Price Difference, Min DIV Gap, a separate DIV Search Period, and five optional qualification filters. The underlying CVD series also includes two delta classification methods and six accumulation period types.
8. Can the indicator be used in automated strategies?
Yes. The indicator exposes analytical plot outputs that can be accessed by NinjaTrader strategies, Strategy Builder workflows, BloodHound, and other compatible automation frameworks. CVD divergence conditions can then be used as inputs in automated analysis and trading systems.
Disclaimer — Software Use & Risk Disclosure
Nordman Algorithms is a trade name of Nordman Algorithms OÜ (Reg. No. 14435535), registered in Tallinn, Estonia.
Software Nature & User Responsibility — Nordman Algorithms provides algorithmic software tools for technical analysis. Nordman Algorithms is not a financial advisor and is not liable for any losses. All trades conducted based on the software’s output are executed at the user’s sole discretion and risk.
Visual Markers & Signal Disclosure — This software may display visual markers (such as arrows, dots, or alerts) when predefined mathematical conditions are met. These markers are provided for educational and analytical purposes only, must not be interpreted as financial guidance, and do not constitute a recommendation to buy, sell, or hold any financial instrument. Users must independently validate all visual cues within their own trading methodology.
No Financial Advice — Nordman Algorithms does not provide discretionary trading signals, investment advice, or managed signal services. Our software represents a mathematical visualization of historical and real-time data. The appearance of a visual marker does not guarantee a profitable trade or predict future market behavior.
Trading Risk Warning — Futures, Forex, and options trading involve significant risk. Risk capital is money that can be lost without jeopardizing financial security. Only risk capital should be used for trading. Past performance is not indicative of future results. View Full Risk Disclosure: https://www.nordman-algorithms.com/risk-disclosure/
ESMA Risk Warning — Financial instruments, especially those involving leverage such as CFDs and Forex, are complex and carry a high risk of rapid financial loss. Our software provides analytical outputs and visual markers based on predefined mathematical conditions and does not mitigate or reduce inherent market risks. You should carefully consider whether you understand how leveraged financial instruments work and whether you can afford the high risk of losing your capital.
CFTC Rule 4.41 — Hypothetical or simulated performance results have inherent limitations. Unlike actual performance records, simulated results do not represent real trading. Because trades have not actually been executed, these results may under- or over-compensate for the impact of market factors such as liquidity. No representation is being made that any account will achieve profits or losses similar to those shown.
Trademark Notice — NinjaTrader® is a registered trademark of NinjaTrader Group, LLC. No NinjaTrader company has any affiliation with the owner, developer, or provider of the products or services described herein, or any interest, ownership or otherwise, in any such product or service, or endorses, recommends or approves any such product or service.