Profile Period
Selects the period used to build each profile.
- Custom Session
- Session
- Bars
- Day
- Week
- Month
- Quarter
- Year
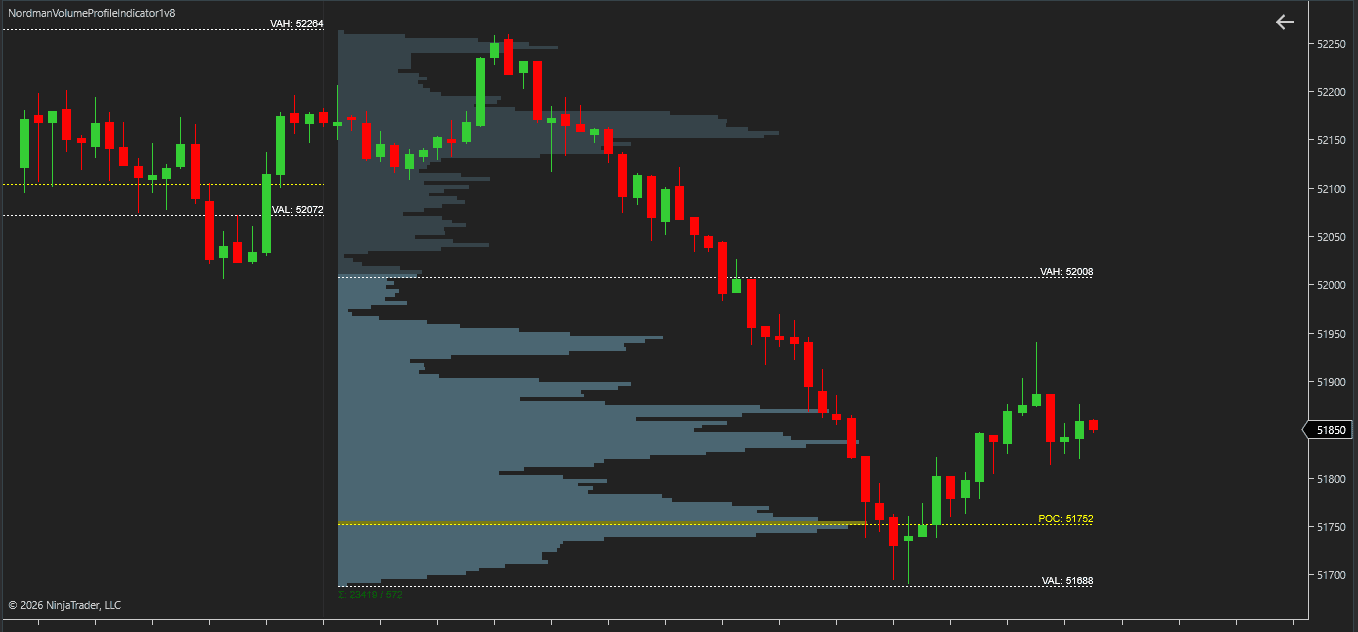
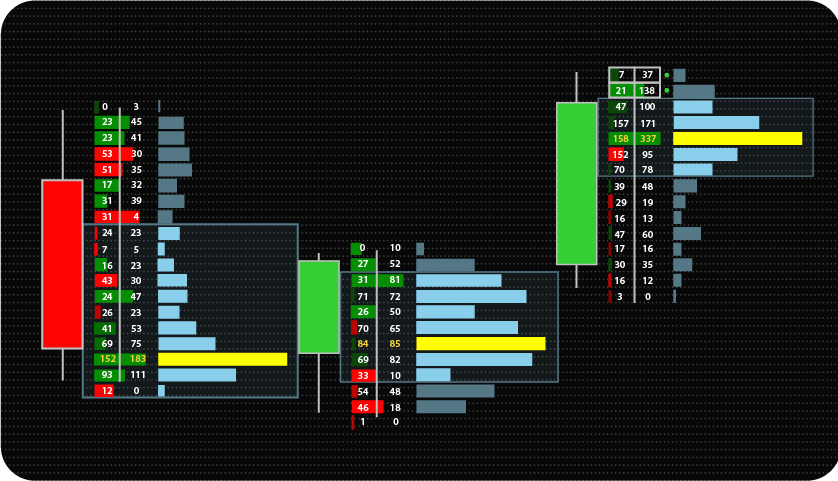
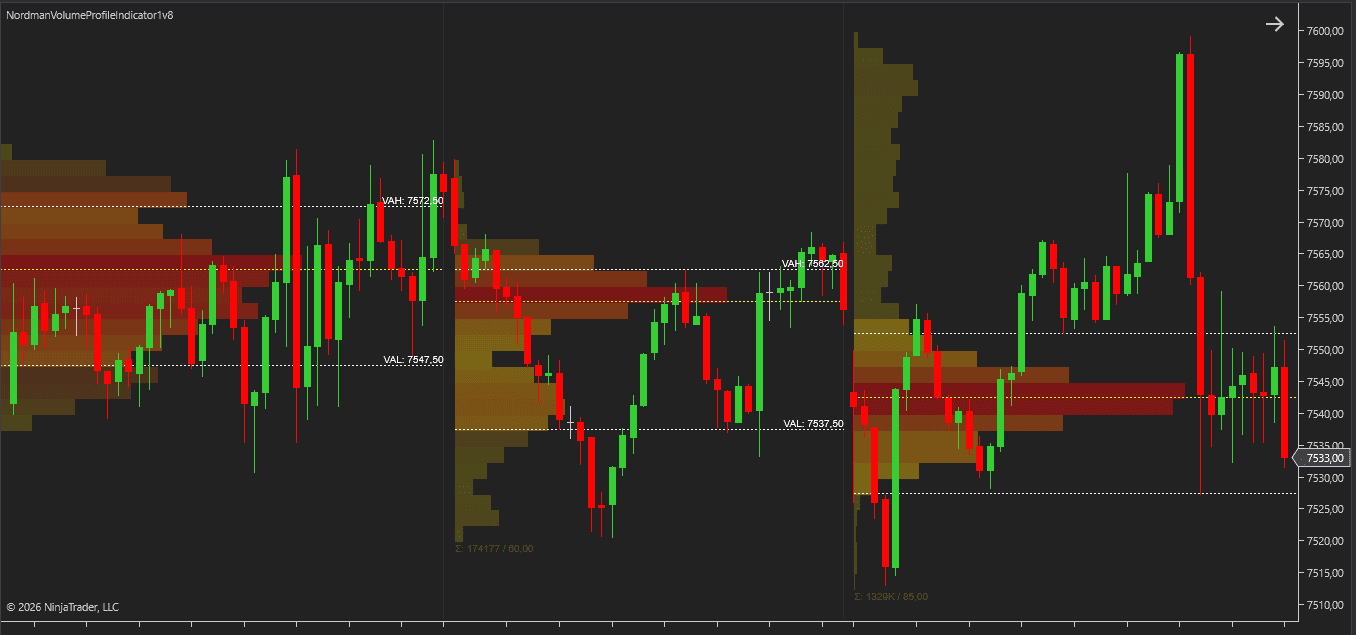
Volume Profile analysis displays traded volume by price level rather than by time.
Traditional volume indicators show how much volume traded during a bar or period. Volume Profile focuses on where volume traded within a selected price range. The result is a distribution of volume across individual price levels.
As volume builds at different prices, the profile shows where activity was concentrated during the selected session, period, or custom range. Higher-volume areas represent prices where more transactions occurred, while lower-volume areas represent prices where less activity took place.
Several commonly used reference levels are derived from this volume distribution:
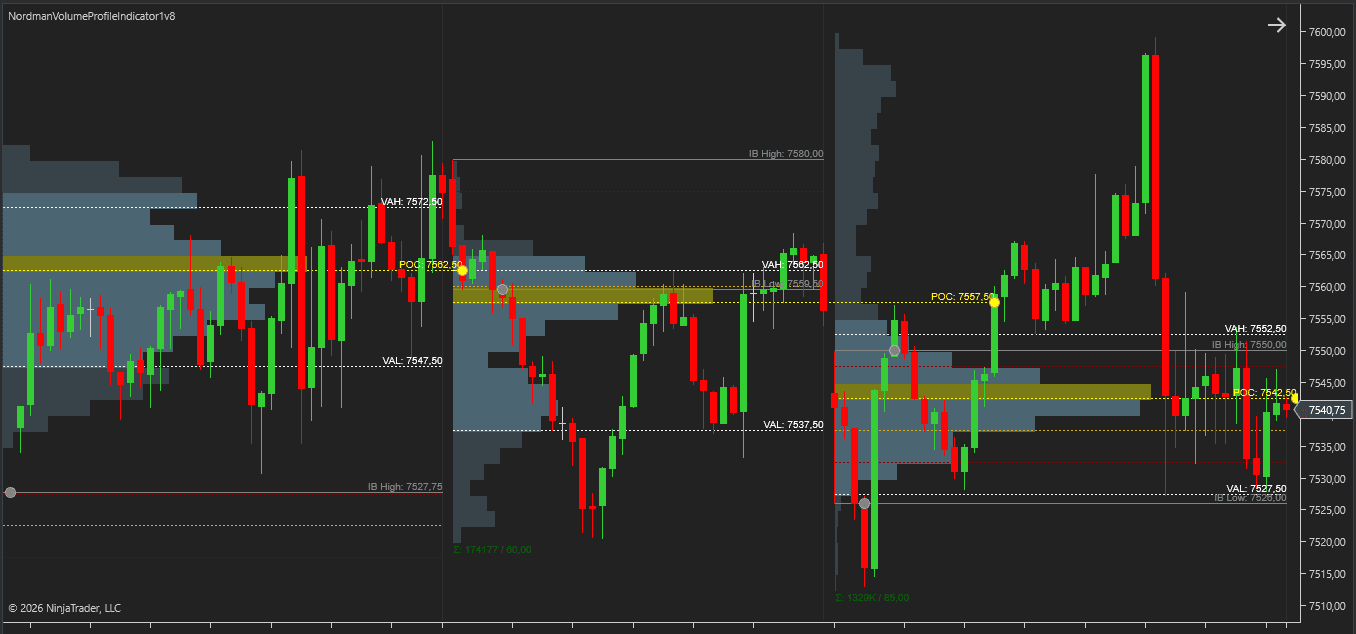
The indicator calculates these levels automatically and also supports Developing POC, Developing Value Area, Virgin POC tracking, and Initial Balance analysis.
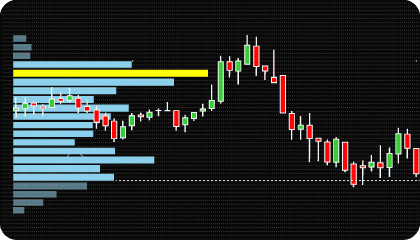
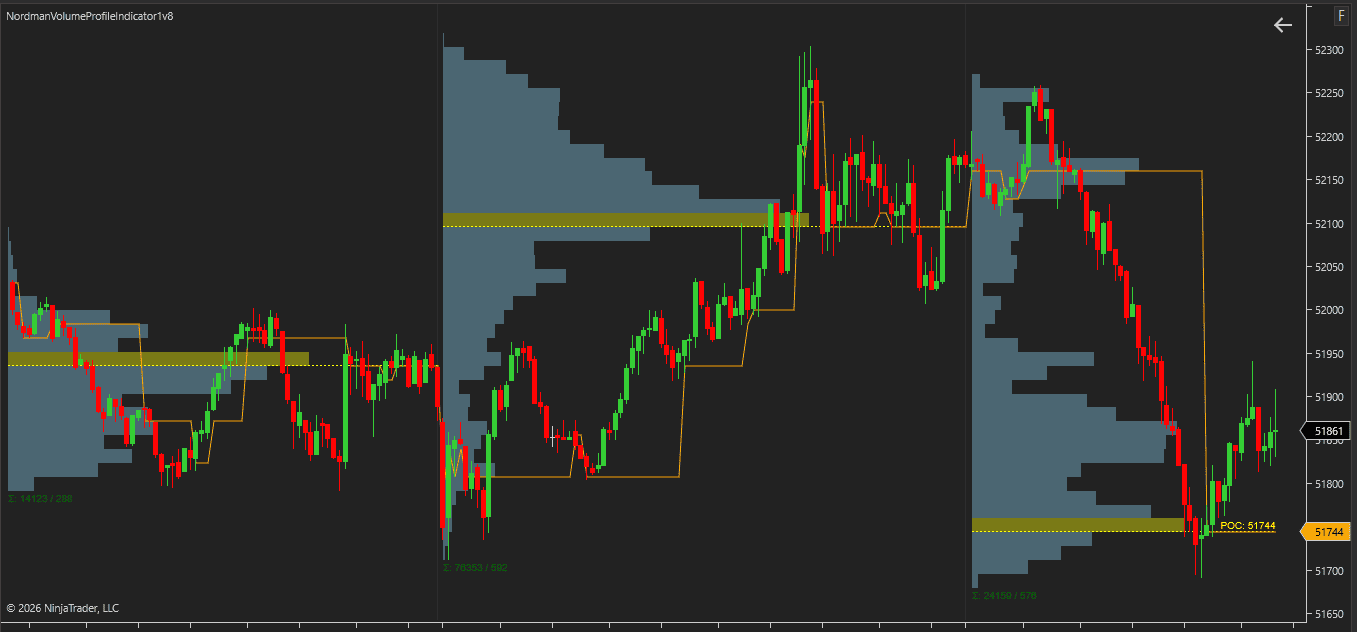
The Point of Control (POC) is the price where the most volume traded within a completed profile.
Because it represents the highest-volume price level in the profile, POC is often used as a primary reference level when analyzing volume distribution.
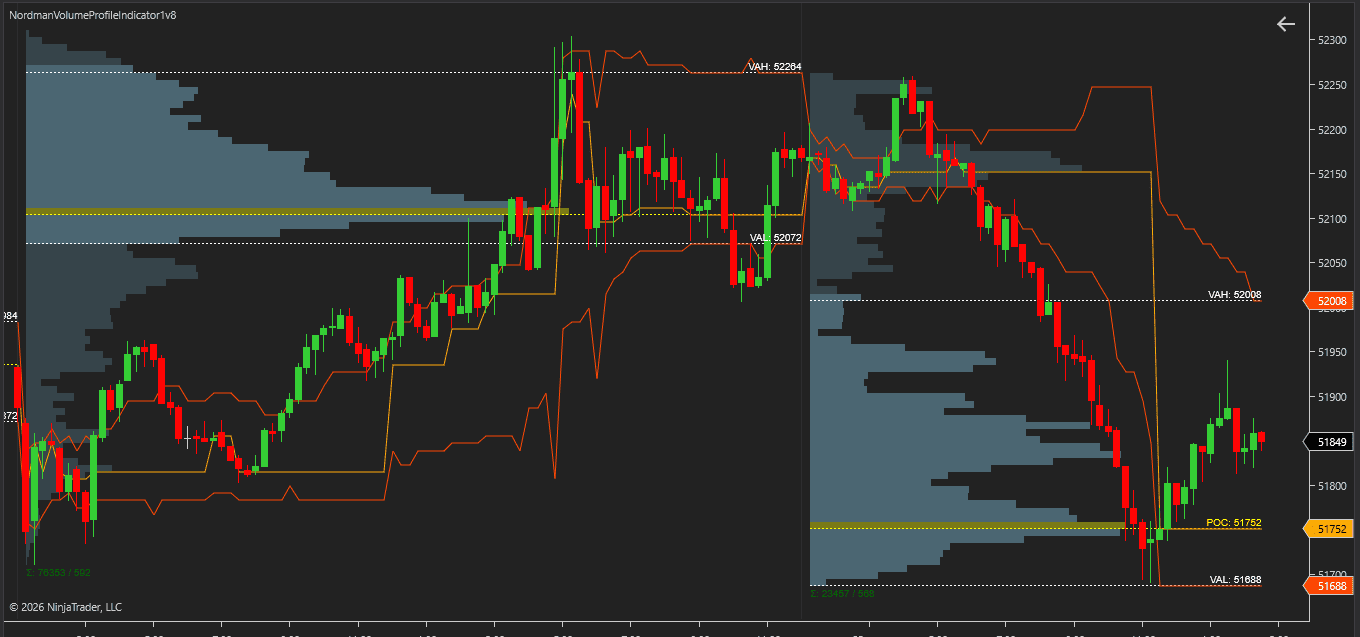
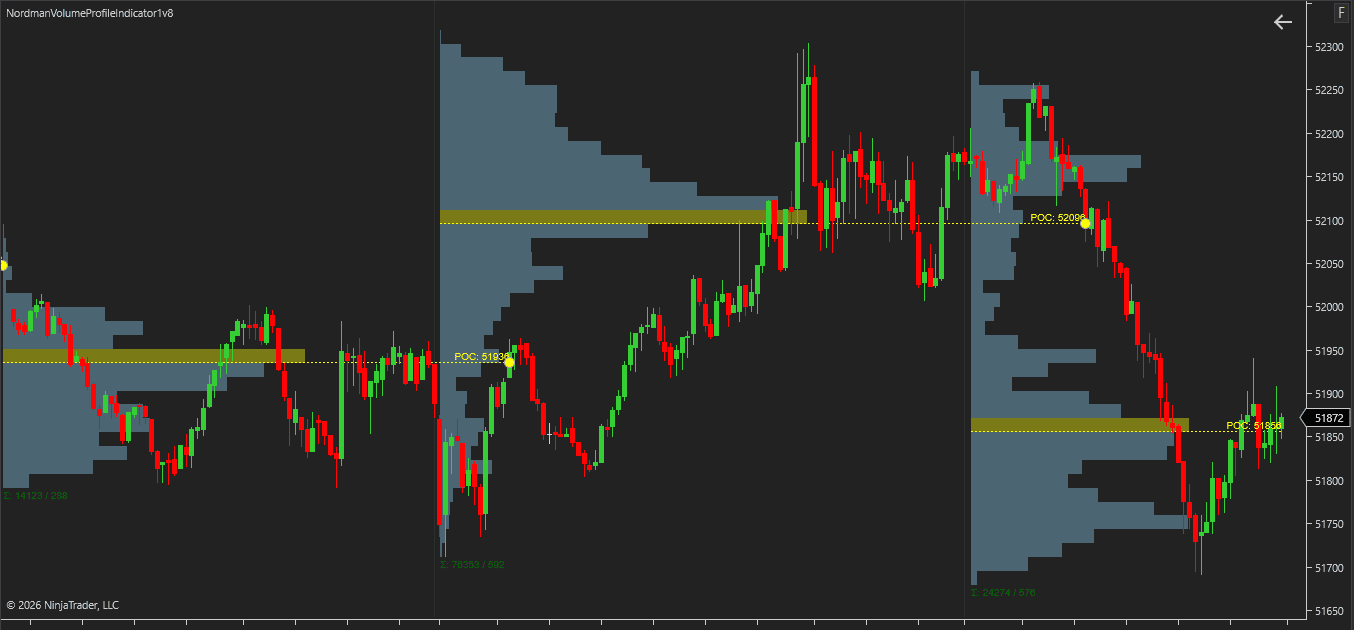
Developing POC shows how the Point of Control moves as the current profile develops.
As additional volume trades throughout the active profile period, the highest-volume price level may shift. The indicator updates the Developing POC throughout the session and can display its historical path as the profile evolves.
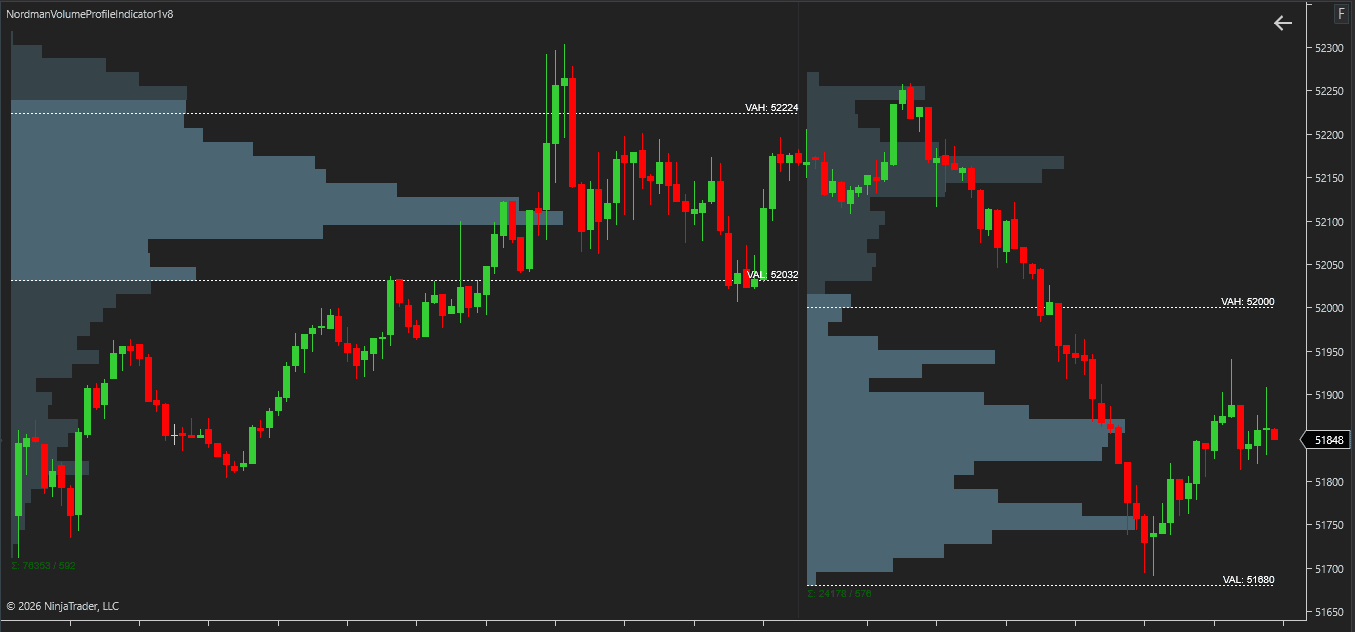
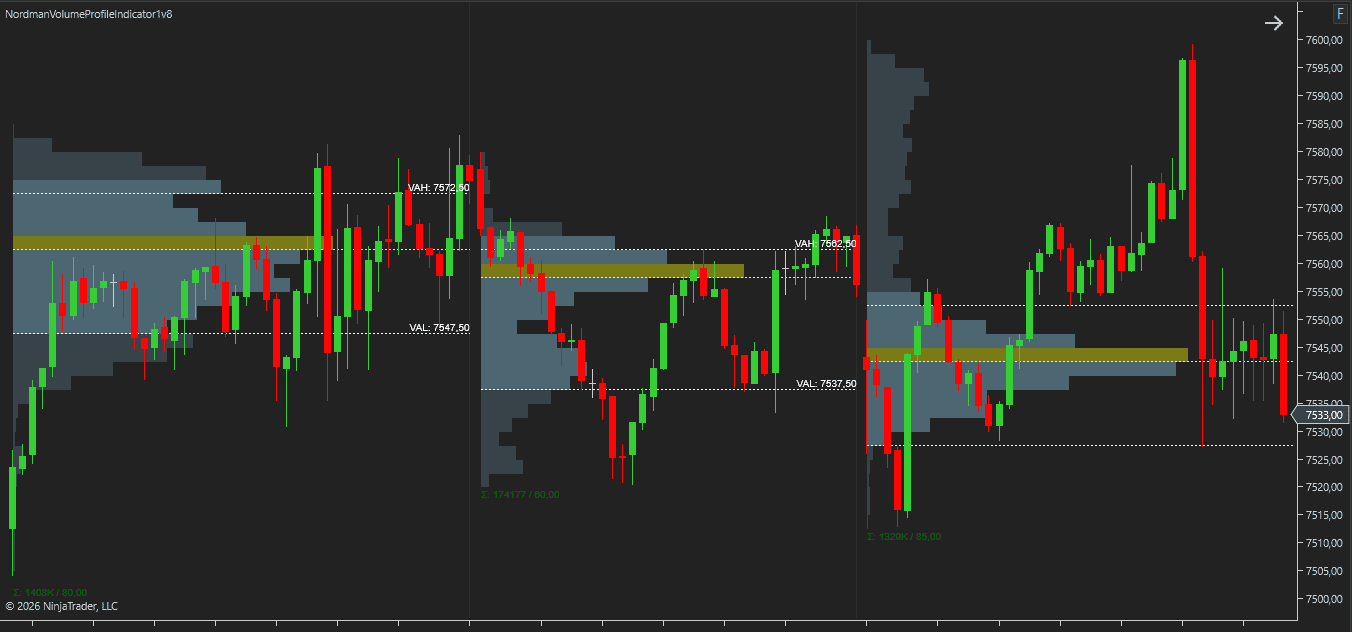
The Value Area represents the range of prices containing the majority of traded volume within a profile.
The upper boundary is called the Value Area High (VAH) and the lower boundary is called the Value Area Low (VAL).
The size of the Value Area is controlled through the Value Area Percentage setting.
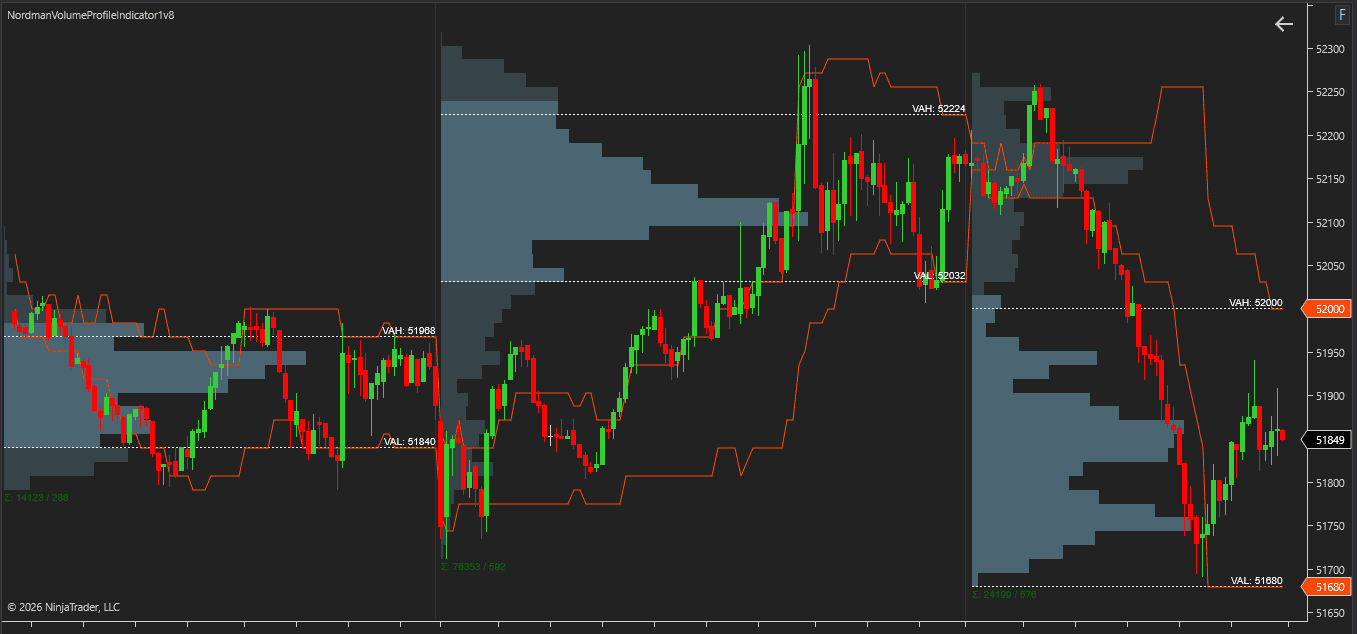
Developing Value Area tracks how VAH and VAL change while the active profile is still forming.
As volume accumulates at different prices, the Value Area boundaries may expand or shift. The indicator updates these levels throughout profile development and can display their historical movement.
A Virgin POC is a POC from a completed profile that price has not touched again.
The indicator tracks Virgin POC levels and can continue displaying them until the first interaction occurs. Dedicated alerts and markers can be used to identify these first-touch events automatically.
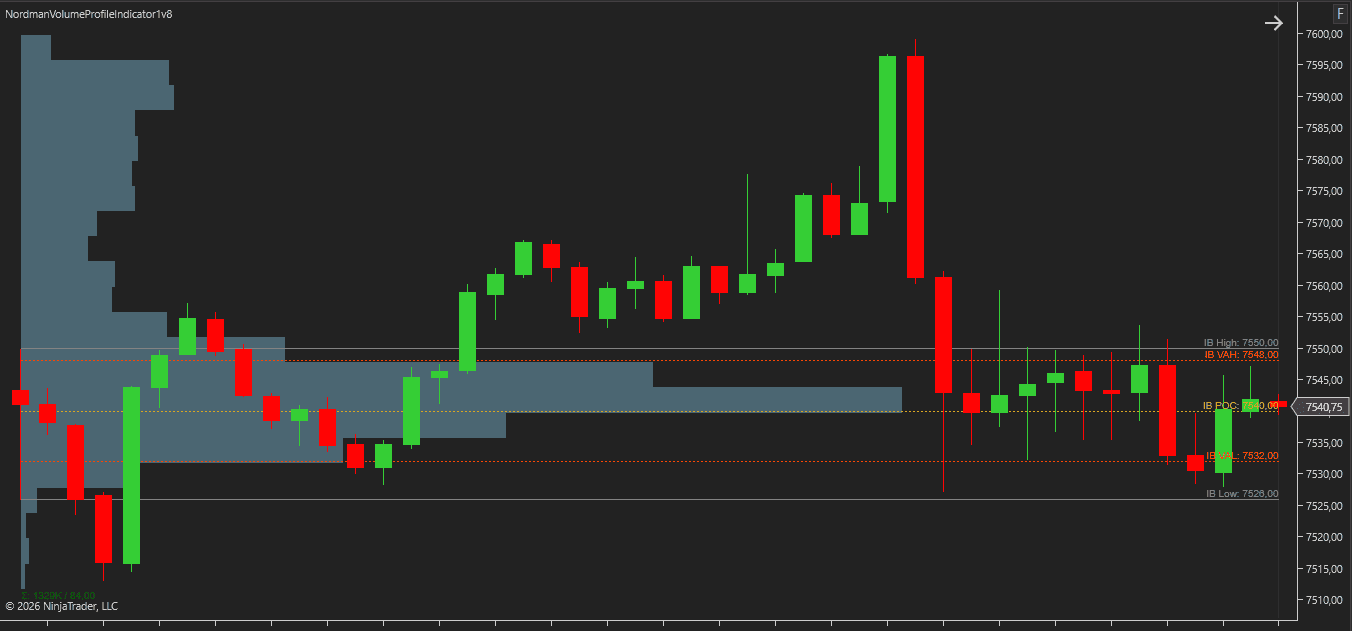
Initial Balance is the range formed during the first portion of a profile period.
The length of the Initial Balance is controlled through the Initial Balance Period Minutes setting and is calculated from the beginning of the selected profile period.
For example, if the Initial Balance period is set to 60 minutes, the Initial Balance High and Initial Balance Low are calculated using the first 60 minutes of trading activity.
The indicator also calculates an Initial Balance Point of Control (IB POC) and Initial Balance Value Area (IB VA) using only volume from the Initial Balance period.
These levels can be displayed independently and used together with Initial Balance breakout alerts and markers.
The indicator provides profile levels and event-based signals that can be used by NinjaTrader strategies, Strategy Builder workflows, and other automation tools.
Available outputs include Point of Control (POC), Value Area levels, Developing Levels, Virgin POC conditions, Initial Balance reference levels, and profile interaction events such as POC touches, Value Area touches, Virgin POC touches, and Initial Balance breakouts.
This allows volume profile levels and profile-based events to be incorporated into custom indicators, automated trading systems, market scanners, and other analytical tools.
The indicator includes extensive visualization and styling controls for all profile components.
Profile colors, opacity, line styles, labels, markers, and text elements can be configured independently. Separate styling options are available for POC, Value Area levels, Developing Levels, Virgin POC levels, Initial Balance components, profile summaries, and alert markers.
These settings make it possible to adapt the indicator to different chart layouts and visual preferences.
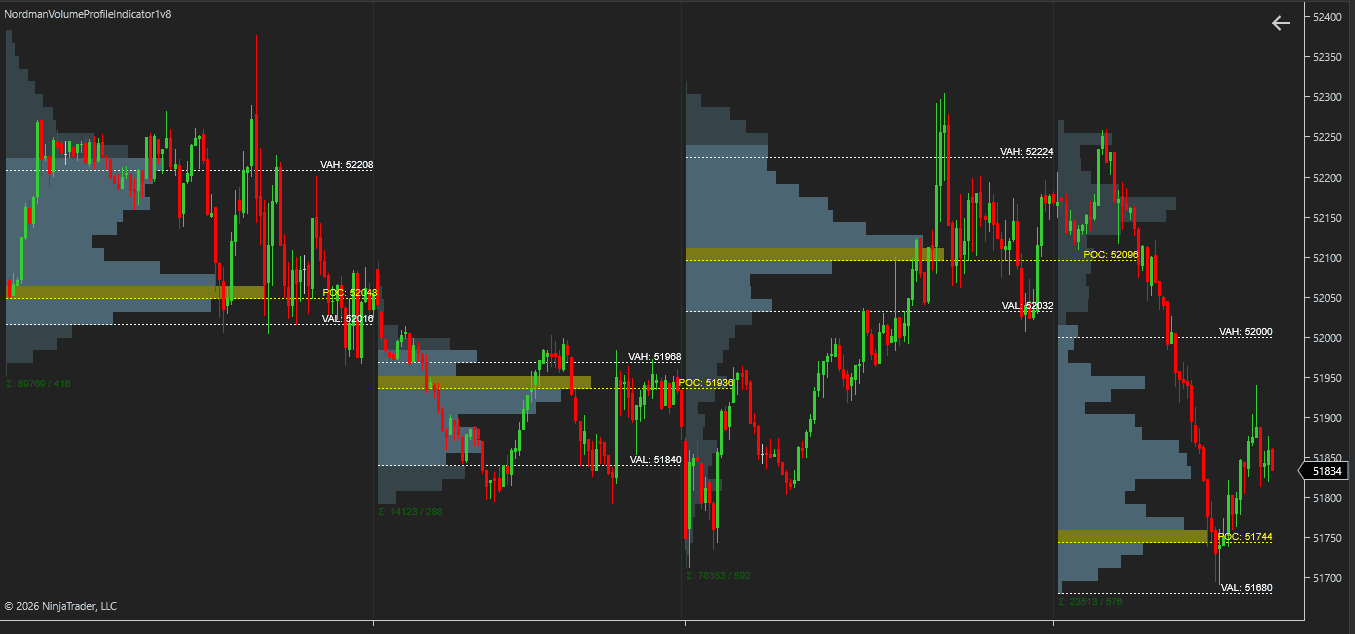
Volume profiles can be built using different period types and visualized using several display modes. This allows the same profile engine to be applied to intraday sessions, higher-period profiles, or user-defined bar ranges.
Volume profiles can be constructed using the following period types: Custom Session, Session, Bars, Day, Week, Month, Quarter, and Year.
Each profile contains volume traded during the selected period and is calculated independently according to the chosen profile settings.
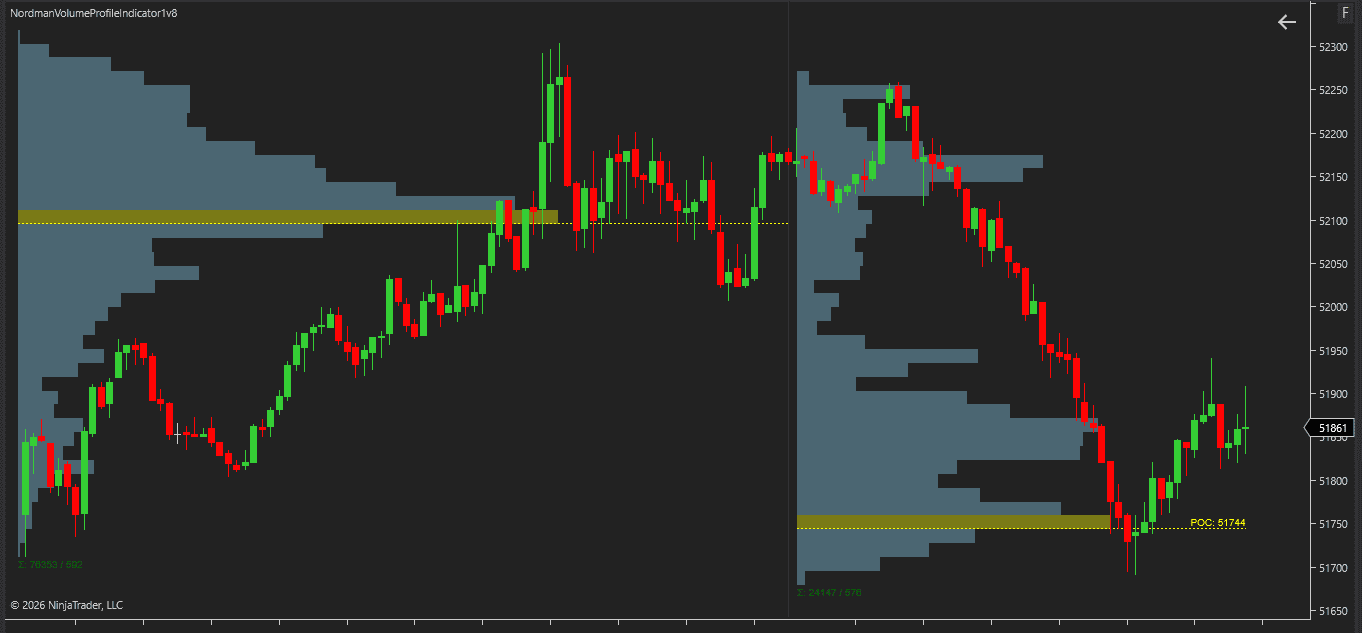
Multiple consecutive periods can be combined into a single profile. For example, when Session mode is selected and Number Of Periods is set to 2, volume from two sessions is aggregated into one profile rather than displayed as two separate session profiles.
When Bars mode is selected, the Bars For Period setting controls how many bars are included in each profile.
Standard mode displays total volume at each price level without separating buying and selling activity. This provides a traditional volume profile view focused on overall volume distribution.
Buy / Sell mode separates volume into buying and selling components at each price level. This makes it possible to view both sides of traded volume independently within the profile.
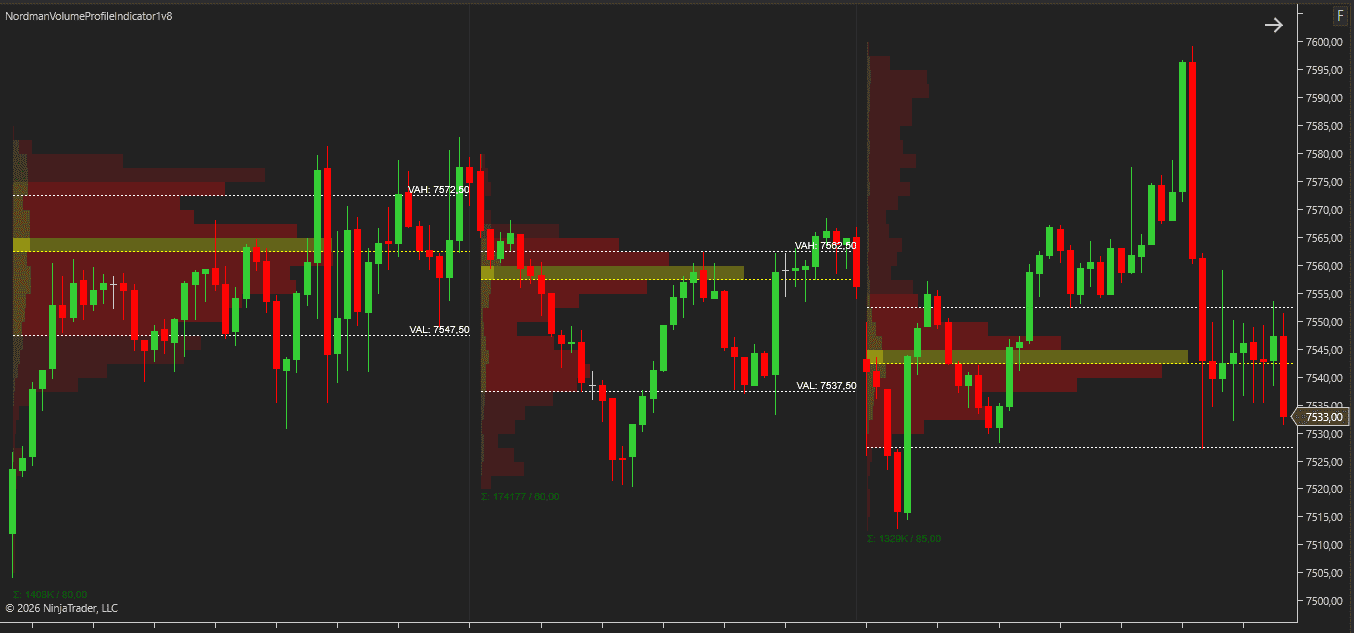
Delta mode displays the difference between buying and selling volume at each price level. Positive and negative delta values are visualized directly within the profile structure.
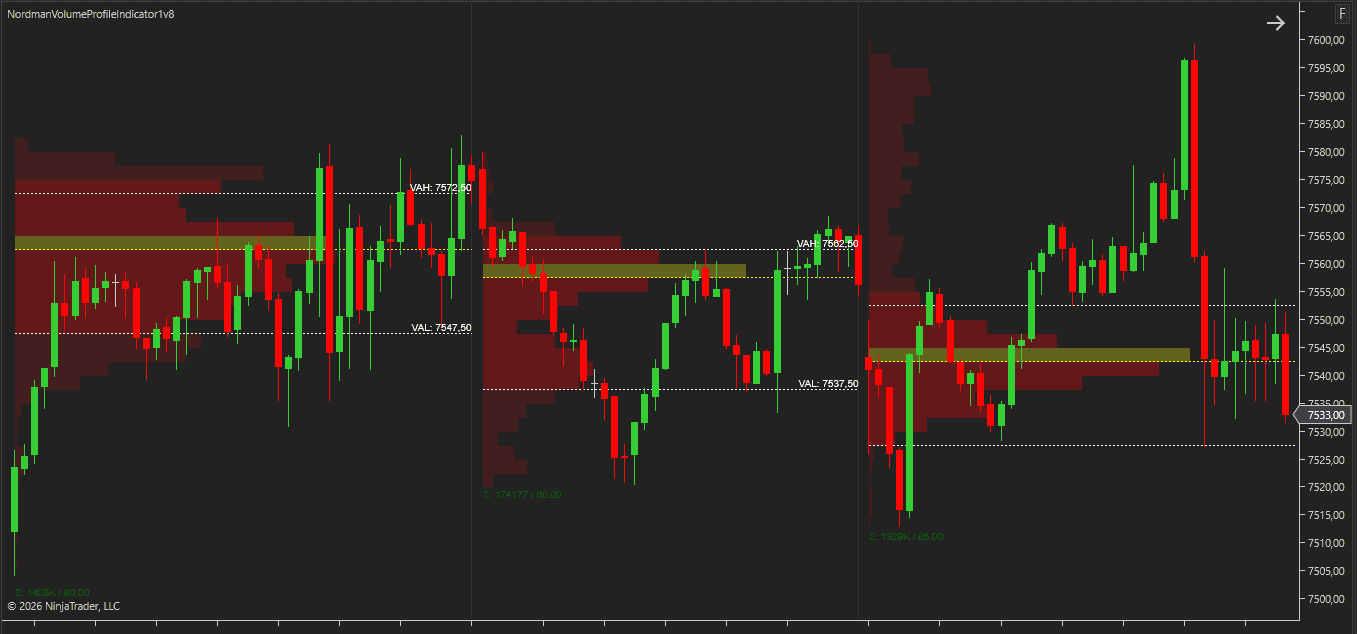
Heat mode highlights higher- and lower-volume areas using color intensity. Areas with greater volume receive stronger visual emphasis, making volume concentration easier to identify at a glance.
Buy / Sell and Delta profile modes support two volume classification methods.
Bid Ask classification uses bid and ask transaction data to separate buying and selling volume. This method requires tick-level market data.
Up Down Tick classification uses tick movement direction to classify volume when bid and ask transaction data is unavailable or not being used.
Profile calculations can be performed using Tick or Minute resolution. Tick Resolution uses tick-level data and is required for Bid Ask delta calculations. Minute Resolution uses minute-based aggregation instead of individual ticks.
Ticks Per Level controls how price levels are grouped within the profile. Higher values create broader profile levels, while lower values produce more detailed profile structures.
The NinjaTrader Volume Profile Indicator includes alerts and chart markers for profile interaction events and Initial Balance breakout conditions. Alerts can be used to monitor profile levels automatically, while markers provide visual confirmation directly on the chart.
Alerts can be generated when price touches a Point of Control (POC) level. POC touch events can also be displayed using chart markers.
Alerts can be generated when price interacts with Value Area boundaries. Both Value Area High (VAH) and Value Area Low (VAL) interactions can be monitored and displayed on the chart.
Virgin POC levels can be monitored for first-touch events after profile completion. When price reaches a Virgin POC for the first time, the indicator can generate an alert and display a corresponding marker.
Initial Balance breakout detection monitors Initial Balance High and Initial Balance Low levels. Breakout events can generate alerts, chart markers, or both.
Min Period Progress defines how much of the active profile period must be completed before alert conditions become eligible. This can be used to prevent alerts and markers from being generated too early during profile development.
Controls whether multiple Initial Balance breakout events can be generated after an initial breakout has occurred. When disabled, only the first qualifying breakout event is reported.
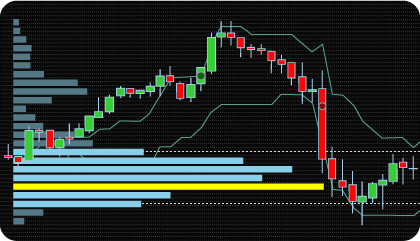
Volume Profile is often used to compare where trading activity occurred in the past with how volume is developing in the current session. Rather than focusing only on price movement, profile analysis introduces an additional layer of context by showing where volume was concentrated and how that distribution changes over time.
One common approach is to monitor completed profile levels alongside the active developing profile. Past profiles provide fixed reference levels from previous sessions, while Developing POC and Developing Value Area reveal how the current session is taking shape. Viewing both together makes it possible to compare historical volume distribution with current market activity.
Profile structures often look different depending on the amount of data included in the calculation.
Combining multiple sessions, days, or weeks into a single profile can help reveal broader volume distributions that may not be visible when analyzing individual periods separately. The Number Of Periods setting makes it possible to switch between shorter-term and broader profile views without changing profile type.
Many traders evaluate volume distributions separately for different market sessions.
Custom Session and Session profile modes can be used to isolate specific trading hours and compare how volume develops across different parts of the trading day. This can be useful when monitoring session-specific participation, volatility, or volume concentration.
Volume Profile levels often require continuous observation during active trading hours.
The indicator can monitor profile interaction events automatically and generate alerts when price touches a Point of Control, reaches a Value Area boundary, interacts with a Virgin POC, or breaks an Initial Balance level. This makes it easier to track profile events without continuously watching the chart.
Profile levels can also be incorporated into automated analysis and strategy development.
The indicator exposes profile values and event-based outputs that can be accessed by NinjaTrader strategies, Strategy Builder workflows, market scanners, and other automation tools. This allows the same profile calculations displayed on the chart to be referenced programmatically.
A typical workflow combines completed profiles, Developing Levels, and Initial Balance components within the same chart layout.
Completed profiles provide historical reference levels. Developing POC and Developing Value Area show how volume distribution is evolving during the current session. Initial Balance components add opening-session context, while alerts and markers help track profile interaction events as they occur.
Using these elements together allows historical profile structure, current session development, and profile-based events to be viewed within a single analytical framework.
Selects the period used to build each profile.
Selects the profile visualization method.
Defines the volume classification method used by Buy / Sell and Delta profile modes.

Need changes to this indicator? We can customize it to your specifications — adding new functions, modifying logic, refining visuals, or integrating it with other NinjaTrader tools.
We also convert indicators into Automated Trading Strategies with advanced features such as trailing stops, position parameter controls, execution filters, and rule-based automation built to your technical specifications.
Request a free consultation to discuss the technical scope, timeline, and available development options.
We are committed to the ongoing development and refinement of our indicators. If you’ve spotted a bug, feel that something essential is missing, or have ideas that could make the indicator even better, just send us a message. Your feedback helps us improve and deliver tools that truly meet traders’ needs.
The indicator provides a set of exposed analytical plot outputs designed for structured integration with third-party strategy builders and automation tools such as BloodHound and BlackBird (SharkIndicators), as well as other algorithmic trading environments.
| Analytical Plot Name | Output Values |
| POC | Value |
| Virgin POC Above | Value |
| Virgin POC Below | Value |
| VAL | Value |
| VAH | Value |
| IB High | Value |
| IB Low | Value |
| IB POC | Value |
| IB VAH | Value |
| IB VAL | Value |
| Previous Session POC | Value |
| Previous Session VAH | Value |
| Previous Session VAL | Value |
| POC Touch | > 0 |
| VAH Touch | > 0 |
| VAL Touch | > 0 |
| Virgin POC Touch | > 0 |
| IB High Breakout | > 0 |
| IB Low Breakout | > 0 |
Plot output names and descriptions are technical identifiers intended solely for software integration purposes and do not constitute trading advice, signals, or recommendations.
Point of Control (POC) is the single price level where the most volume traded within a profile.
Value Area is a range of prices containing a configurable percentage of total profile volume. The upper boundary is called Value Area High (VAH), and the lower boundary is called Value Area Low (VAL).
A Virgin POC is a Point of Control from a completed profile that has not been touched by price since the profile was completed.
The indicator can track Virgin POC levels automatically and generate alerts or markers when a first-touch event occurs.
A completed POC is calculated from a finished profile period and remains fixed once the profile is complete.
Developing POC updates continuously during the active profile period and may change as new volume enters the market.
Yes. The indicator supports Custom Session profiles with user-defined start and end times, allowing volume distributions to be calculated for specific trading windows.
The indicator supports Custom Session, Session, Bars, Day, Week, Month, Quarter, and Year profile periods.
Multiple consecutive periods can also be combined into a single profile using the Number Of Periods setting.
Bid Ask Delta classifies volume using bid and ask transaction data.
Up Down Tick Delta classifies volume according to tick movement direction.
Bid Ask calculations require tick-level market data.
Initial Balance is the range formed during the opening portion of a profile period.
The indicator can display Initial Balance High, Initial Balance Low, Initial Balance POC, and Initial Balance Value Area calculations based on the selected Initial Balance period.
Yes. The indicator supports alerts for Point of Control touches, Value Area touches, Virgin POC first-touch events, and Initial Balance breakout conditions.
Optional chart markers can also be displayed for supported alert events.
The NinjaTrader Volume Profile Indicator combines multiple profile construction methods, profile display modes, developing profile levels, Virgin POC tracking, Initial Balance analysis, alerts, chart markers, and automation outputs within a single framework.
In addition to completed profile levels, the indicator can display Developing POC and Developing Value Area movement, monitor Virgin POC interactions, generate profile-based alerts, and expose profile data for NinjaTrader strategies and automation workflows.
The indicator also supports Custom Session profiles, multi-period profile aggregation, Standard, Buy/Sell, Delta, and Heat profile modes, along with configurable profile resolution and delta calculation methods.
Yes. The indicator provides profile levels and event-based outputs that can be accessed by NinjaTrader strategies, Strategy Builder workflows, market scanners, and other automation tools.
This allows profile calculations and profile interaction events to be incorporated into custom analytical and automated trading workflows.
Nordman Algorithms is a trade name of Nordman Algorithms OÜ (Reg. No. 14435535), registered in Tallinn, Estonia.
Software Nature & User Responsibility — Nordman Algorithms provides algorithmic software tools for technical analysis. Nordman Algorithms is not a financial advisor and is not liable for any losses. All trades conducted based on the software’s output are executed at the user’s sole discretion and risk.
Visual Markers & Signal Disclosure — This software may display visual markers (such as arrows, dots, or alerts) when predefined mathematical conditions are met. These markers are provided for educational and analytical purposes only, must not be interpreted as financial guidance, and do not constitute a recommendation to buy, sell, or hold any financial instrument. Users must independently validate all visual cues within their own trading methodology.
No Financial Advice — Nordman Algorithms does not provide discretionary trading signals, investment advice, or managed signal services. Our software represents a mathematical visualization of historical and real-time data. The appearance of a visual marker does not guarantee a profitable trade or predict future market behavior.
Trading Risk Warning — Futures, Forex, and options trading involve significant risk. Risk capital is money that can be lost without jeopardizing financial security. Only risk capital should be used for trading. Past performance is not indicative of future results. View Full Risk Disclosure: https://www.nordman-algorithms.com/risk-disclosure/
ESMA Risk Warning — Financial instruments, especially those involving leverage such as CFDs and Forex, are complex and carry a high risk of rapid financial loss. Our software provides analytical outputs and visual markers based on predefined mathematical conditions and does not mitigate or reduce inherent market risks. You should carefully consider whether you understand how leveraged financial instruments work and whether you can afford the high risk of losing your capital.
CFTC Rule 4.41 — Hypothetical or simulated performance results have inherent limitations. Unlike actual performance records, simulated results do not represent real trading. Because trades have not actually been executed, these results may under- or over-compensate for the impact of market factors such as liquidity. No representation is being made that any account will achieve profits or losses similar to those shown.
Trademark Notice — NinjaTrader® is a registered trademark of NinjaTrader Group, LLC. No NinjaTrader company has any affiliation with the owner, developer, or provider of the products or services described herein, or any interest, ownership or otherwise, in any such product or service, or endorses, recommends or approves any such product or service.