NinjaTrader VWAP + RSI Indicator supports two strategy modes:
In VWAP + RSI mode, the main indicator is VWAP. VWAP stands for weighted average price, which is the average price of an asset over a given period, weighted by volume. The main advantage of VWAP is that it includes volume in the average price calculation. Some analysts consider volume the most important indicator after price movement. The most important benefit of VWAP for analysts and traders is its ability to combine these two indicators into one indicator.
In periods of high volume, typically accompanied by increased volatility, VWAP is more sensitive to price changes, allowing the trader to timely and accurately follow strong market movements. With low volumes, accompanied by a decrease in volatility, the line slows down and becomes inertial, which allows you to filter out minor price fluctuations.
Combination with RSI.
The RSI indicator is an oscillator that complements VWAP signals by identifying overbought and oversold zones.
In the oversold zone, it is assumed that sellers, having filled the market, give up their positions and buyer activity increases, as a result of which the price begins to rise, which is a favorable condition for making a purchase. Similar to the overbought zone – the activity of sellers increases and the price begins to decline, in this case it is recommended to sell.
Combining VWAP signals with RSI confirmation allows you to enter when the price is in the overbought or oversold zone, but has already made a sufficient reversal, which increases the likelihood of further significant price movement.
In VWAP + RSI Divergence mode, the main signal is divergence, determined by the RSI indicator. In this mode it is possible to use the following types of divergence:
Divergence is the discrepancy between indicator readings and real price changes.
Classic divergence is defined when the indicator readings correspond to the direction of the intended trade, but the price is still moving in the opposite direction.
Hidden divergence,on the contrary, is defined when the indicator maintains the direction of its movement, but the price has already reversed. The direction of movement of the price and the indicator is determined by the last two pronounced tops (when selling) or bottoms (when buying).
Classic and hidden divergences provide insight into potential reversals or continuation of a trend.
By analyzing divergence signals in combination with VWAP and standard deviation, traders can more accurately determine possible entry and exit points for trades.
The indicator offers three notification options – audio alerts, email notifications and on-screen pop-ups – to keep traders updated with real-time trading signals, ensuring timely decision making and execution.
To detect trading signals in the VWAP + RSI mode, you can use the VWAP indicator either independently or in combination with standard deviation channels that are formed relative to the VWAP line.
Available signal types:
Buy signals:
The price crosses the VWAP line from bottom to top.
The price crosses the border of the channel located below the VWAP line by 1.2 or 3 standard deviations (determined by the indicator settings) from bottom to top.
Sell signals are determined similarly, but by crossing from top to bottom. Accordingly, when using standard deviation channels, the price must cross the channel boundaries located above the VWAP line.
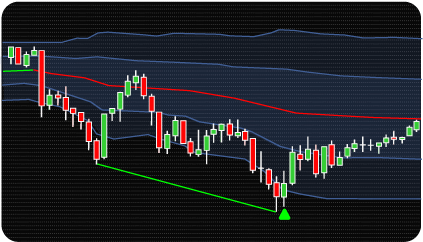
In the VWAP + RSI Divergence mode, the indicator additionally draws divergence lines – segments connecting the peaks or troughs along which the divergence was determined. Solid lines connect the vertices for classic divergence, and dotted lines for hidden divergence. Green lines are used to indicate bullish divergence, that is, buy signals, red lines are used to indicate bearish divergence, that is, sell signals.
To confirm divergence signals, check the position of the last top or bottom relative to the VWAP indicator or standard deviation channels. To confirm a buy, the bottom must be located below the VWAP line or below the lower border of the channel. Accordingly, to sell, the last top must be above the VWAP line or above the upper boundary of the standard deviation channel.
The indicator has the following parameters:
Alerts – setting up various types of alerts.
Mode – choice of strategy type.
Signal Type – selection of signal type: using only VWAP or VWAP with standard deviation channels.
Divergence Type – setting up the types of divergences that will be used to search for signals.
Min Candles After VWAP Reset – minimum number of waiting bars/candles to start detecting signals after resetting the calculated VWAP value.
RSI – individual setting up key RSI parameters.
Order Flow VWAP – individual setting up key VWAP parameters.

We can also turn the indicator into an Automated Trading Strategy with an extended set of custom functions (stop loss, take profit, trailing stop, risk management parameters, trading time limit, and others).
Request a free consultation from our team of professional programmers and find out the cost and timing of your project development.
We are committed to the ongoing development and refinement of our indicators. If you’ve spotted a bug, feel that something essential is missing, or have ideas that could make the indicator even better, just send us a message. Your feedback helps us improve and deliver tools that truly meet traders’ needs.
Nordman Algorithms is not liable for any risk that you face using the software. Please, use the software on your own responsibility. The software is coded in accordance with a common known concept and Nordman Algorithms does not guarantee accuracy or trading performance of the software signals.
Futures, foreign currency and options trading contains substantial risk and is not for every investor. An investor could potentially lose all or more than the initial investment. Risk capital is money that can be lost without jeopardizing one’s financial security or lifestyle. Only risk capital should be used for trading and only those with sufficient risk capital should consider trading. Past performance is not necessarily indicative of future results. View Full Risk Disclosure.
CFTC Rules 4.41 – Hypothetical or Simulated performance results that have certain inherent limitations. Unlike the results shown in an actual performance record, these results do not represent actual trading. Also, because these trades have not actually been executed, these results may have under-or over-compensated for the impact, if any, of certain market factors, such as lack of liquidity. Simulated or hypothetical trading programs in general are also subject to the fact that they are designed with the benefit of hindsight. No representation is being made that any account will or is likely to achieve profits or losses similar to these being shown.
NinjaTrader® is a registered trademark of NinjaTrader Group, LLC. No NinjaTrader company has any affiliation with the owner, developer, or provider of the products or services described herein, or any interest, ownership or otherwise, in any such product or service, or endorses, recommends or approves any such product or service.