Some traders focus solely on trends, ignoring analytical conditions within consolidation periods. Flat market conditions represent a distinct market structure that trend-focused approaches may not fully account for. Flat trading requires different rules as prices remain in a narrow range, often with low liquidity. The combination of WPR + ADX indicators allows traders to evaluate market conditions during periods of low directional movement.
The Williams Percent Range (WPR) measures where the current price sits within the recent high-low range, expressed as a percentage, considered as 100%. A special feature of the WPR indicator is its inverted scale. If the price is at the upper limit of the range, the indicator indicates the value 0, and if at the lower limit, then it indicates -100%. If the indicator line crosses the -80 level from bottom to top, this reflects a shift from compressed to expanding momentum in an upward direction. Consequently, crossing the -20 level from top to bottom reflects a shift from compressed to expanding momentum in a downward direction.
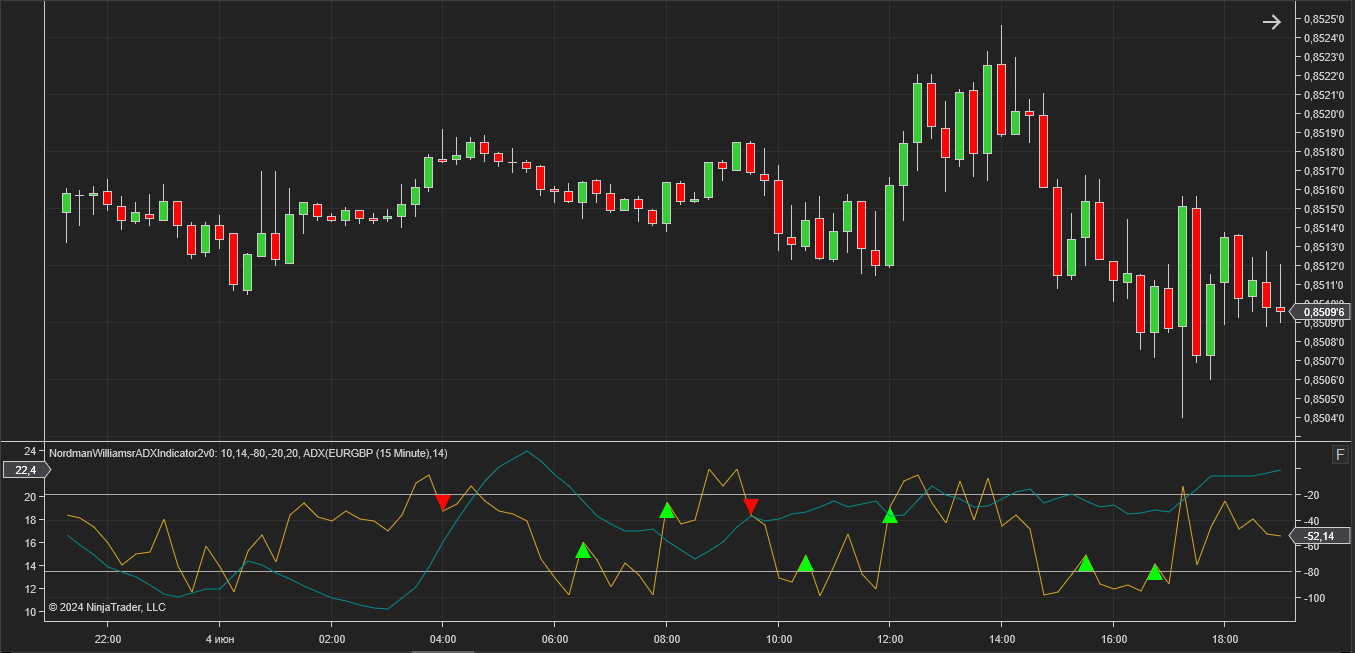
If the market is in a flat, then after crossing the level -80 from bottom to top or -20 from top to bottom, price has historically tended to move toward the opposite boundary of the range. However, in the presence of a trend, analytical conditions may emerge when price retraces after a strong directional move. The ADX indicator allows you to filter out such WPR conditions.
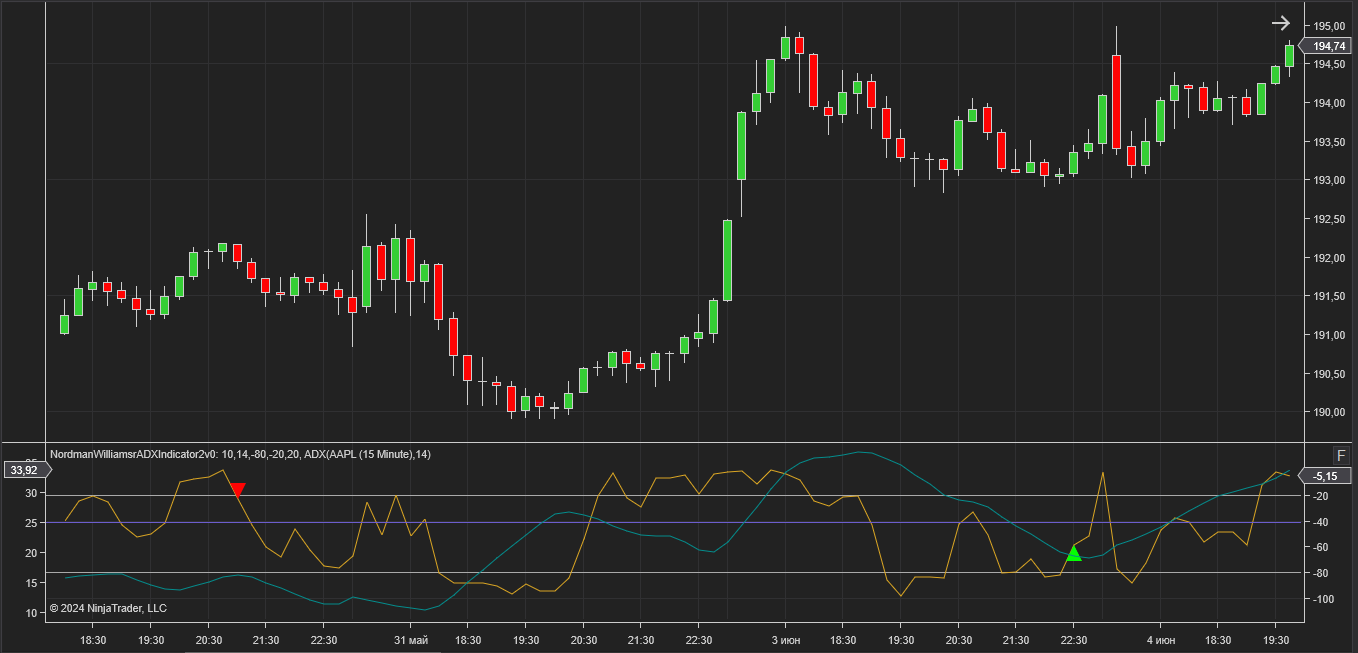
The ADX indicator consists of three lines: a positive component PDI (Plus Direction Index), a negative component MDI (Minus Direction Index), the third line, called the ADX line, shows the ratio of these components. The ADX line is independent of the direction of price movement, but only on the strength of its movement. Thus, the ADX line will allow you to detect trend and flat intervals in the market, regardless of their direction. The 25 threshold reflects an empirically observed boundary in ADX behavior: below this level, the directional components PDI and MDI tend to remain close to each other, indicating that neither buying nor selling pressure is dominant. This makes ADX < 25 a structurally meaningful reference for identifying consolidation — not an arbitrary cutoff, but a level at which the balance between directional forces is effectively neutral. When the ADX value reaches approximately 25, there is a flat in the market, which is a market context where the WPR indicator operates within its intended parameters.
The indicator allows for customisation of notification settings by choosing how you want to receive notifications: for audio notifications (with the ability to select a sound file), email messages, or pop-ups.
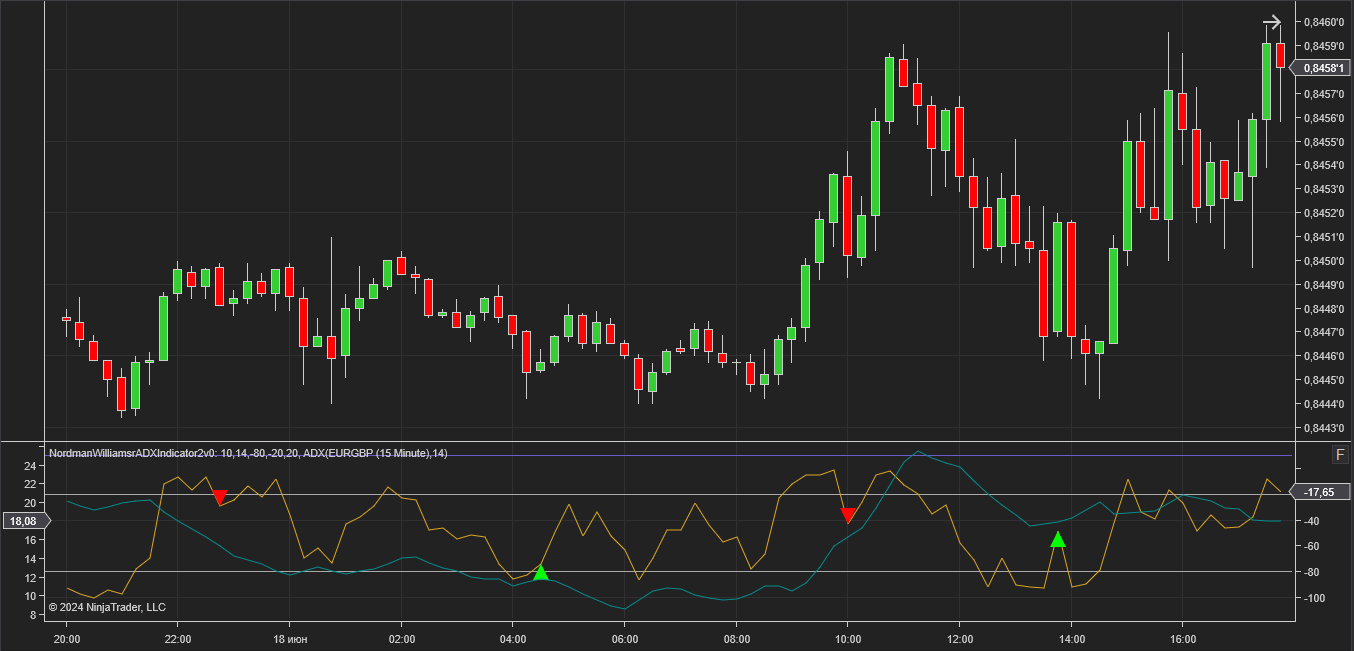
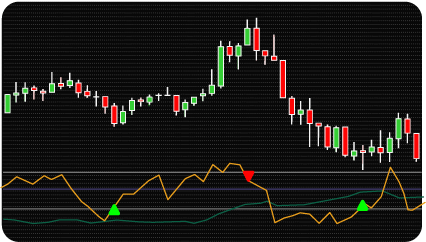
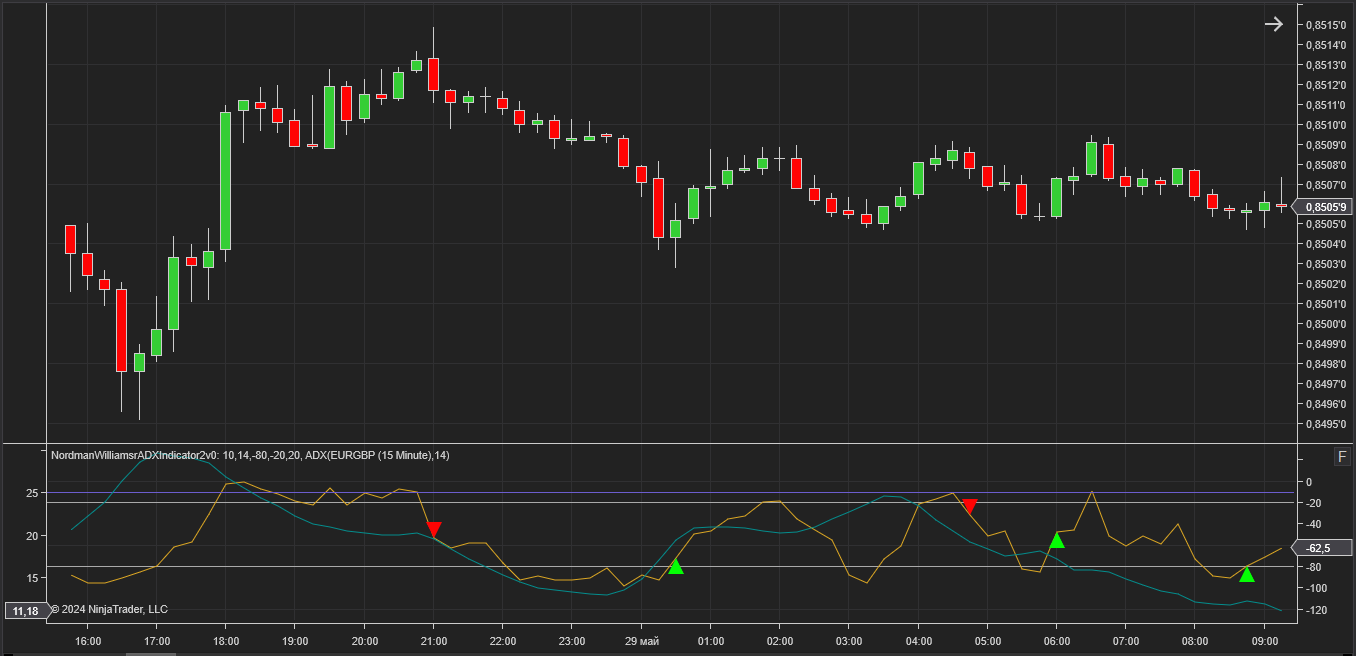
The NinjaTrader WPR + ADX Indicator displays in a separate subwindow the line of the WPR oscillator and its levels that determine overbought / oversold zones: on top – level -20 (above this level there is an overbought zone ), below – level -80 (below this level there is an oversold zone).
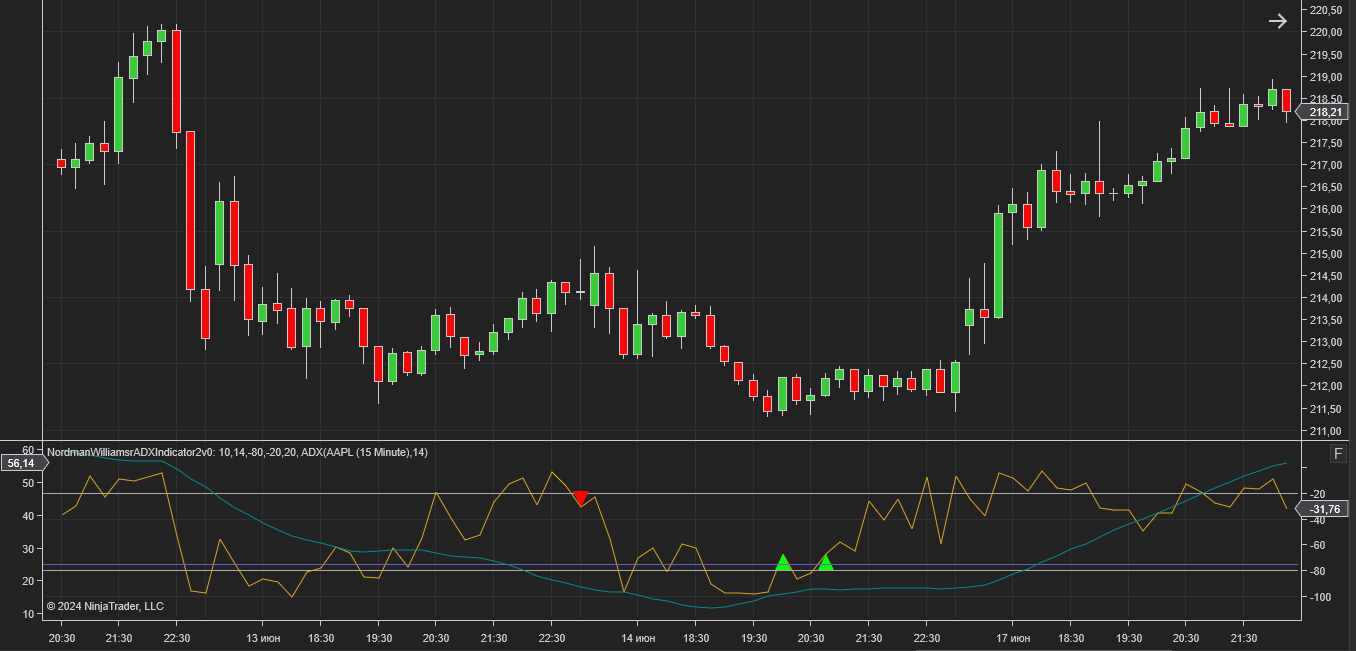
The WPR line crossing the -80 level from bottom to top when the ADX indicator value is less than 25 registers an upward condition for further evaluation. Accordingly, the WPR line crossing the -20 level from top to bottom with an ADX value of up to 25 registers a downward condition.
Indicator Limitations. The WPR + ADX indicator is designed specifically for consolidation conditions. In trending markets — where ADX rises above 25 and directional movement becomes dominant — the WPR component may generate frequent threshold crossings that reflect trend momentum rather than range reversals. The indicator does not assess the strength or duration of a consolidation period, does not account for sudden volatility expansions or news-driven breakouts, and does not predict how far price will move within or beyond the range. All registered conditions should be evaluated within the trader’s own analytical framework.
The indicator has the following parameters:
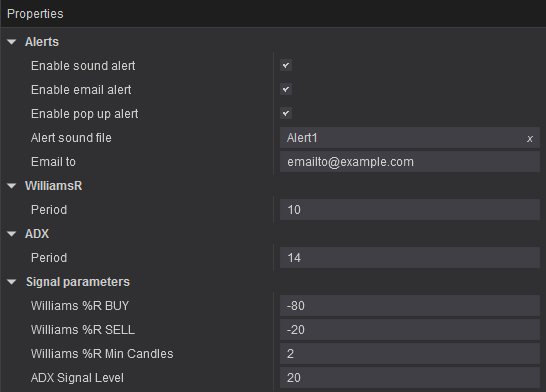
Alerts – setting up various types of alerts.
Williams_%R_BUY – setting the oversold level value.
Williams_%R_SELL – setting the overbought level value.
Williams_%R_Min_Candles – minimum number of bars of Williams Percent Range is above/below zone -20/-80.
ADX_Signal_Level – setting the value of the ADX level, at which the market state is determined as flat.

We can customize this indicator to your needs — adding functions, modifying logic, or integrating it with other tools for your workflow.
We also convert indicators into Automated Trading Strategies with advanced functions (trailing stops, risk management, filters) tailored to your trading style strictly according to your specifications.
Request a free consultation to discuss the technical scope and timeline of your project.
We are committed to the ongoing development and refinement of our indicators. If you’ve spotted a bug, feel that something essential is missing, or have ideas that could make the indicator even better, just send us a message. Your feedback helps us improve and deliver tools that truly meet traders’ needs.
Nordman Algorithms is a trade name of Nordman Algorithms OÜ (Reg. No. 14435535), registered in Tallinn, Estonia.
Software Nature & User Responsibility — Nordman Algorithms provides algorithmic software tools for technical analysis. Nordman Algorithms is not a financial advisor and is not liable for any losses. All trades conducted based on the software’s output are executed at the user’s sole discretion and risk.
Visual Markers & Signal Disclosure — This software may display visual markers (such as arrows, dots, or alerts) when predefined mathematical conditions are met. These markers are provided for educational and analytical purposes only, must not be interpreted as financial guidance, and do not constitute a recommendation to buy, sell, or hold any financial instrument. Users must independently validate all visual cues within their own trading methodology.
No Financial Advice — Nordman Algorithms does not provide discretionary trading signals, investment advice, or managed signal services. Our software represents a mathematical visualization of historical and real-time data. The appearance of a visual marker does not guarantee a profitable trade or predict future market behavior.
Trading Risk Warning — Futures, Forex, and options trading involve significant risk. Risk capital is money that can be lost without jeopardizing financial security. Only risk capital should be used for trading. Past performance is not indicative of future results. View Full Risk Disclosure: https://www.nordman-algorithms.com/risk-disclosure/
ESMA Risk Warning — Financial instruments, especially those involving leverage such as CFDs and Forex, are complex and carry a high risk of rapid financial loss. Our software provides analytical outputs and visual markers based on predefined mathematical conditions and does not mitigate or reduce inherent market risks. You should carefully consider whether you understand how leveraged financial instruments work and whether you can afford the high risk of losing your capital.
CFTC Rule 4.41 — Hypothetical or simulated performance results have inherent limitations. Unlike actual performance records, simulated results do not represent real trading. Because trades have not actually been executed, these results may under- or over-compensate for the impact of market factors such as liquidity. No representation is being made that any account will achieve profits or losses similar to those shown.
Trademark Notice — NinjaTrader® is a registered trademark of NinjaTrader Group, LLC. No NinjaTrader company has any affiliation with the owner, developer, or provider of the products or services described herein, or any interest, ownership or otherwise, in any such product or service, or endorses, recommends or approves any such product or service.