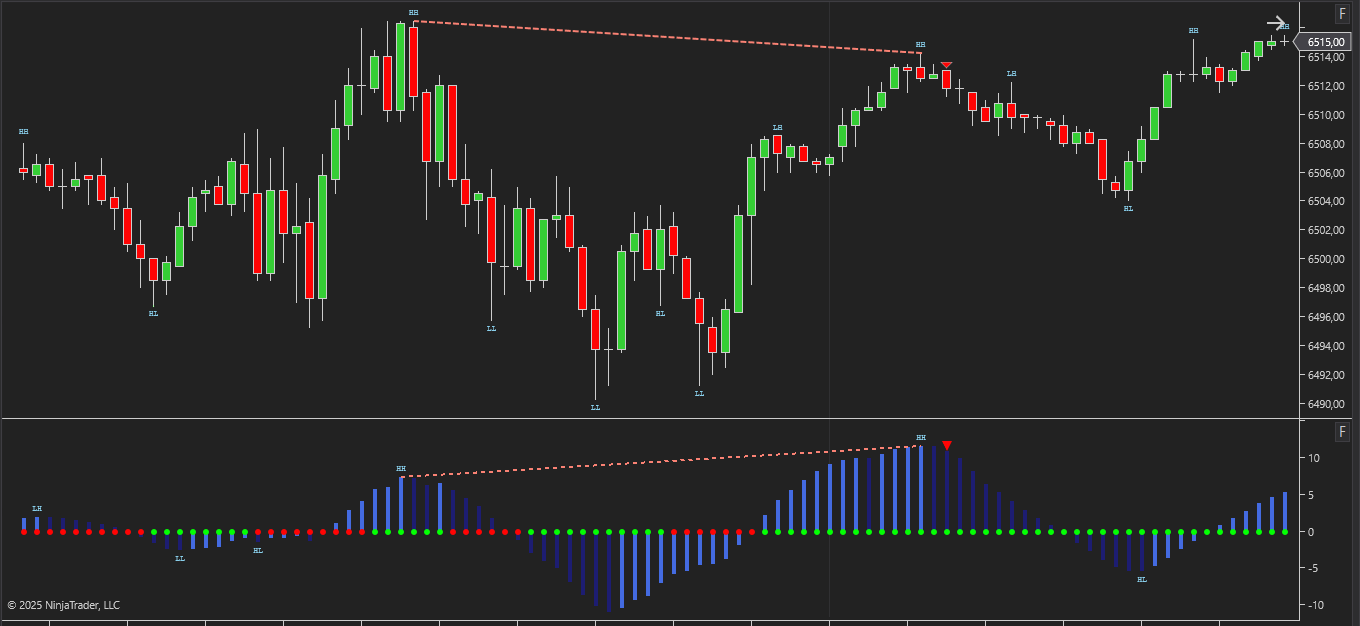
The NinjaTrader TTM Squeeze Divergence Indicator is based on the concept of the classic TTM Squeeze, which combines volatility and market pressure analysis. Unlike the standard version, however, this tool focuses on identifying divergences between price action and momentum, providing traders with a deeper view of market dynamics.
The indicator’s methodology is built on two key analytical steps:
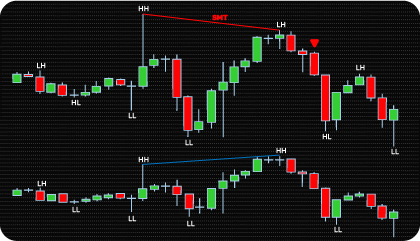
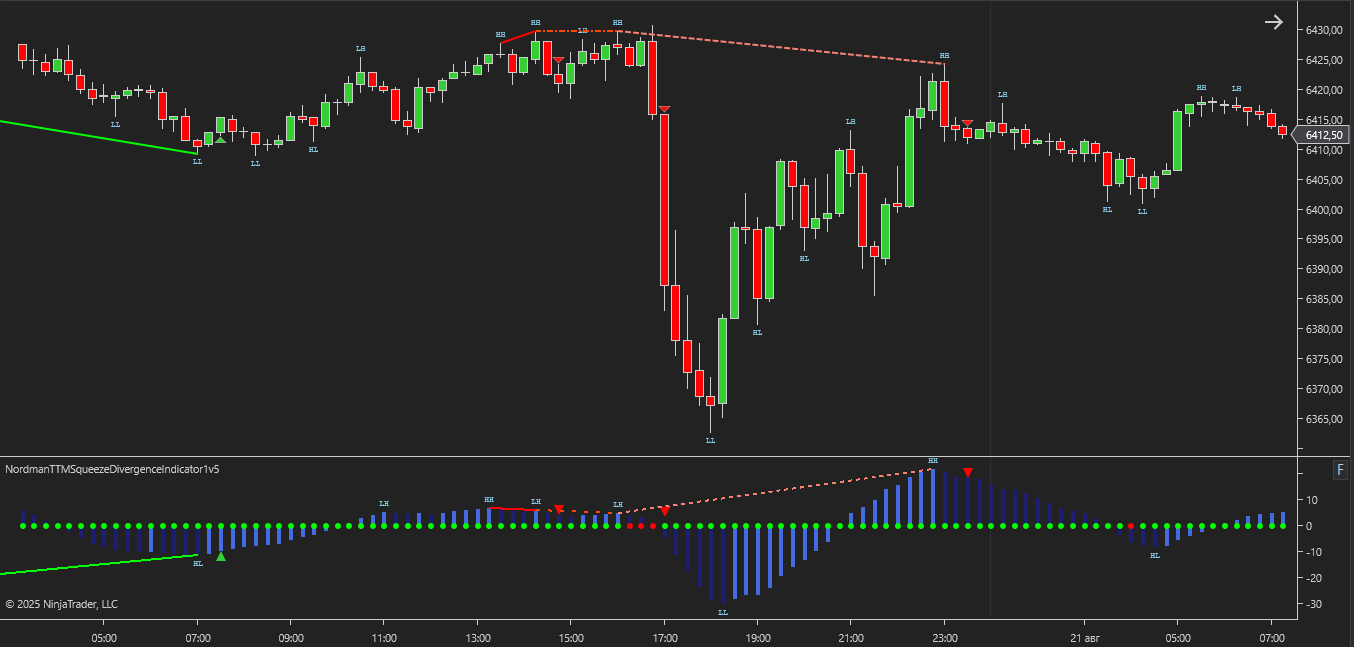
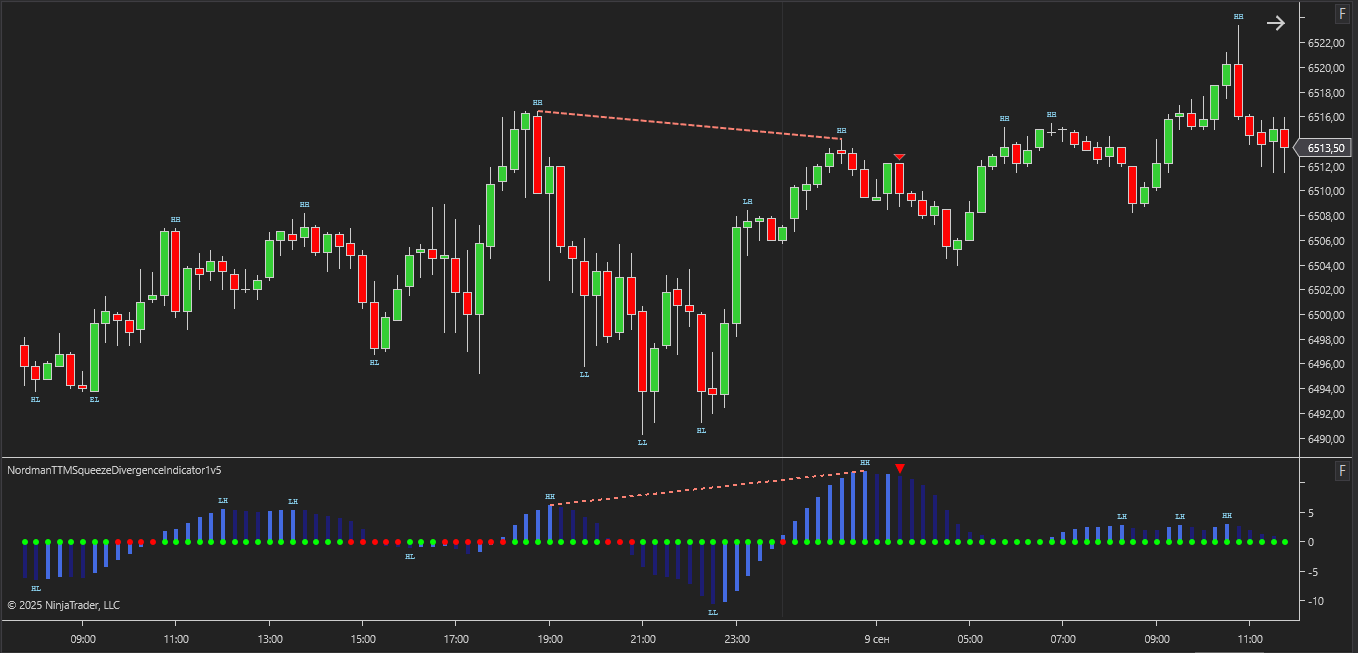
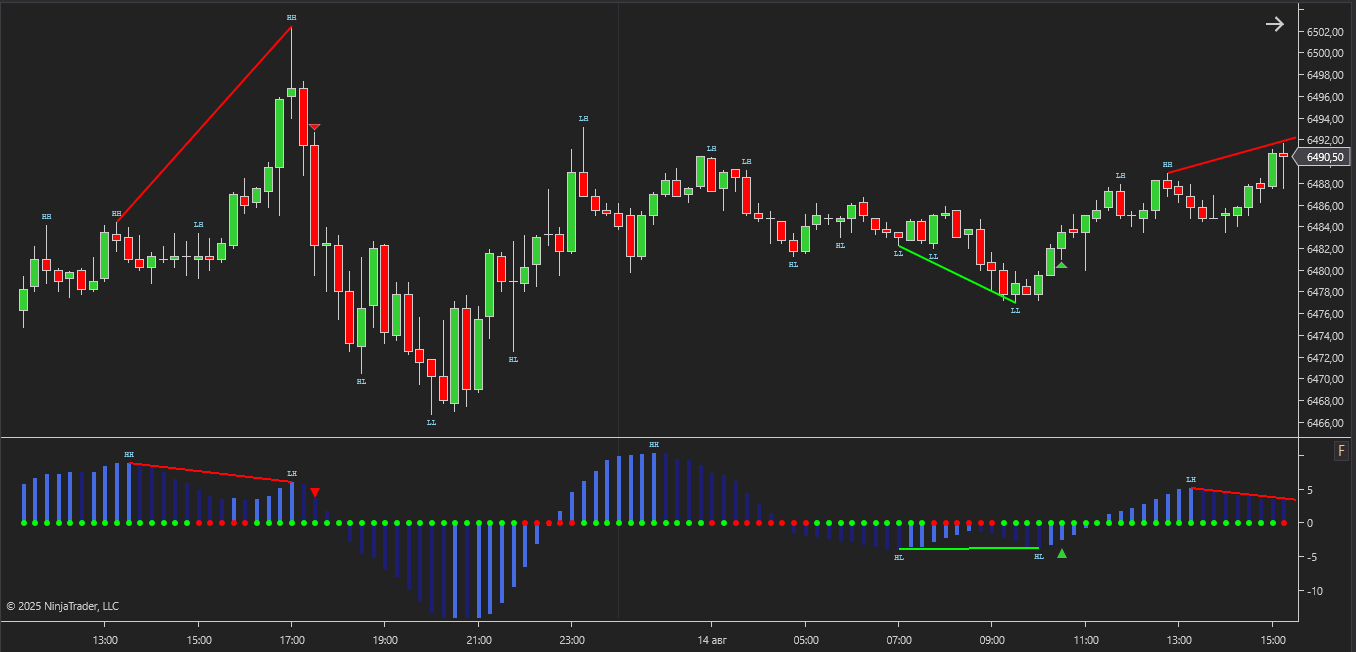
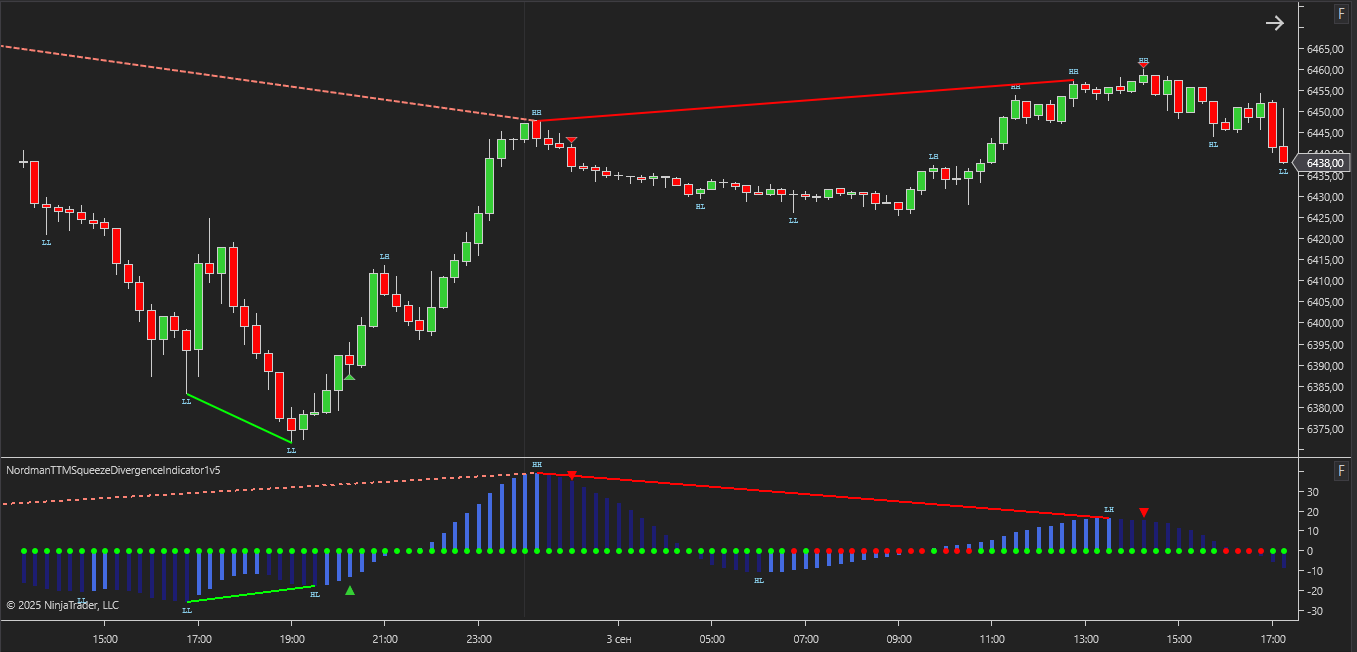
The indicator identifies three types of divergence:
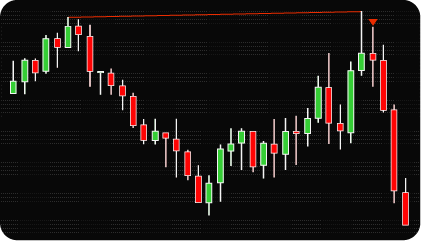
The primary purpose of the indicator is to help traders spot critical moments when price action diverges from momentum. Such discrepancies highlight potential areas where momentum may be shifting, assisting in the systematic evaluation of trend sustainability.
Compared to the standard TTM Squeeze Indicator, this version goes beyond identifying market squeezes and expansions — it incorporates divergence analysis. This makes the tool valuable not only for monitoring consolidation phases but also for evaluating the internal dynamics and sustainability of price movements.
In practice, the TTM Squeeze Divergence Indicator for NinjaTrader helps traders address a common challenge: recognizing potential momentum exhaustion and identifying inconsistent price-momentum relationships. By combining volatility analysis with divergence detection, it provides a comprehensive framework for the systematic observation of market structure.
The TTM Squeeze Divergence Indicator combines two powerful methods of technical analysis: volatility compression/expansion (the TTM Squeeze concept) and divergence detection between price and momentum. Understanding how these elements interact is essential for the consistent interpretation of market structural events.
The Squeeze concept
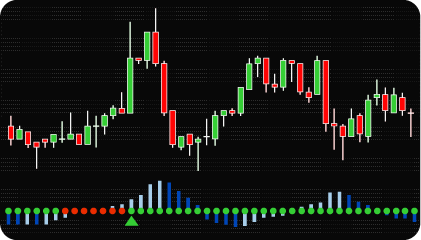
The foundation of the indicator is the TTM Squeeze setup, which measures volatility by comparing Bollinger Bands and Keltner Channels:
On the indicator panel, this state is visualized with small dots plotted on the zero line:
Integrating Divergence Analysis
The added value of the TTM Squeeze Divergence Indicator lies in combining volatility compression events with divergence detection. These occurrences highlight phases when price action and momentum move in opposite directions, identifying points of inconsistent market momentum and potential exhaustion.
Trading conditions
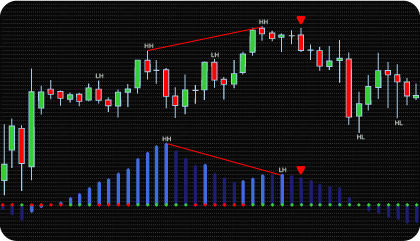
For a valid trade setup, three conditions should align:
When all three factors coincide, the indicator identifies a structured confluence that confirms alignment between volatility expansion, divergence detection, and momentum analysis. This multi-layered approach highlights periods of high-probability structural shifts.
The indicator has the following parameters:
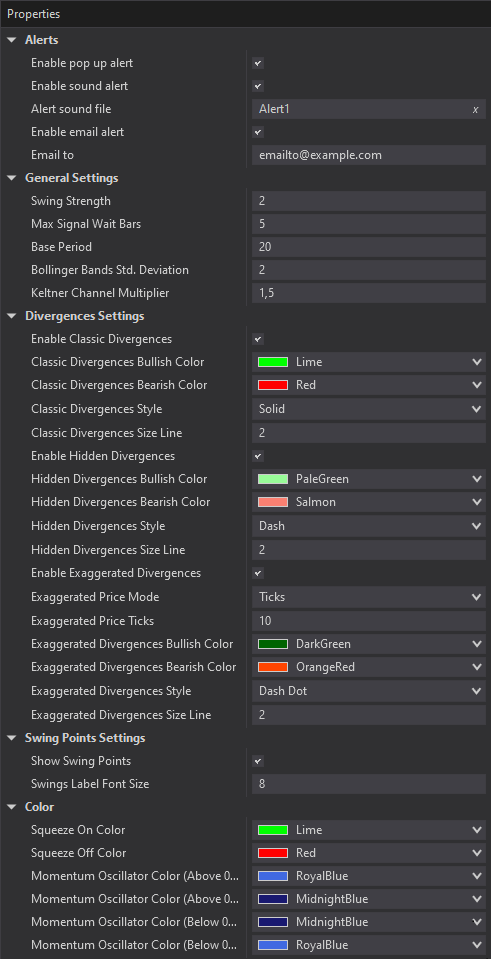
Alerts – Configure various types of alerts.
Swing Strength – Defines the number of bars the indicator considers when identifying local highs and lows based on fractal logic. A higher value increases the strictness of the swing definition, as the extreme must be surrounded by more bars with lower highs (for a top) or higher lows (for a bottom). This parameter directly influences the sensitivity of divergence detection.
Max Signal Wait Bars – Defines the maximum bars the indicator waits after divergence detection for all confluence conditions to align (volatility status + momentum direction).
Base Period – Number of bars used to calculate Bollinger Bands and Keltner Channel.
Bollinger Bands Std. Deviation – Standard deviation multiplier applied to Bollinger Bands.
Keltner Channel Multiplier – Multiplier applied to Keltner Channel for squeeze detection.
Divergences Settings – Configuration for enabling/disabling specific divergence types (classic, hidden, exaggerated) and customizing their visual style (line color, type, and size).
Show Swing Points – Enables or disables the display of Swing Points on the chart.
Swing Label Font Size – Adjusts the font size for Swing Point labels.

We can customize this indicator to your needs — adding functions, modifying logic, or integrating it with other tools for your workflow.
We also convert indicators into Automated Trading Strategies with advanced functions (trailing stops, risk management, filters) tailored to your trading style strictly according to your specifications.
Request a free consultation to discuss the technical scope and timeline of your project.
We are committed to the ongoing development and refinement of our indicators. If you’ve spotted a bug, feel that something essential is missing, or have ideas that could make the indicator even better, just send us a message. Your feedback helps us improve and deliver tools that truly meet traders’ needs.
The indicator provides a set of exposed analytical plot outputs designed for structured integration with third-party strategy builders and automation tools such as BloodHound and BlackBird (SharkIndicators), as well as other algorithmic trading environments.
| Analytical Plot Name | Output Values | Description |
| Momentum | Value | |
| SqueezeOn | Value | |
| SqueezeOff | Value | |
| Bearish | > 0 | Bearish directional detection condition. |
| Bearish Hidden | > 0 | Bearish directional detection condition. |
| Bearish Exaggerated | > 0 | Bearish directional detection condition. |
| Bullish | > 0 | Bullish directional detection condition. |
| Bullish Hidden | > 0 | Bullish directional detection condition. |
| Bullish Exaggerated | > 0 | Bullish directional detection condition. |
Plot output names and descriptions are technical identifiers intended solely for software integration purposes and do not constitute trading advice, signals, or recommendations.
Nordman Algorithms is a trade name of Nordman Algorithms OÜ (Reg. No. 14435535), registered in Tallinn, Estonia.
Software Nature & User Responsibility — Nordman Algorithms provides algorithmic software tools for technical analysis. Nordman Algorithms is not a financial advisor and is not liable for any losses. All trades conducted based on the software’s output are executed at the user’s sole discretion and risk.
Visual Markers & Signal Disclosure — This software may display visual markers (such as arrows, dots, or alerts) when predefined mathematical conditions are met. These markers are provided for educational and analytical purposes only, must not be interpreted as financial guidance, and do not constitute a recommendation to buy, sell, or hold any financial instrument. Users must independently validate all visual cues within their own trading methodology.
No Financial Advice — Nordman Algorithms does not provide discretionary trading signals, investment advice, or managed signal services. Our software represents a mathematical visualization of historical and real-time data. The appearance of a visual marker does not guarantee a profitable trade or predict future market behavior.
Trading Risk Warning — Futures, Forex, and options trading involve significant risk. Risk capital is money that can be lost without jeopardizing financial security. Only risk capital should be used for trading. Past performance is not indicative of future results. View Full Risk Disclosure: https://www.nordman-algorithms.com/risk-disclosure/
ESMA Risk Warning — Financial instruments, especially those involving leverage such as CFDs and Forex, are complex and carry a high risk of rapid financial loss. Our software provides analytical outputs and visual markers based on predefined mathematical conditions and does not mitigate or reduce inherent market risks. You should carefully consider whether you understand how leveraged financial instruments work and whether you can afford the high risk of losing your capital.
CFTC Rule 4.41 — Hypothetical or simulated performance results have inherent limitations. Unlike actual performance records, simulated results do not represent real trading. Because trades have not actually been executed, these results may under- or over-compensate for the impact of market factors such as liquidity. No representation is being made that any account will achieve profits or losses similar to those shown.
Trademark Notice — NinjaTrader® is a registered trademark of NinjaTrader Group, LLC. No NinjaTrader company has any affiliation with the owner, developer, or provider of the products or services described herein, or any interest, ownership or otherwise, in any such product or service, or endorses, recommends or approves any such product or service.