NinjaTrader Fractal Breakout Indicator
NinjaTrader Fractal Breakout Indicator is an analytical tool designed for the technical study of recurring price fluctuations — fractals. The indicator marks the peaks of all found fractals on the chart, as well as breakout points at the price levels of these fractals. Depending on the settings, the chart can display all breakout points or only those that correspond to the trend determined by the moving average.
Already a subscriber or have purchased a product?
What the Fractal Breakout Indicator Does
NinjaTrader Fractal Breakout Indicator uses fractals to analyze price fluctuations. Fractals display not only local highs and lows on the chart, but also allow you to determine important support and resistance levels, which helps provide additional context for price analysis.
A fractal is a cluster of several bars, where surrounding bars form a structure around a central high or low point, which represents the top or bottom of the fractal. Thus, there are upper fractals and lower fractals.
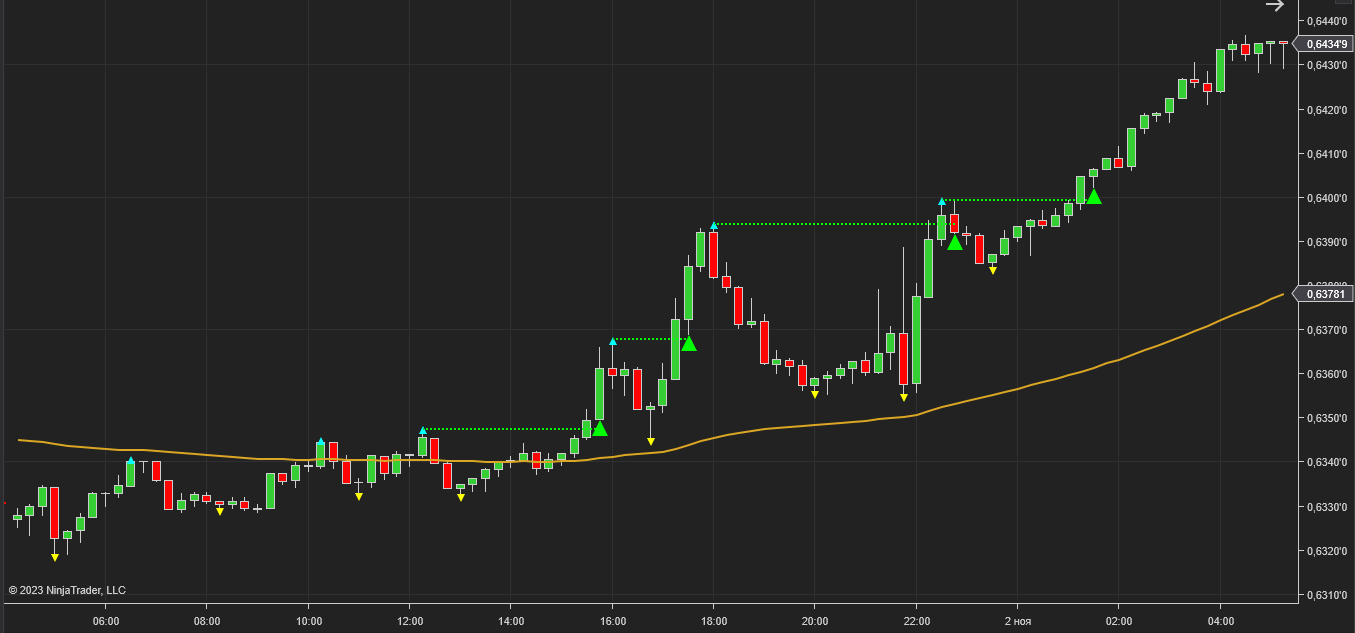
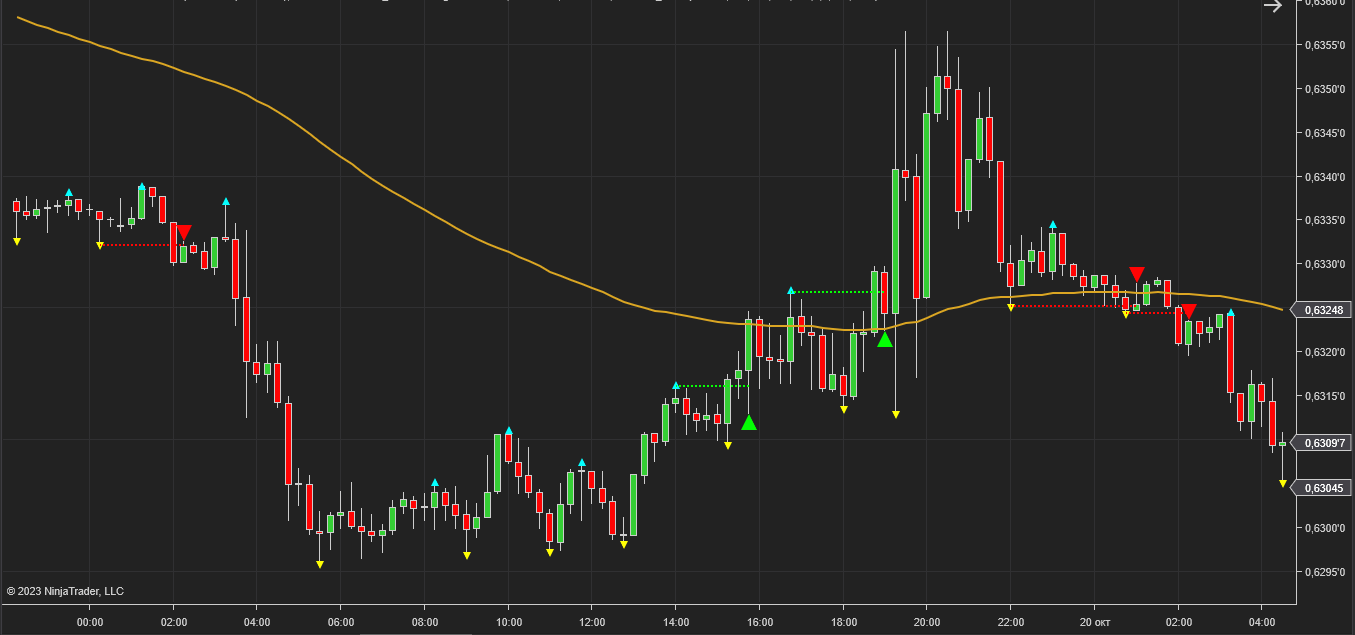
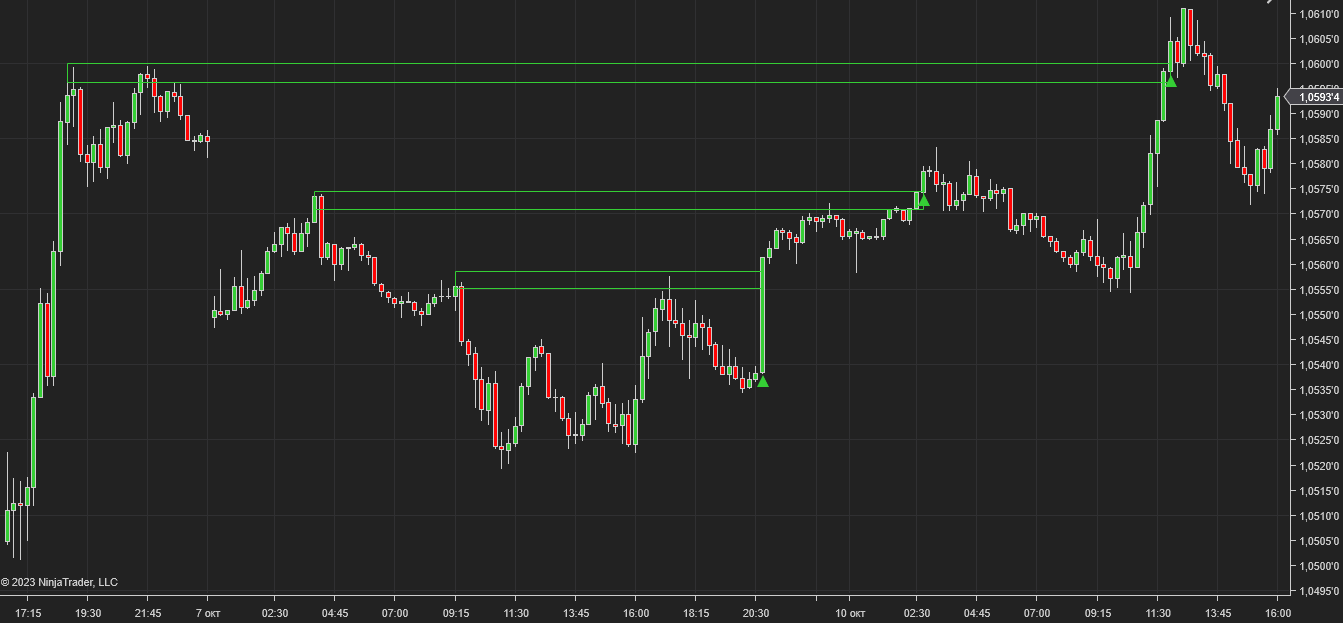
Upper fractals (peaks) are marked by triangles directed upward and located at the level of the maximum price of the bar. Lower fractals (troughs) are marked by triangles pointing down and located at the level of the minimum price of the bar. Fractals indicate the minimums and maximums reached by the market over a certain period, visually highlighting them with directional indicators (triangles).
Fractal structures are commonly used in technical analysis to identify local price extremes. These levels often act as reference zones where liquidity may concentrate, making them relevant for breakout analysis.
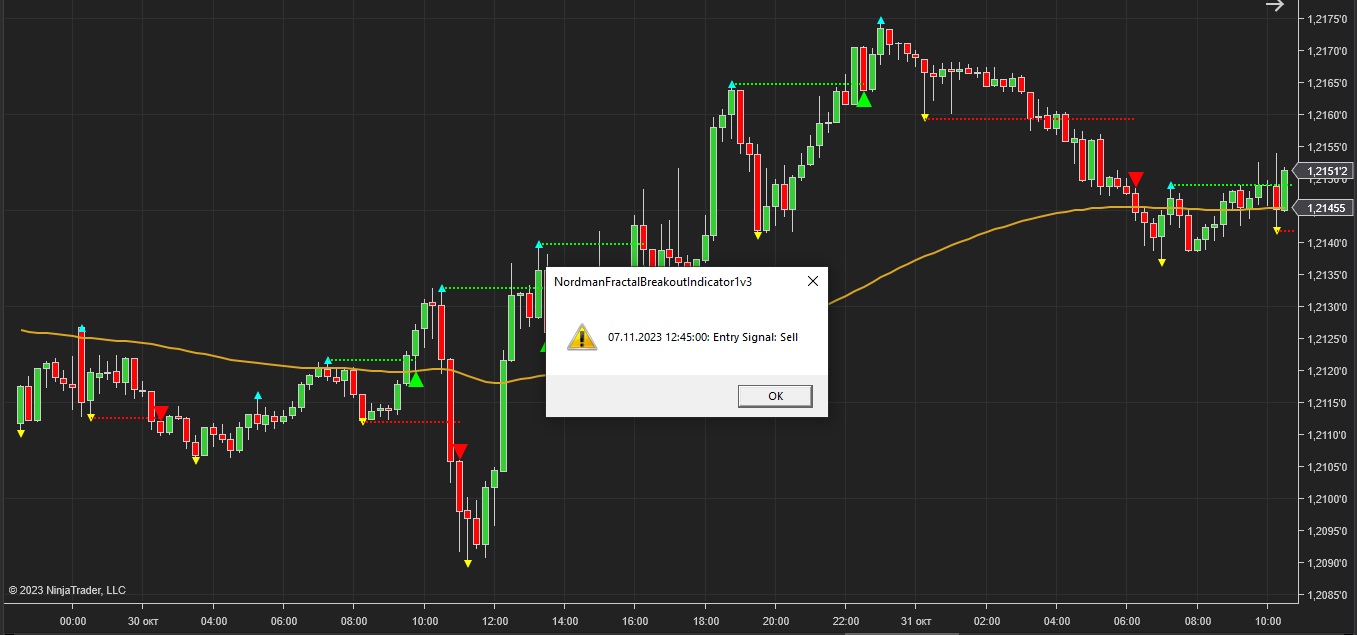
After detecting the next fractal, the indicator monitors its level. If the price breaks the level of the last upper fractal from the bottom up, this place is marked on the chart as an upward breakout — indicated by a green visual marker (arrow) pointing upward and located below the bar on which the breakout was detected. The price crossing the level of the last lower fractal from top to bottom, that is, a downward breakout, is indicated by a red visual marker (arrow) pointing down and located above the bar.
To clearly associate each breakout with its corresponding fractal level, the indicator draws a horizontal line from the point of the breakout to the top of the corresponding fractal. The levels of upper fractals (pierced from bottom to top) are green, the levels of lower fractals (pierced from top to bottom) are colored red.
If you enable filtering by the moving average in the indicator settings, this average will be displayed on the chart. In this case, the chart will display breakouts only in the direction based on price position relative to the moving average — that is, the position of the price relative to the average. Upward breakouts are only shown on the chart if they occur above the average, and downward breakouts are only displayed if they occur below the average.
To ensure important breakout events are not overlooked, the indicator provides settings for various types of alerts.
Fractal-based analysis reflects historical price structure and does not predict future price movement. Breakout conditions identified by the indicator should be interpreted within a broader market context, including trend structure, volatility, and surrounding price levels.
How to Interpret and Use the Fractal Breakout Indicator
The most common market theory explains price changes as the interaction of two opposing forces: buyers and sellers. Buyers, providing demand, contribute to higher prices. Sellers, on the contrary, by making offers, help reduce prices. Due to the inertia of market processes, these forces cannot reach equilibrium, as a result of which the price makes oscillatory movements. If the influence of one of the forces significantly exceeds the influence of the other, the second force retreats, and the price makes a strong movement (breakout) with a transition to another price level. Further fluctuations are made within the limits of new price levels, until another breakout occurs and the price makes another significant change.
Fractals highlight structural levels that, when breached, may reflect a shift in local market momentum. Thus, a price breakout of the upper fractal level marks a potential upward breakout condition. Conversely, a price breakout of the lower fractal level marks a potential downward breakout condition.
When a breakout is detected, the indicator provides three types of notifications: a text message window, an audio alert, or an email. Moreover, notification can be made both on formed and on emerging bars.
Formed bars
When working on formed bars, the trader is notified of a level breakout only after the bar closes, which is a more conservative way to identify a breakout condition.
Emerging bars
Tracking breakouts on emerging bars allows you to identify a breakout condition in real-time, providing immediate visual feedback on current market dynamics.
Indicator Settings & Parameters
Full parameter reference, grouped by configuration area.
| Parameter | Description |
|---|---|
| Fractal Detection | |
| Fractal | Setting fractal parameters. |
| Bar signal | Displays the visual marker on a formed bar or the current one. |
| Trend Filter | |
| Use Trend MA Filter | On/off using a moving average as a confirmation filter. |
| Moving Average | Settings for moving average parameters — used as a confirmation filter. |
| Alerts | |
| Alerts | Setting up various types of alerts. |
Plot Outputs for Strategy Builder & Automation
The indicator provides a set of exposed analytical plot outputs designed for structured integration with third-party strategy builders and automation tools such as BloodHound and BlackBird (SharkIndicators), as well as other algorithmic trading environments.
Breakout Direction
- Long> 0
- Short> 0
Fractal Levels
- UpFractalValue
- DownFractalValue
- LongFractalValue
- ShortFractalValue
Trend Filter
- MAValue
Plot output names are technical identifiers intended solely for software integration purposes and do not constitute trading advice, signals, or recommendations.
System Requirements & Installation
What you need to run the indicator, how to download and install it in NinjaTrader 8, and how the license works.
System Requirements
- Platform
- NinjaTrader 8 (Desktop)
- Operating system
- Windows 10 or Windows 11
- Instruments
- Futures, forex, stocks and ETFs supported by NinjaTrader
- Data
- NinjaTrader’s native data connections
Not available on NinjaTrader Web or Mobile. NinjaScript indicators run in NinjaTrader Desktop only.
License Terms
- Lifetime License
- This indicator only, 1 PC, one-time payment, free updates included.
- All-Access Subscription
- All indicators and trade copiers, billed monthly, cancel anytime, updates included while the subscription is active.
- Free trial
- 5 days on the subscription plan. If not cancelled, the subscription starts automatically.
- License binding
- Linked to your email and to the computer on which it was first activated.
- Moving to another computer
- Available on request through support.
Installation
- Get access
Start the free trial, subscribe, or buy a lifetime license on this page.
- Download
The indicator is not sent by email. Open (top right of this page) and enter the email you used for your trial, subscription or purchase. The installation file (.zip) downloads to your computer.
- Import into NinjaTrader 8
In the Control Center, go to
Tools → Import → NinjaScript Add-Onand select the downloaded .zip file. Do not unzip it. - Add to a chart
Open a chart, click Indicators, select the indicator from the list and apply it.
- Activate the license
In the indicator settings, enter the same email. On first activation, the license is linked to that email and to your computer.
Updating: When a new version is released, download it again through and import it the same way over the existing version.
Installation questions? Contact support, Monday to Friday.
Related Products
"Best Seller" and "Trending" reflect Nordman Algorithms sales and usage data, January–September 2026.
Disclaimer — Software Use & Risk Disclosure
Nordman Algorithms is a trade name of Nordman Algorithms OÜ (Reg. No. 14435535), registered in Tallinn, Estonia.
Software Use
Software Nature & User Responsibility — Nordman Algorithms provides algorithmic software tools for technical analysis. Nordman Algorithms is not a financial advisor and is not liable for any losses. All trades conducted based on the software’s output are executed at the user’s sole discretion and risk.
Visual Markers & Signal Disclosure — This software may display visual markers (such as arrows, dots, or alerts) when predefined mathematical conditions are met. These markers are provided for educational and analytical purposes only, must not be interpreted as financial guidance, and do not constitute a recommendation to buy, sell, or hold any financial instrument. Users must independently validate all visual cues within their own trading methodology.
No Financial Advice — Nordman Algorithms does not provide discretionary trading signals, investment advice, or managed signal services. Our software represents a mathematical visualization of historical and real-time data. The appearance of a visual marker does not guarantee a profitable trade or predict future market behavior.
Read the full Terms of Service →Risk Disclosure
Trading Risk Warning — Futures, Forex, and options trading involve significant risk. Risk capital is money that can be lost without jeopardizing financial security. Only risk capital should be used for trading. Past performance is not indicative of future results. An investor could potentially lose all or more than the initial amount committed.
ESMA Risk Warning — Financial instruments, especially those involving leverage such as CFDs and Forex, are complex and carry a high risk of rapid financial loss. Our software provides analytical outputs and visual markers based on predefined mathematical conditions and does not mitigate or reduce inherent market risks. You should carefully consider whether you understand how leveraged financial instruments work and whether you can afford the high risk of losing your capital.
CFTC Rule 4.41 — Hypothetical or simulated performance results have inherent limitations. Unlike actual performance records, simulated results do not represent real trading. Because trades have not actually been executed, these results may under- or over-compensate for the impact of market factors such as liquidity. Simulated results are also subject to the benefit of hindsight. No representation is being made that any account will achieve profits or losses similar to those shown.
Read the full Risk Disclosure →Trademark Notice — NinjaTrader® is a registered trademark of NinjaTrader Group, LLC. No NinjaTrader company has any affiliation with the owner, developer, or provider of the products or services described herein, or any interest, ownership or otherwise, in any such product or service, or endorses, recommends or approves any such product or service.
Need a different setup?
We can customize this indicator to your workflow, or convert it into a fully automated trading strategy with risk management and trailing-stop logic. Fixed-price quote before development begins.