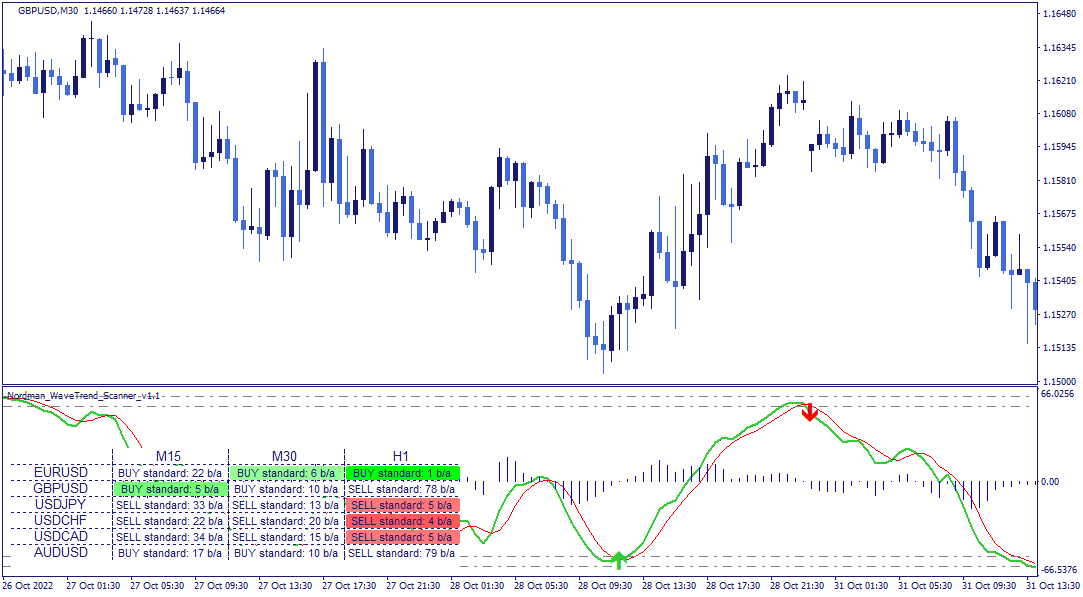
The WaveTrend Indicator is built around an adaptive channel whose width scales with the current volatility of the monitored instrument. The main indicator line reflects the position of price within this channel — positive values indicate price is in the upper half of the channel, negative values indicate it is in the lower half. Because the channel width adapts to volatility, the indicator’s output remains meaningful across different market conditions without requiring manual recalibration. The value range stays approximately within -100 to +100 across most market conditions.
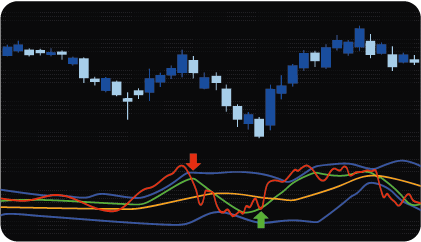
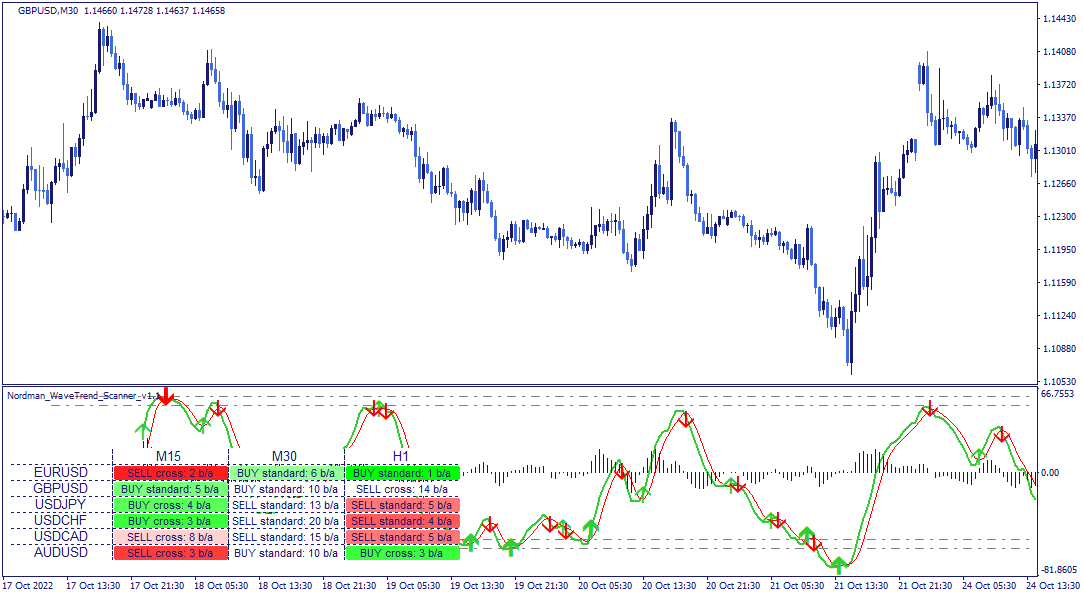
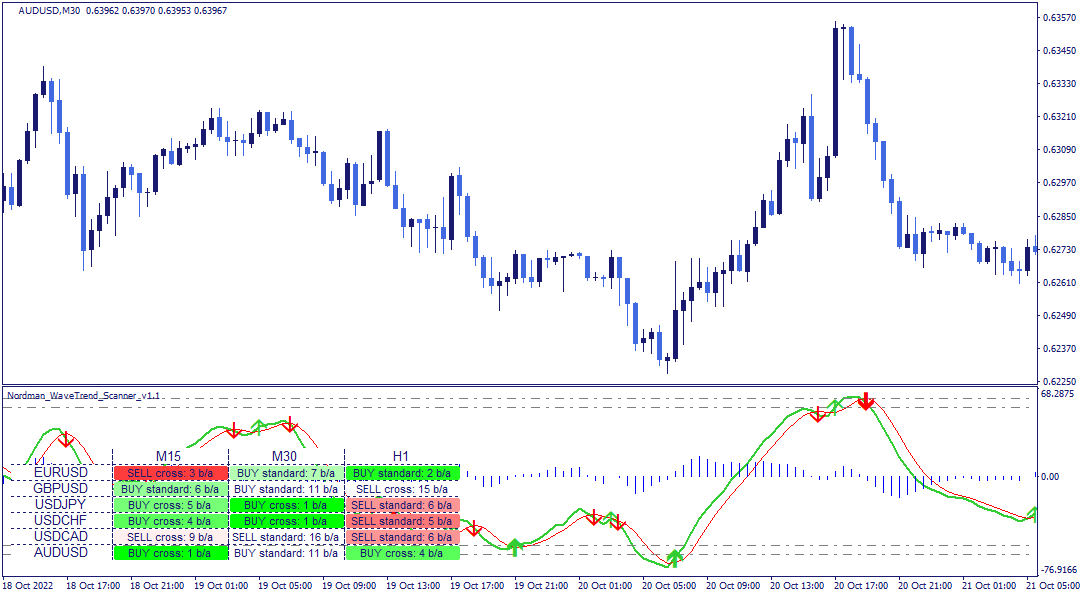
The indicator displays three visual elements: a main line, a signal line, and a histogram showing the difference between them. Crossover points between the main and signal lines are marked with directional markers on the chart.
The indicator evaluates conditions on closed bars only — a directional marker appears only when the bar has fully closed and the crossover condition is definitively met. This means registered conditions do not redraw.
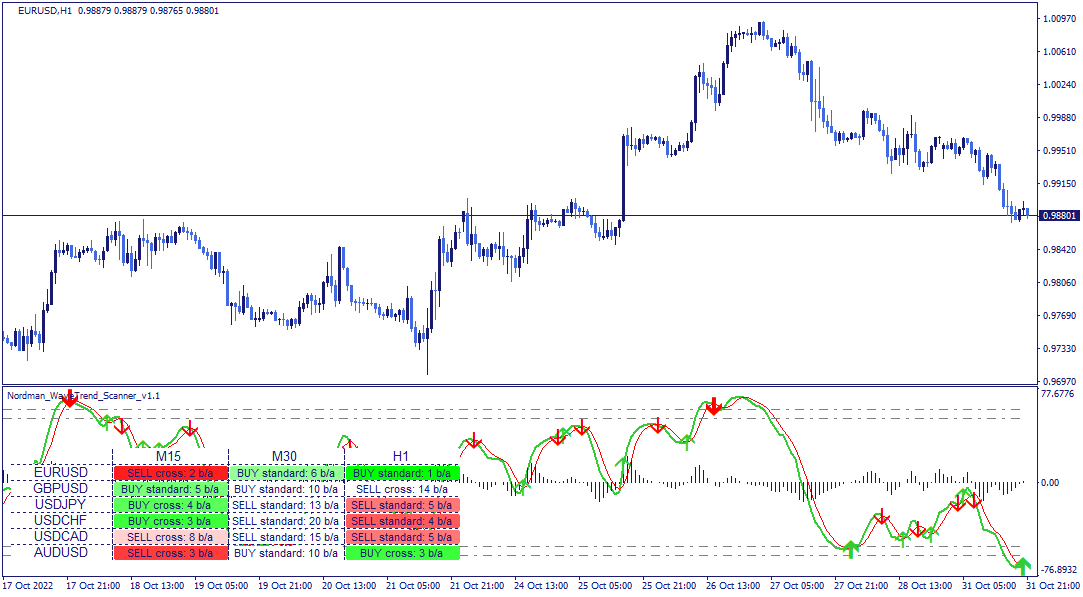
The indicator window displays four horizontal levels organized in two pairs:
Operating range levels — the lower overbought level (upper boundary) and the upper oversold level (lower boundary). These define the zone within which price movement is considered extended relative to the adaptive channel. Crossovers occurring within this zone carry additional structural context in Standard mode.
Critical levels — the upper overbought level and the lower oversold level. These represent more extreme extensions beyond the operating range.
The relationship between the main and signal lines, combined with their position relative to these levels, drives the two detection modes.
The indicator supports two detection modes, which can be enabled independently or simultaneously.
Standard mode — a bullish condition is registered when the main line crosses the signal line from below, provided both lines were below the upper oversold level immediately before the crossover. A bearish condition is registered when the main line crosses the signal line from above, provided both lines were above the lower overbought level immediately before the crossover. This mode restricts condition registration to crossovers that occur within the extended zones — filtering out mid-range crossovers where the lines have not reached a structurally meaningful level.
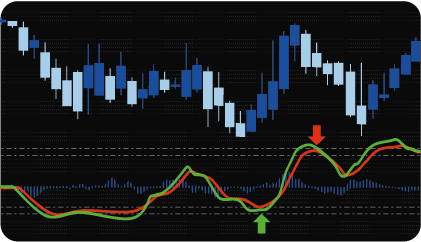
Cross mode — a bullish condition is registered when the main line crosses the signal line from below at any position, regardless of level context. A bearish condition is registered when the main line crosses from above at any position. This mode registers all crossovers without the zone filter applied in Standard mode — producing more frequent conditions with less structural selectivity. When using Cross mode, each registered condition requires additional analytical context before it can be meaningfully evaluated, as mid-range crossovers occur frequently and do not carry the same structural significance as zone-based crossovers.
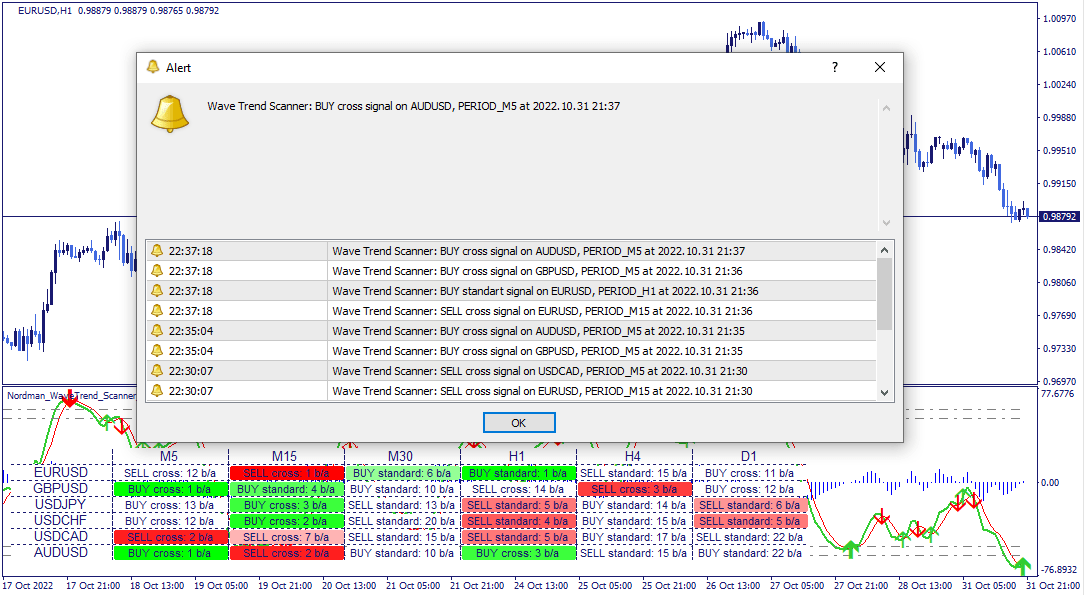
Both modes can be active simultaneously — Standard mode conditions and Cross mode conditions are registered and alerted independently.
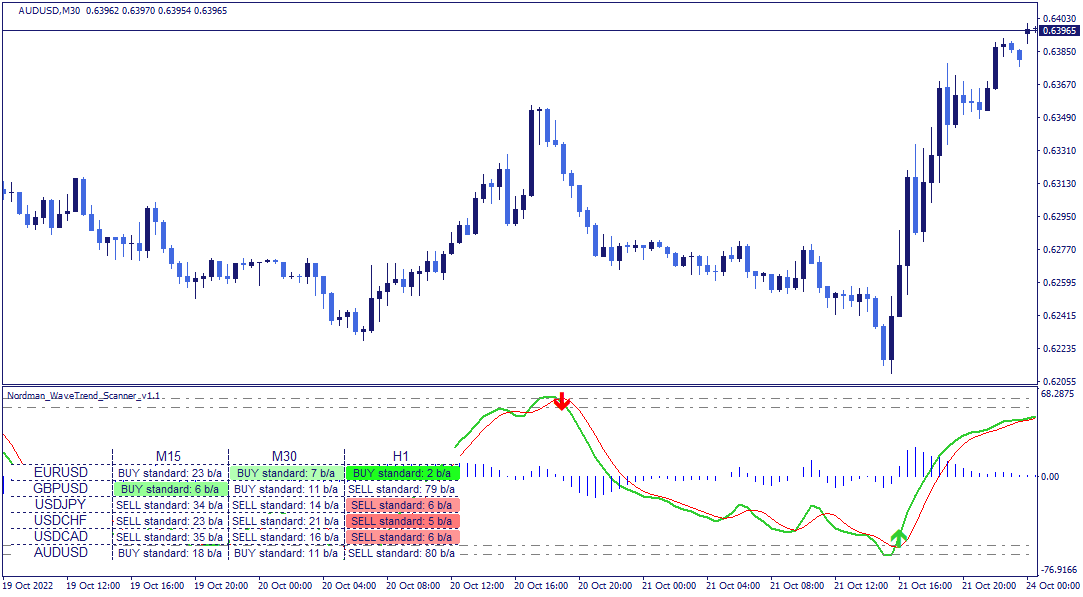
The dashboard displays the current condition status across all monitored assets and timeframes in a single structured view.
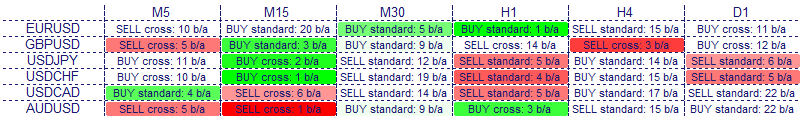
Each cell shows the directional context of the most recently registered condition — bullish or bearish — and the number of bars back at which it was registered. Green cells indicate a bullish condition, red cells a bearish one. Color saturation decreases as the condition becomes less recent. Clicking any cell updates the chart to the corresponding asset and timeframe directly.
All standard timeframes are supported. Monitored instruments must be available in the terminal’s Market Watch window.
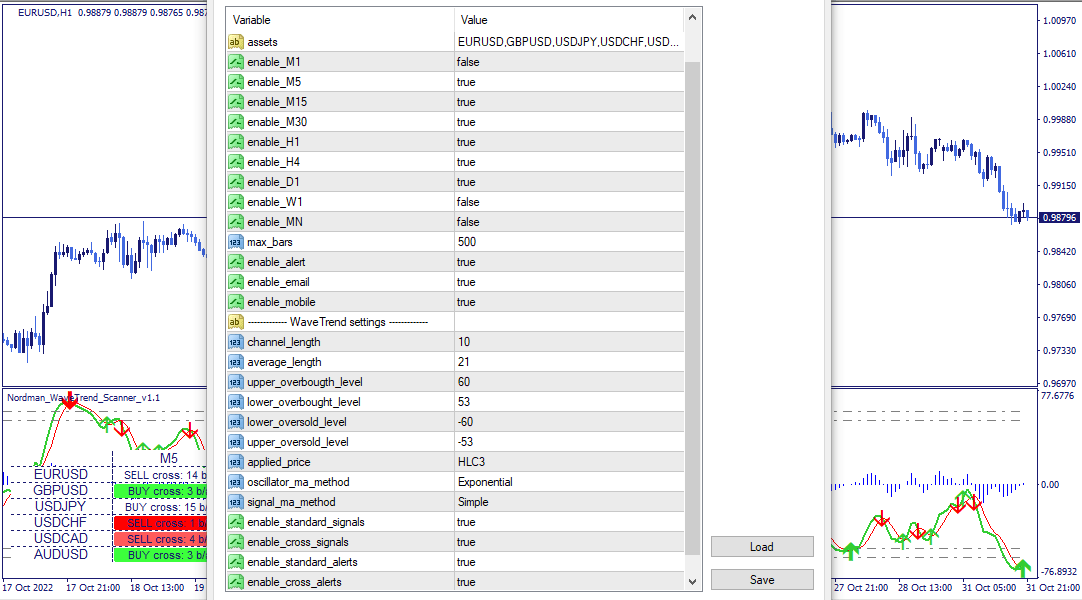
The indicator has the following parameters:
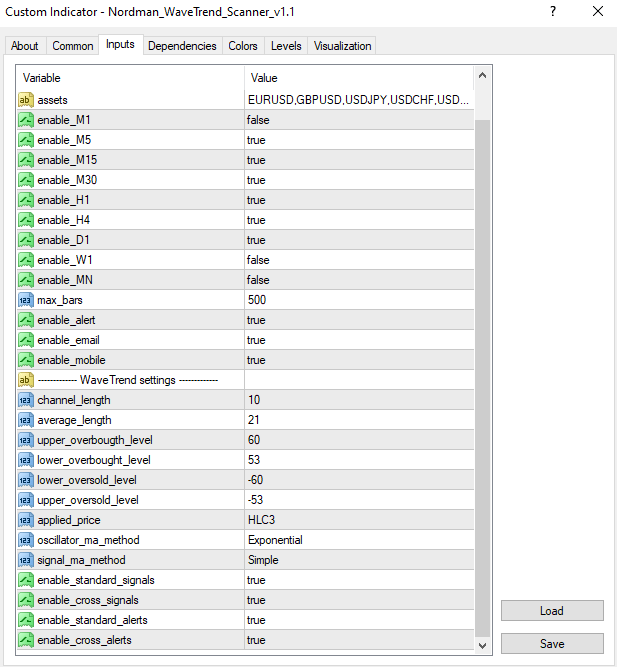
Assets — instruments to include in the scanner.
Enable_M1–MN — include or exclude individual timeframes from the scanner scope.
Max_bars — limits how far back the scanner evaluates conditions. Reducing this value improves calculation speed.
Enable alert / Enable email / Enable mobile — alert delivery: platform notifications, email, or mobile — each configurable independently.
Overbought_level (upper / lower) — configures the upper and lower boundaries of the overbought zone.
Oversold_level (upper / lower) — configures the upper and lower boundaries of the oversold zone.
Applied_price — price type used for calculations: OPEN, HIGH, LOW, CLOSE, HL2, HLC3, or OHLC4.
Enable_standard_signals / Enable_cross_signals — enables or disables condition detection in Standard and Cross modes independently.
Enable_standard_alert / Enable_cross_alert — enables or disables alerts for Standard and Cross mode conditions independently.
Indicator Limitations
The WaveTrend Indicator reflects calculations based on historical price and volatility data. The adaptive channel scaling reduces the need for manual parameter adjustment across different instruments, but does not eliminate the possibility of false crossovers — particularly in Cross mode, where mid-range crossovers are frequent. Registered conditions indicate that the defined crossover criteria have been met on a closed bar — they do not predict future price movement or guarantee any particular market outcome. All readings should be evaluated within a broader analytical framework.

We can customize this indicator to your requirements by adding new features, modifying calculation logic, or combining multiple tools into a unified solution.
We also develop automated trading strategies (Expert Advisors) based on custom logic. The system can include configurable management modules such as dynamic risk parameters, multi-stage trailing stops, additional confirmation filters, and other custom functionality based on your specifications.
The final solution is delivered with full source code and post-delivery support. Contact us for a free consultation to discuss the scope and timeline of your project.
We are committed to the ongoing development and refinement of our indicators. If you’ve spotted a bug, feel that something essential is missing, or have ideas that could make the indicator even better, just send us a message. Your feedback helps us improve and deliver tools that truly meet traders’ needs.
Nordman Algorithms is a trade name of Nordman Algorithms OÜ (Reg. No. 14435535), registered in Tallinn, Estonia.
Software Nature & User Responsibility — Nordman Algorithms provides algorithmic software tools for technical analysis. Nordman Algorithms is not a financial advisor and is not liable for any losses. All trades conducted based on the software’s output are executed at the user’s sole discretion and risk.
Visual Markers & Signal Disclosure — This software may display visual markers (such as arrows, dots, or alerts) when predefined mathematical conditions are met. These markers are provided for educational and analytical purposes only, must not be interpreted as financial guidance, and do not constitute a recommendation to buy, sell, or hold any financial instrument. Users must independently validate all visual cues within their own trading methodology.
No Financial Advice — Nordman Algorithms does not provide discretionary trading signals, investment advice, or managed signal services. Our software represents a mathematical visualization of historical and real-time data. The appearance of a visual marker does not guarantee a profitable trade or predict future market behavior.
Trading Risk Warning — Futures, Forex, and options trading involve significant risk. Risk capital is money that can be lost without jeopardizing financial security. Only risk capital should be used for trading. Past performance is not indicative of future results. View Full Risk Disclosure: https://www.nordman-algorithms.com/risk-disclosure/
ESMA Risk Warning — Financial instruments, especially those involving leverage such as CFDs and Forex, are complex and carry a high risk of rapid financial loss. Our software provides analytical outputs and visual markers based on predefined mathematical conditions and does not mitigate or reduce inherent market risks. You should carefully consider whether you understand how leveraged financial instruments work and whether you can afford the high risk of losing your capital.
CFTC Rule 4.41 — Hypothetical or simulated performance results have inherent limitations. Unlike actual performance records, simulated results do not represent real trading. Because trades have not actually been executed, these results may under- or over-compensate for the impact of market factors such as liquidity. No representation is being made that any account will achieve profits or losses similar to those shown.