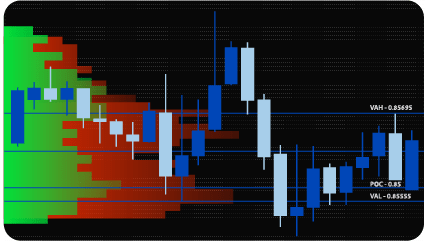
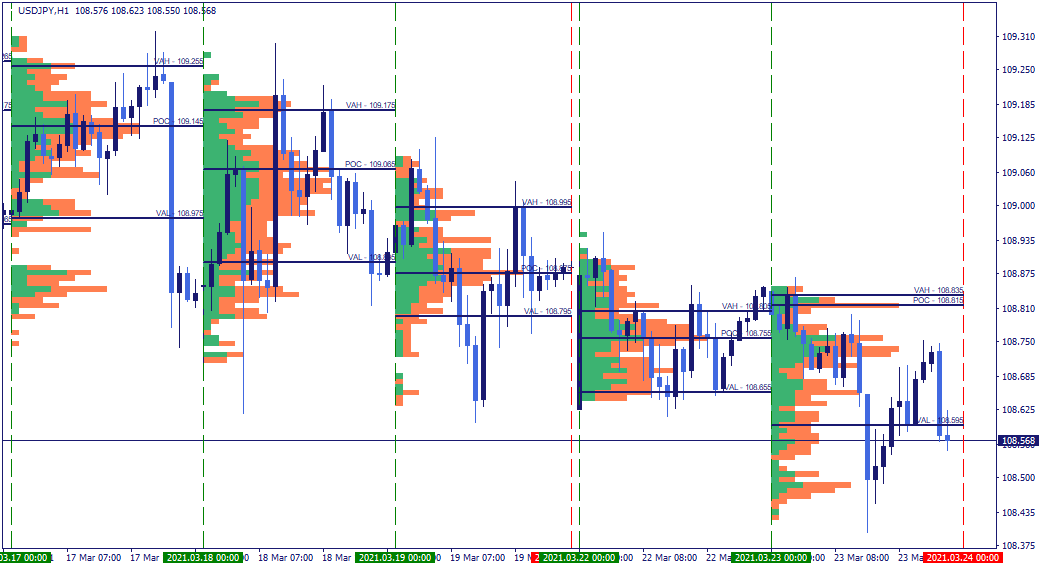
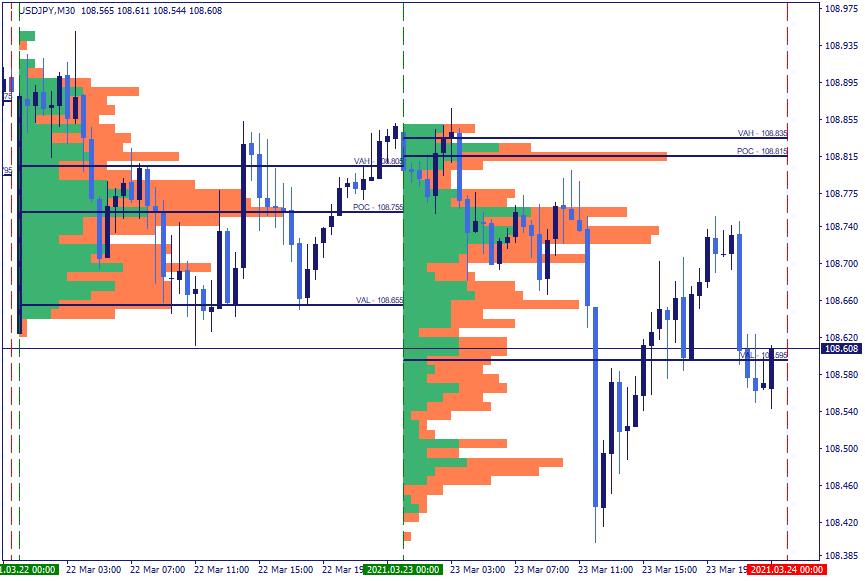
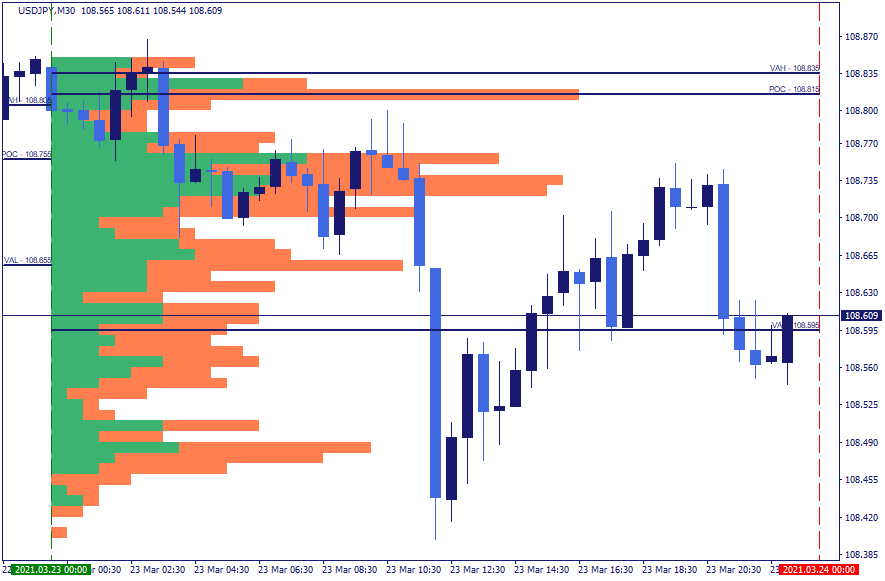

Volume Profile is an advanced charting method that reflects trading activity accumulated over a specified time period at individual price levels. The indicator plots a horizontal histogram on the chart, showing the volume traded at each price level during the selected session. This distribution allows analysts to identify price levels where the majority of trading activity occurred — and levels where activity was minimal.
The Volume Profile divides total trading volume at each price level by the total buying or selling volume over the same period, then visualizes this as a histogram directly on the asset chart. The green portion of the histogram reflects buying volume; the orange portion reflects selling volume.
Volume Profile is widely referenced in technical analysis as a method for identifying structurally significant price levels based on actual trading activity — rather than on calculated indicators derived from price alone. Many analysts use it to evaluate support and resistance levels by examining where volume concentrated historically.
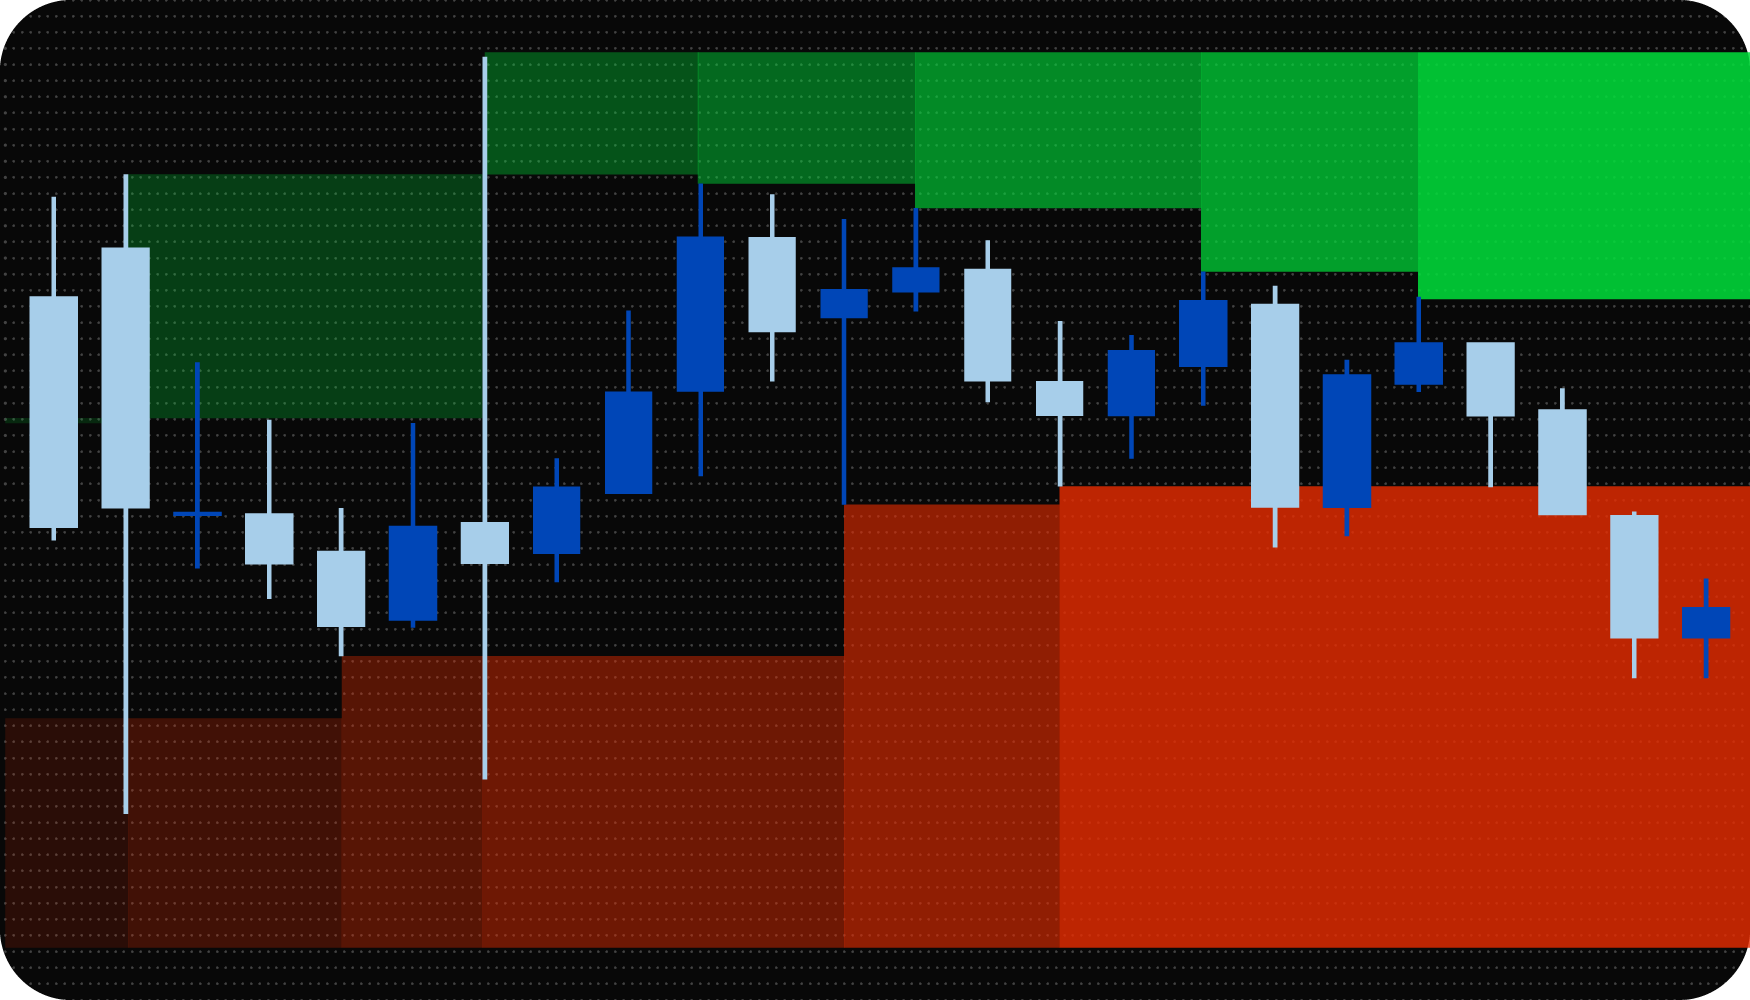
Volume Profile analysis focuses on the relationship between the current session’s open and the previous session’s value area. Three structural scenarios are commonly evaluated:
If the current session opens above the previous session’s value area — but below the previous session’s profile high — price is positioned in a zone where volume was relatively low. Analysts evaluate whether price will return toward the previous session’s Point of Control or continue in the direction of the current session.
If the current session opens below the previous session’s value area — but above the previous session’s profile low — the same logic applies in reverse. Price is in a low-volume zone below the value area, and the structural reference is again the previous session’s Point of Control.
If the current session opens completely outside the previous session’s profile range — above the profile high or below the profile low — this reflects a gap into a new price area with no prior volume reference from the previous session. Analysts evaluate this as a potentially significant directional move relative to the prior session’s range.
Volume Profile zones are commonly interpreted as structural support and resistance areas based on historical volume distribution.
Key levels displayed by the indicator:
Point of Control (POC) — the price level with the highest trading volume for the selected period. This is the most referenced level in Volume Profile analysis, representing the price at which the most trading activity occurred.
Profile High — the highest price level reached during the selected period.
Profile Low — the lowest price level reached during the selected period.
Value Area (VA) — the price range within which the majority of total volume traded. The default threshold is 70% of total volume.
Value Area High (VAH) — the upper boundary of the Value Area.
Value Area Low (VAL) — the lower boundary of the Value Area.
High Volume Node (HVN) — a price level where volume was significantly elevated relative to surrounding levels. These levels are associated with periods of price consolidation, where the market spent extended time near a price perceived as representing fair value by participants.
Low Volume Node (LVN) — a price level where volume was significantly reduced relative to surrounding levels. These levels are associated with fast price movement, where participants showed limited interest in trading at that price.
The indicator has three input parameters:
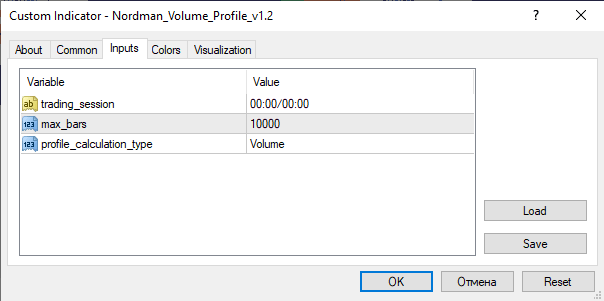
Trading session — defines the start and end of the session used for volume calculation.
Max bars — the maximum number of bars included in the calculation.
Profile calculation type — selects the calculation method: Volume or TPO.
The indicator supports two calculation methods:
Volume — ranges and the Point of Control are determined based on actual trading volume. The time price spends at each level is not considered in this mode.
TPO (Time Price Opportunity) — zones and the Point of Control are determined based on the number of time periods price spent at each level. Trading volume is not considered in this mode.

We can customize this indicator to your requirements by adding new features, modifying calculation logic, or combining multiple tools into a unified solution.
We also develop automated trading strategies (Expert Advisors) based on custom logic. The system can include configurable management modules such as dynamic risk parameters, multi-stage trailing stops, additional confirmation filters, and other custom functionality based on your specifications.
The final solution is delivered with full source code and post-delivery support. Contact us for a free consultation to discuss the scope and timeline of your project.
We are committed to the ongoing development and refinement of our indicators. If you’ve spotted a bug, feel that something essential is missing, or have ideas that could make the indicator even better, just send us a message. Your feedback helps us improve and deliver tools that truly meet traders’ needs.
Nordman Algorithms is a trade name of Nordman Algorithms OÜ (Reg. No. 14435535), registered in Tallinn, Estonia.
Software Nature & User Responsibility — Nordman Algorithms provides algorithmic software tools for technical analysis. Nordman Algorithms is not a financial advisor and is not liable for any losses. All trades conducted based on the software’s output are executed at the user’s sole discretion and risk.
Visual Markers & Signal Disclosure — This software may display visual markers (such as arrows, dots, or alerts) when predefined mathematical conditions are met. These markers are provided for educational and analytical purposes only, must not be interpreted as financial guidance, and do not constitute a recommendation to buy, sell, or hold any financial instrument. Users must independently validate all visual cues within their own trading methodology.
No Financial Advice — Nordman Algorithms does not provide discretionary trading signals, investment advice, or managed signal services. Our software represents a mathematical visualization of historical and real-time data. The appearance of a visual marker does not guarantee a profitable trade or predict future market behavior.
Trading Risk Warning — Futures, Forex, and options trading involve significant risk. Risk capital is money that can be lost without jeopardizing financial security. Only risk capital should be used for trading. Past performance is not indicative of future results. View Full Risk Disclosure: https://www.nordman-algorithms.com/risk-disclosure/
ESMA Risk Warning — Financial instruments, especially those involving leverage such as CFDs and Forex, are complex and carry a high risk of rapid financial loss. Our software provides analytical outputs and visual markers based on predefined mathematical conditions and does not mitigate or reduce inherent market risks. You should carefully consider whether you understand how leveraged financial instruments work and whether you can afford the high risk of losing your capital.
CFTC Rule 4.41 — Hypothetical or simulated performance results have inherent limitations. Unlike actual performance records, simulated results do not represent real trading. Because trades have not actually been executed, these results may under- or over-compensate for the impact of market factors such as liquidity. No representation is being made that any account will achieve profits or losses similar to those shown.