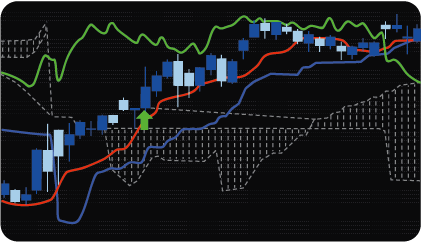
The S&R Breakout Indicator analyses historical price data to identify significant support and resistance zones — and registers a condition when price breaks through them. The calculation depth is configurable from 30 to 300 bars.
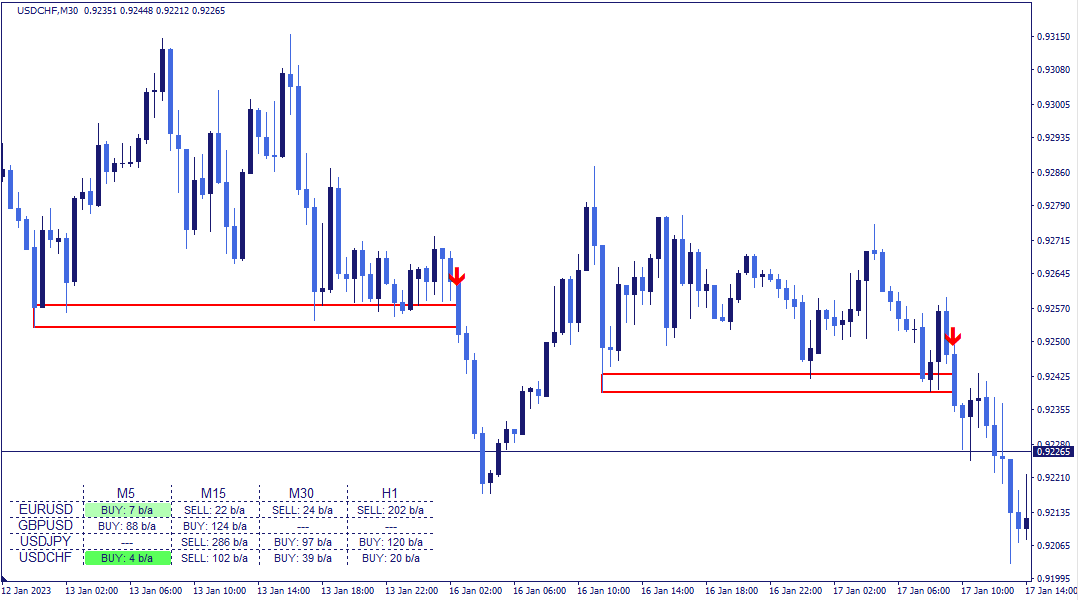
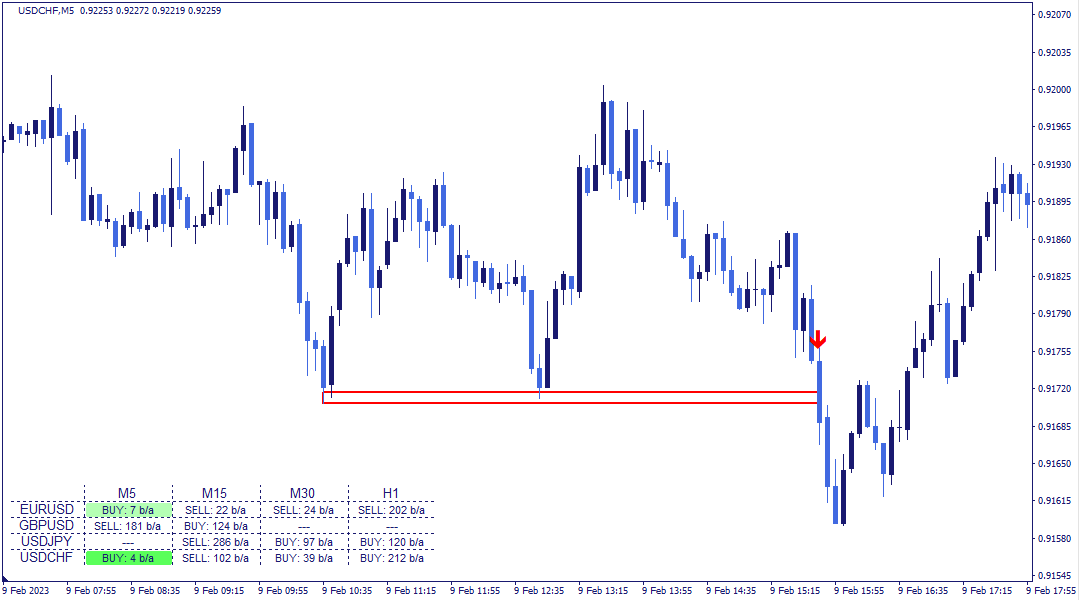
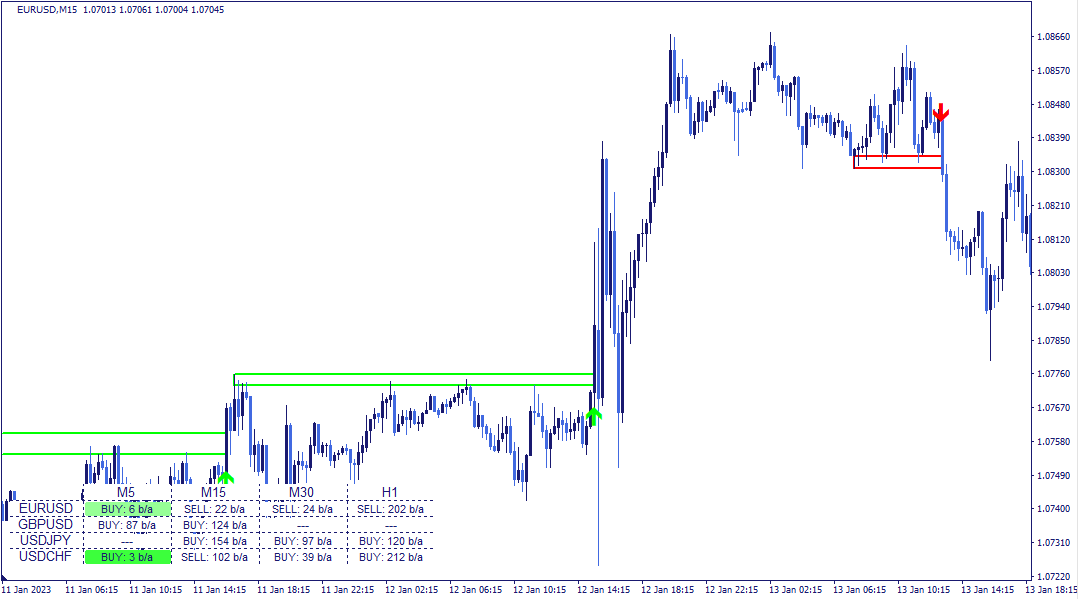
The identification process works in two stages. First, the indicator locates local price highs and lows within the defined bar range. Second, it evaluates whether multiple local highs or lows cluster within a defined tolerance threshold — if they do, a support or resistance zone is considered structurally significant and is drawn on the chart as a narrow rectangle covering the relevant price levels.
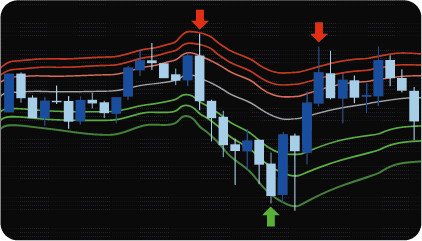
A breakout condition is registered when price moves through the zone boundary. A bullish breakout condition is marked with a green upward arrow when price breaks above the upper boundary of a resistance zone. A bearish breakout condition is marked with a red downward arrow when price breaks below the lower boundary of a support zone.
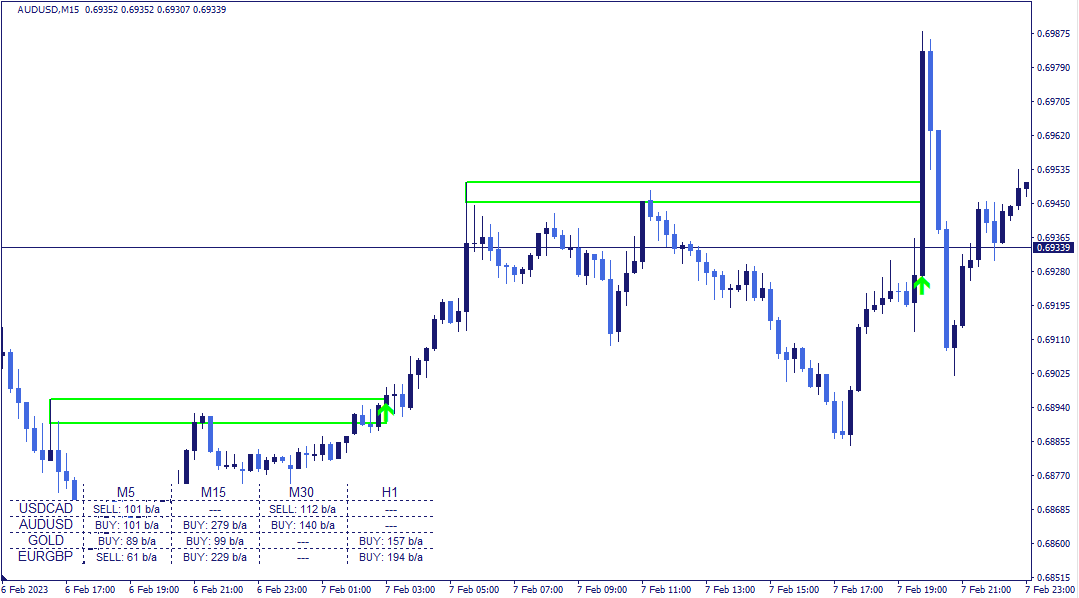
One structural feature of this indicator worth noting: the breakout of one zone does not cancel the tracking of other zones that began forming earlier. Multiple zones can be active simultaneously at different price levels — each tracked independently. This means a subsequent breakout of an older zone can register as an additional confirmatory condition alongside an already-active directional reading.
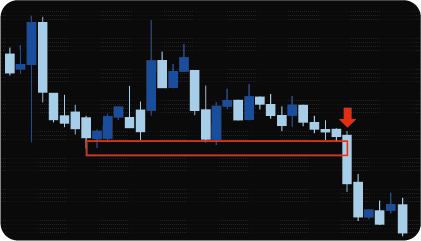
Support and resistance zones identified by this indicator are based on structural price behavior rather than calculated formula levels. Before a significant level forms, price typically approaches it multiple times — testing it, bouncing, and returning. The more times price has interacted with a level without breaking through, the higher the structural significance of that zone.
The indicator quantifies this by requiring a minimum number of price touches before a zone is considered significant. The tolerance threshold — configurable as a percentage — defines how close local highs or lows must be to each other to be counted as tests of the same zone. A narrower threshold produces fewer but more tightly defined zones. A wider threshold captures more interactions but at the cost of zone precision.
When price eventually breaks through a zone that has been tested multiple times, the breakout condition is registered. The indicator evaluates breakouts within a configurable bar range — if no breakout occurs within this window, the condition is not registered regardless of zone significance.
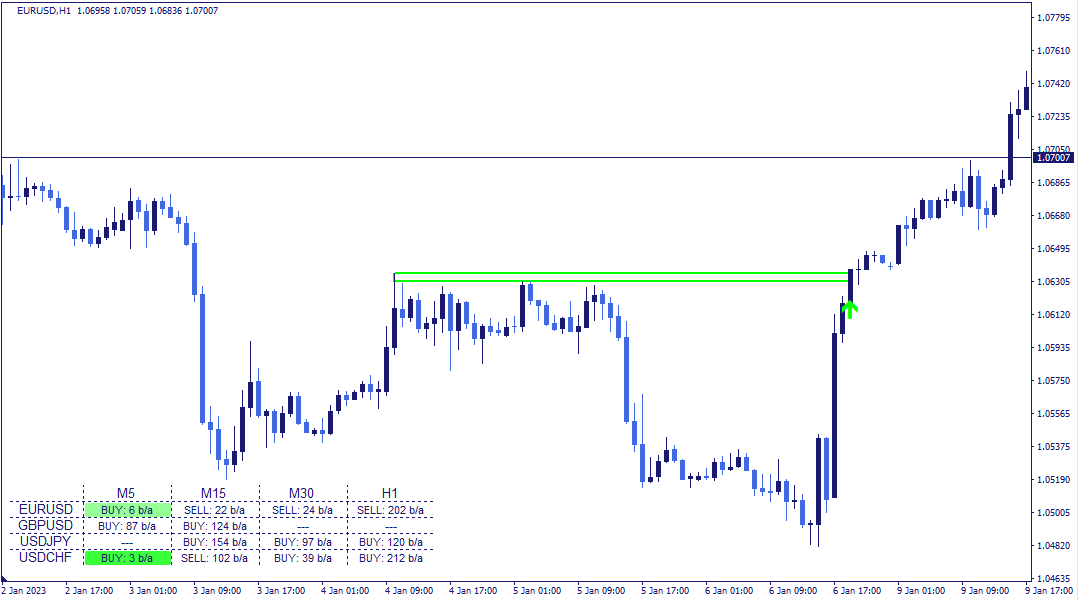
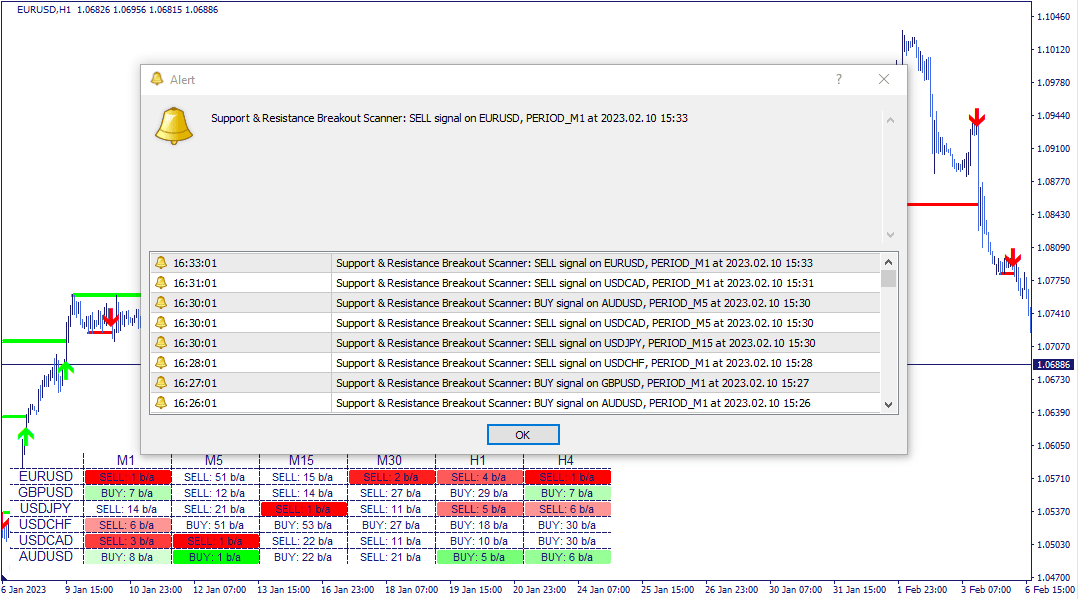
The dashboard displays the current breakout condition status across all monitored assets and timeframes in a structured table — assets in rows, timeframes in columns.
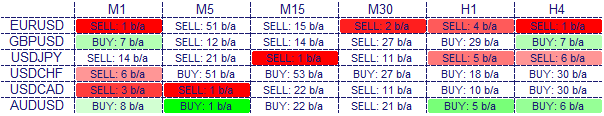
Each cell shows the directional context of the most recently registered condition — bullish or bearish — and the number of bars back at which it was registered. Green cells indicate a bullish breakout condition, red cells a bearish one. Color saturation decreases as the condition becomes less recent. Clicking any cell updates the chart to the corresponding asset and timeframe directly.
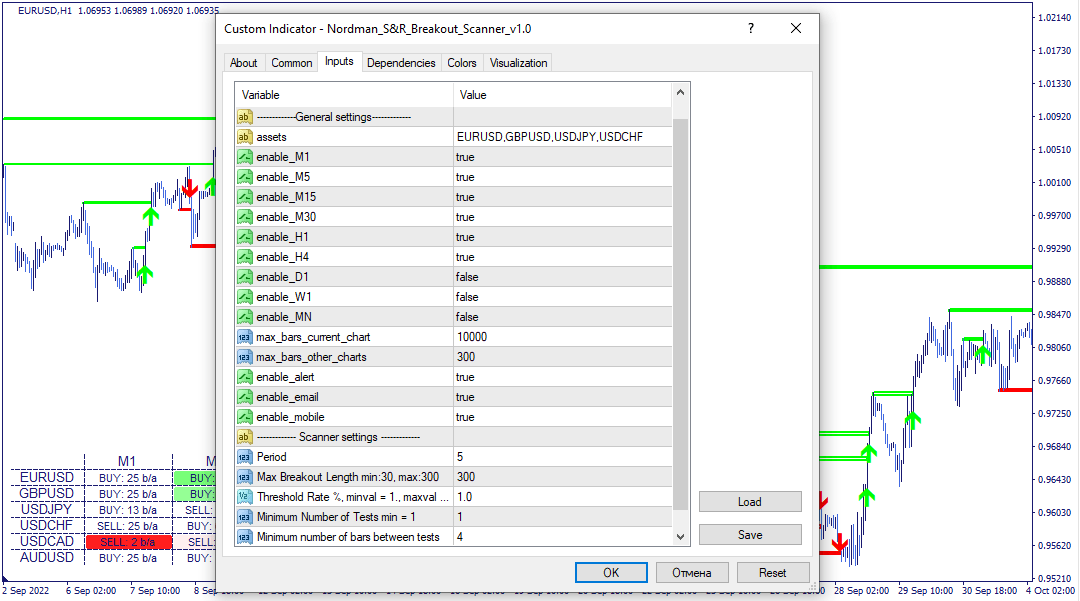
The indicator has the following parameters:
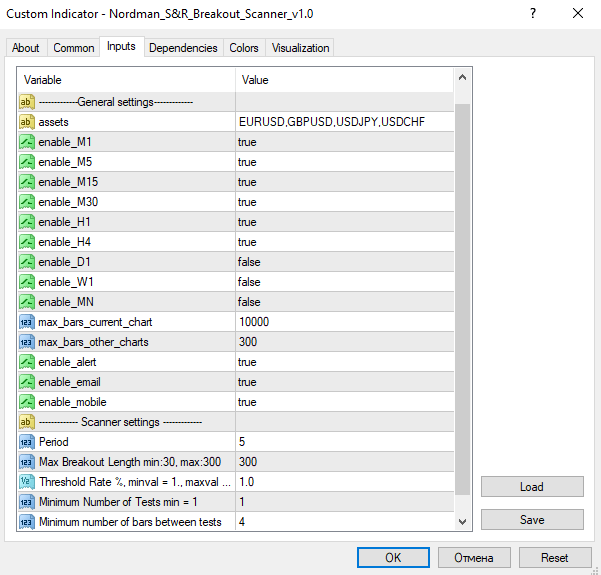
Assets — instruments to include in the scanner.
Enable_M1–MN — include or exclude individual timeframes from the scanner scope.
Max_bars — limits how far back the scanner evaluates conditions. Reducing this value improves calculation speed.
Enable alert / Enable email / Enable mobile — alert delivery: platform notifications, email, or mobile — each configurable independently.
Period — the bar range used to identify local highs and lows (Pivot Points).
Max breakout length — the number of bars within which a breakout must occur after a zone has been identified. If no breakout occurs within this range, the zone expires without registering a condition.
Threshold rate % — defines the tolerance width of the zone as a percentage. Controls how close local highs or lows must be to count as tests of the same level.
Minimum number of tests — the minimum number of price touches required for a zone to be considered structurally significant.
Minimum number of bars between tests — the minimum bar distance required between individual price touches to count as separate tests of the zone.
Indicator Limitations
Support and resistance zones are identified based on historical price interaction patterns. A registered breakout condition indicates that price has moved through a zone boundary that meets the defined structural criteria — it does not predict the magnitude or duration of the subsequent move. Breakout conditions can reverse quickly, particularly in low-volatility or ranging market environments. Zone significance is determined by past price behavior and does not guarantee future price reaction at the same levels. All registered conditions should be evaluated within a broader analytical framework.

We can customize this indicator to your requirements by adding new features, modifying calculation logic, or combining multiple tools into a unified solution.
We also develop automated trading strategies (Expert Advisors) based on custom logic. The system can include configurable management modules such as dynamic risk parameters, multi-stage trailing stops, additional confirmation filters, and other custom functionality based on your specifications.
The final solution is delivered with full source code and post-delivery support. Contact us for a free consultation to discuss the scope and timeline of your project.
We are committed to the ongoing development and refinement of our indicators. If you’ve spotted a bug, feel that something essential is missing, or have ideas that could make the indicator even better, just send us a message. Your feedback helps us improve and deliver tools that truly meet traders’ needs.
Nordman Algorithms is a trade name of Nordman Algorithms OÜ (Reg. No. 14435535), registered in Tallinn, Estonia.
Software Nature & User Responsibility — Nordman Algorithms provides algorithmic software tools for technical analysis. Nordman Algorithms is not a financial advisor and is not liable for any losses. All trades conducted based on the software’s output are executed at the user’s sole discretion and risk.
Visual Markers & Signal Disclosure — This software may display visual markers (such as arrows, dots, or alerts) when predefined mathematical conditions are met. These markers are provided for educational and analytical purposes only, must not be interpreted as financial guidance, and do not constitute a recommendation to buy, sell, or hold any financial instrument. Users must independently validate all visual cues within their own trading methodology.
No Financial Advice — Nordman Algorithms does not provide discretionary trading signals, investment advice, or managed signal services. Our software represents a mathematical visualization of historical and real-time data. The appearance of a visual marker does not guarantee a profitable trade or predict future market behavior.
Trading Risk Warning — Futures, Forex, and options trading involve significant risk. Risk capital is money that can be lost without jeopardizing financial security. Only risk capital should be used for trading. Past performance is not indicative of future results. View Full Risk Disclosure: https://www.nordman-algorithms.com/risk-disclosure/
ESMA Risk Warning — Financial instruments, especially those involving leverage such as CFDs and Forex, are complex and carry a high risk of rapid financial loss. Our software provides analytical outputs and visual markers based on predefined mathematical conditions and does not mitigate or reduce inherent market risks. You should carefully consider whether you understand how leveraged financial instruments work and whether you can afford the high risk of losing your capital.
CFTC Rule 4.41 — Hypothetical or simulated performance results have inherent limitations. Unlike actual performance records, simulated results do not represent real trading. Because trades have not actually been executed, these results may under- or over-compensate for the impact of market factors such as liquidity. No representation is being made that any account will achieve profits or losses similar to those shown.