The MT4 Ichimoku Indicator is a composite technical analysis system — combining five interdependent lines that collectively reflect trend direction, momentum, and support/resistance structure.
The indicator registers analytical conditions for five Ichimoku configurations — Kumo Breakout, Tenkan/Kijun Cross, Kijun Cross, Senkou Span Cross, and Chikou Span Cross — each with advanced settings for detecting strong, neutral, and weak conditions. Results are monitored across all specified assets and timeframes through a structured scanner dashboard.
The Ichimoku system consists of five component lines, each serving a distinct analytical function:
Tenkan-Sen (Turning line) — the fastest of the Ichimoku lines. Its slope reflects the short-term trend vector: an upward slope indicates upward momentum, a downward slope indicates downward momentum, and a flat line indicates consolidation.
Kijun-Sen (Standard line) — like Tenkan-Sen, it reflects trend direction but uses a longer calculation period. It represents the long-term trend vector.
Chikou Span (Lagging line) — plots current price against the price structure from 26 periods ago, allowing the analyst to evaluate whether the current move has precedent in recent market behavior.
Senkou Span A (1st leading line) — the first boundary of the Kumo cloud, derived as the mean value of Tenkan-Sen and Kijun-Sen. Functions as a support/resistance reference for the current trend.
Senkou Span B (2nd leading line) — the second boundary of the Kumo cloud, calculated over a longer period and shifted forward by the Kijun calculation period. Acts as the second support/resistance reference line.
The analytical depth of the Ichimoku system comes from the interaction between its lines rather than from any single component in isolation. Tenkan-Sen and Kijun-Sen reflect short and long-term momentum respectively — their relative position and slope indicate whether directional pressure is building or decelerating. The Kumo cloud projects both support/resistance structure and trend bias simultaneously: its thickness reflects the strength of the price barrier, while its future position — shifted 26 periods forward — gives the chart a forward-looking structural reference that most single-line indicators cannot provide. Chikou Span adds a historical confirmation layer by plotting current price against the price structure from 26 periods ago. This multi-layered cross-referencing between past, present, and projected price levels is what distinguishes Ichimoku from standard overlay indicators.
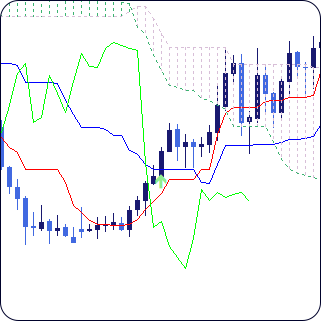
The Kumo cloud formed by Senkou Span A and B represents the zone of support and resistance. When price is inside the cloud, the market is in a ranging or consolidating state. When price is outside the cloud, a directional bias is present — price above the cloud reflects a bullish structural context, price below reflects a bearish one. Cloud color reflects trend direction: a bullish cloud is colored by the first line, a bearish cloud by the second.
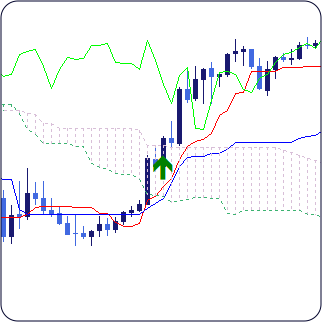
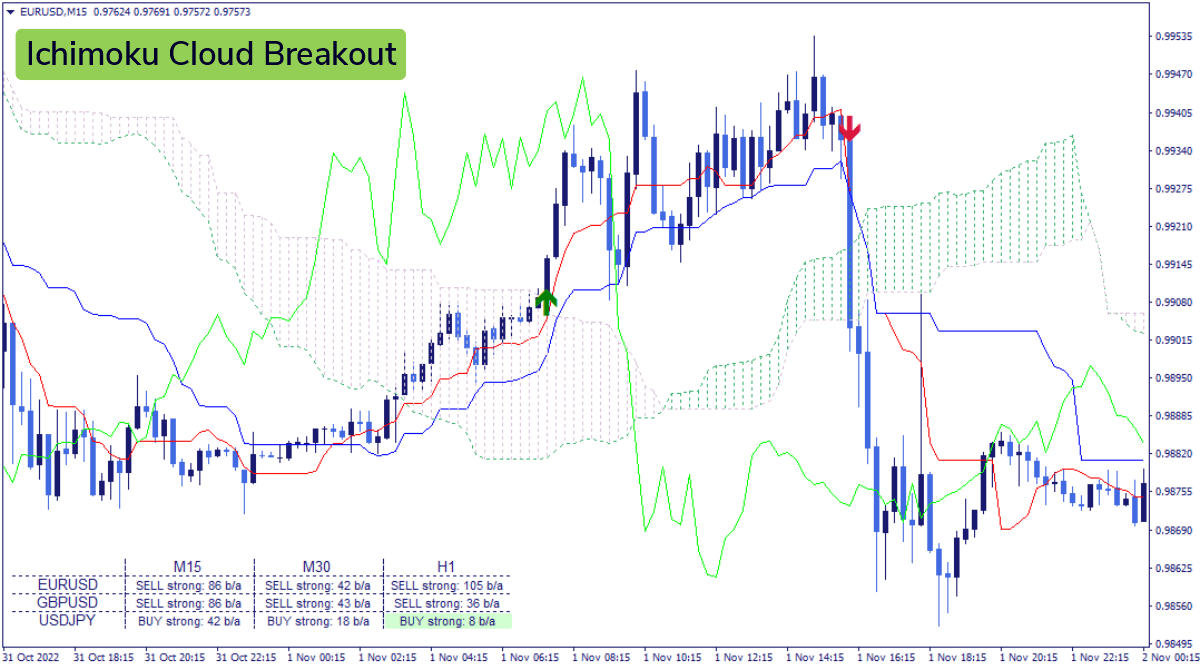
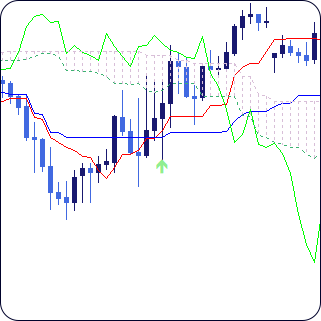
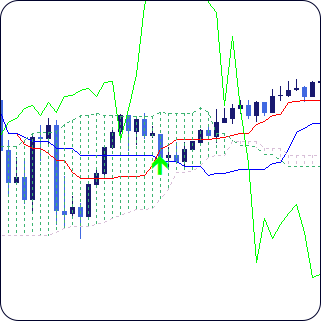
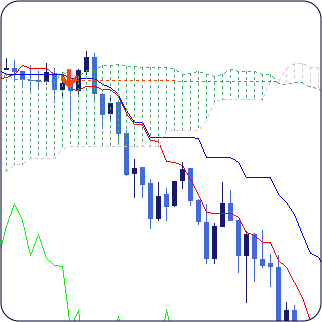
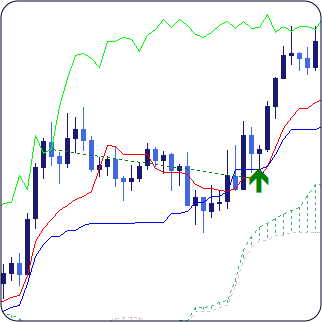
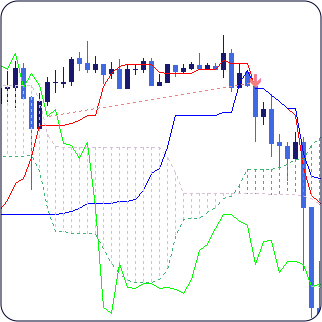
A bullish condition is registered when price breaks above the upper boundary of the Kumo cloud.
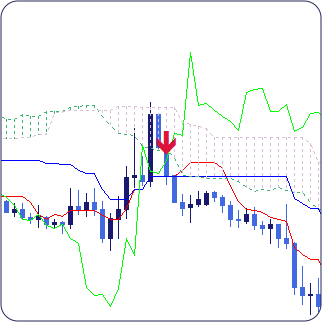
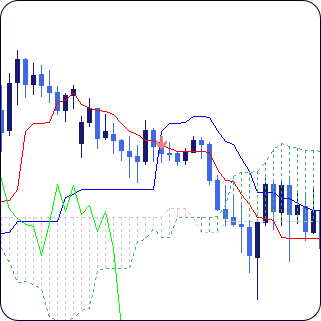
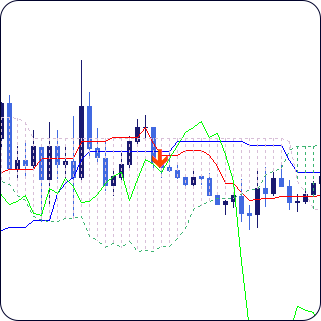
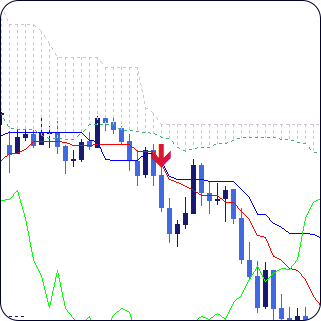
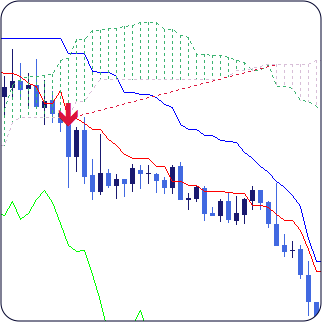
A bearish condition is registered when price breaks below the lower boundary of the Kumo cloud.
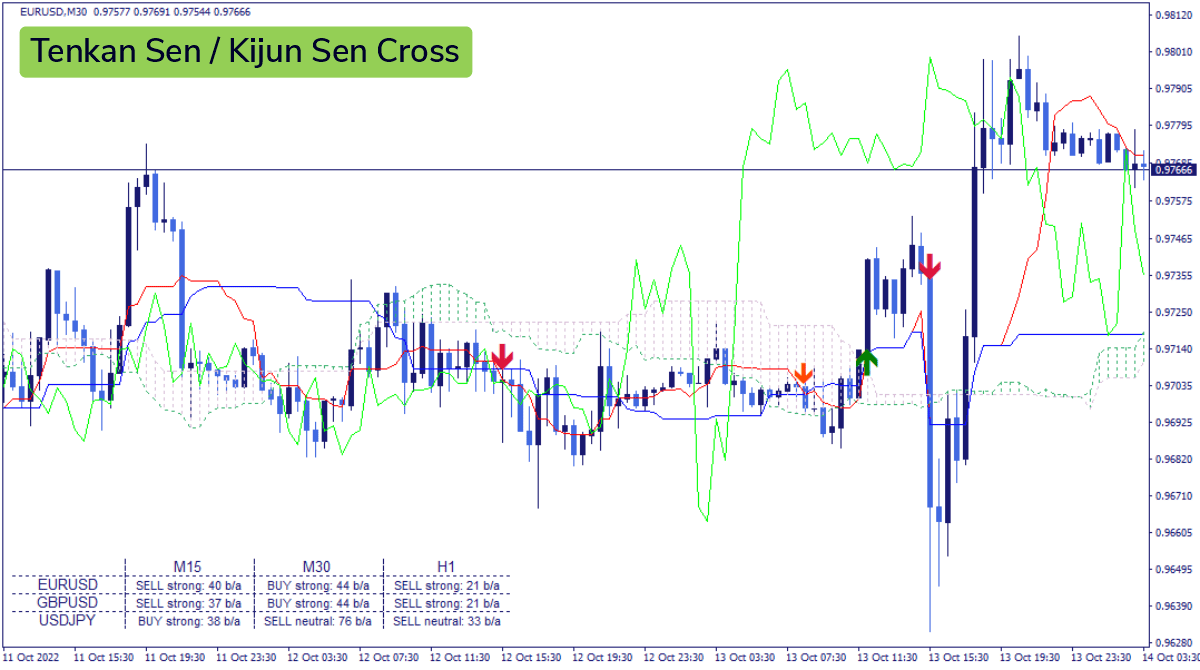
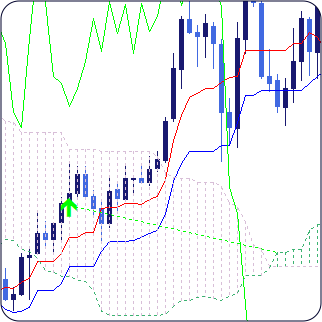
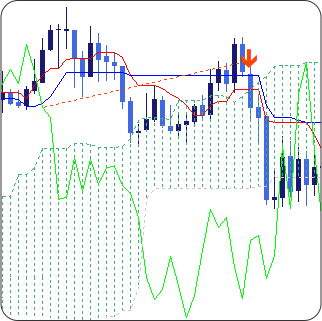
A bullish condition is registered when Tenkan-Sen crosses Kijun-Sen from below.
A weak condition is registered when the crossover is below the Cloud.
A neutral condition is registered when the crossover is inside the Cloud.
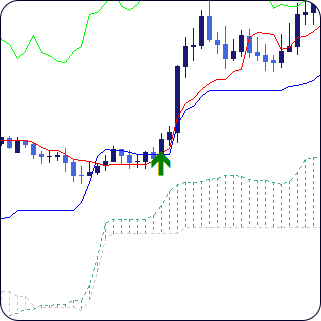
A strong condition is registered when the crossover is above the Cloud.
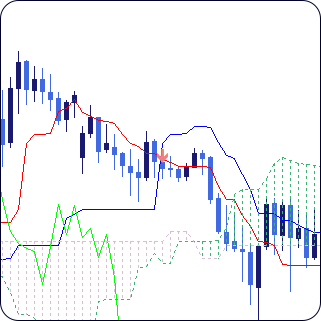
A bearish condition is registered when Tenkan-Sen crosses Kijun-Sen from above.
A weak condition is registered when the crossover is above the Cloud.
A neutral condition is registered when the crossover is inside the Cloud.
A strong condition is registered when the crossover is below the Cloud.
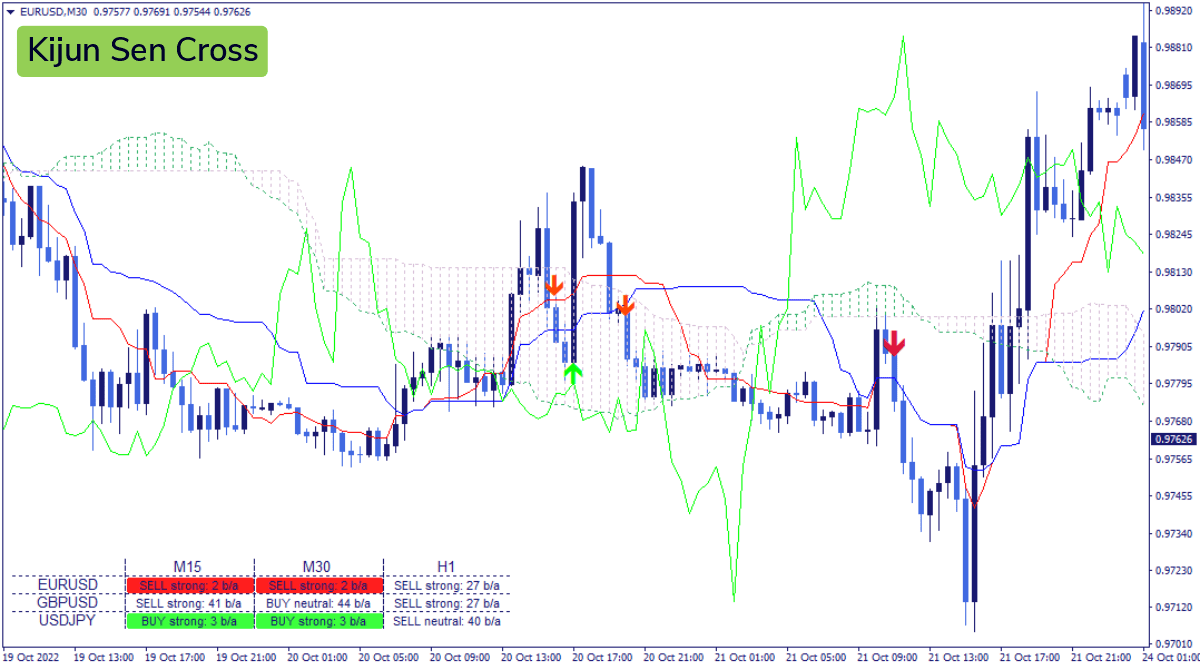
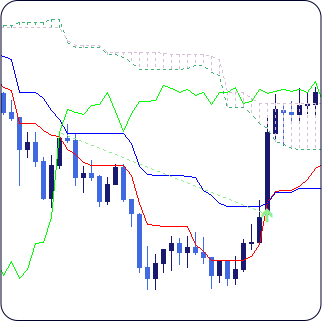
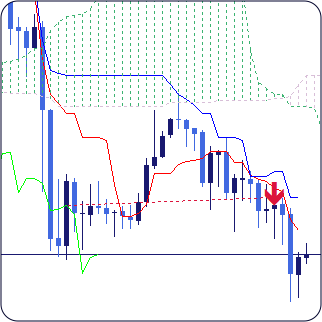
A bullish condition is registered when price crosses Kijun-Sen upwards.
The crossover is below Cloud — a weak bullish condition.
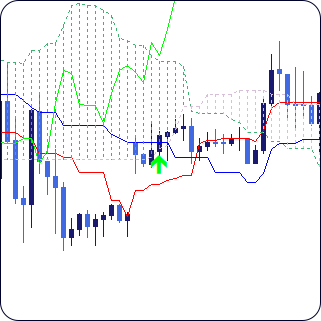
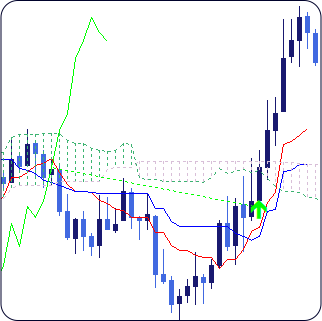
The crossover is inside Cloud — a neutral bullish condition.
The crossover is above Cloud — a strong bullish condition.
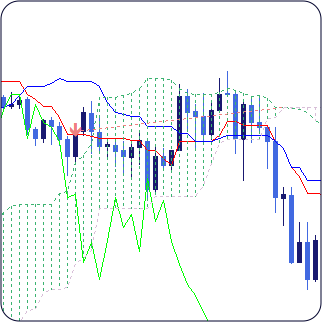
A bearish condition is registered when price crosses Kijun Sen downwards.
The crossover is above Cloud — a weak bearish condition.
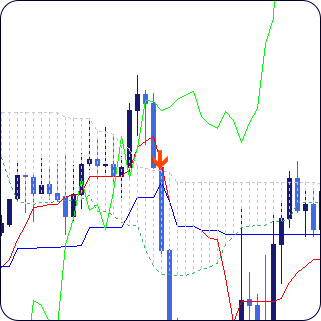
The crossover is inside Cloud — a neutral bearish condition.
The crossover is below Cloud — a strong bearish condition.
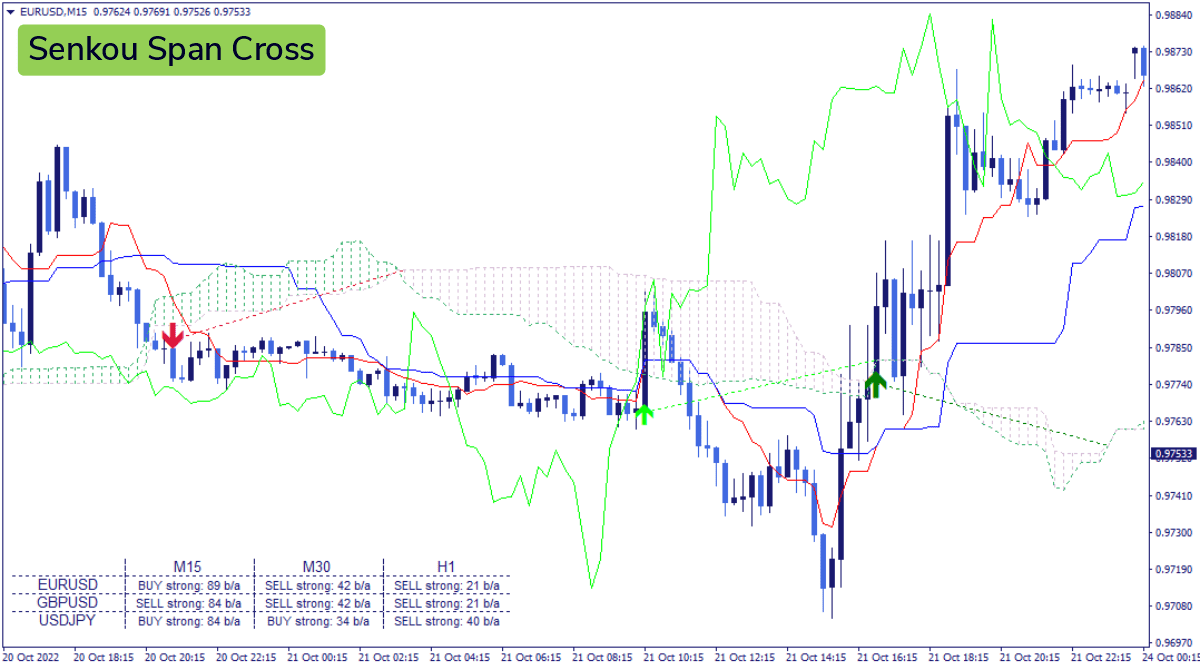
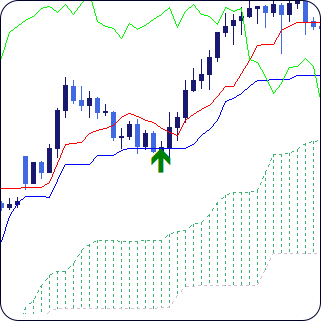
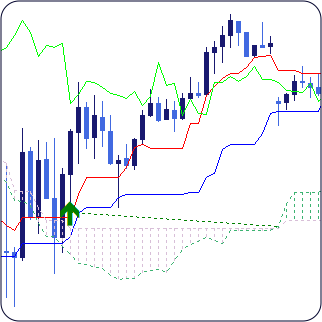
A bullish condition is registered when Senkou Span A crosses Senkou Span B from below.
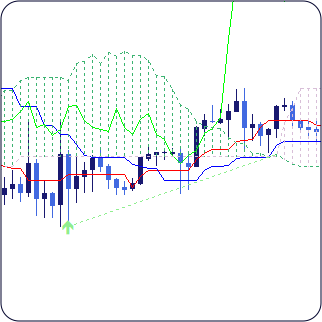
A weak condition is registered if the current price is below Cloud.
A neutral condition is registered if the current price is inside Cloud.
A strong condition is registered if the current price is above Cloud.
A bearish condition is registered when Senkou Span A crosses Senkou Span B from above.
A weak condition is registered if the current price is above Cloud.
A neutral condition is registered if the current price is inside Cloud.
A strong condition is registered if the current price is below Cloud.
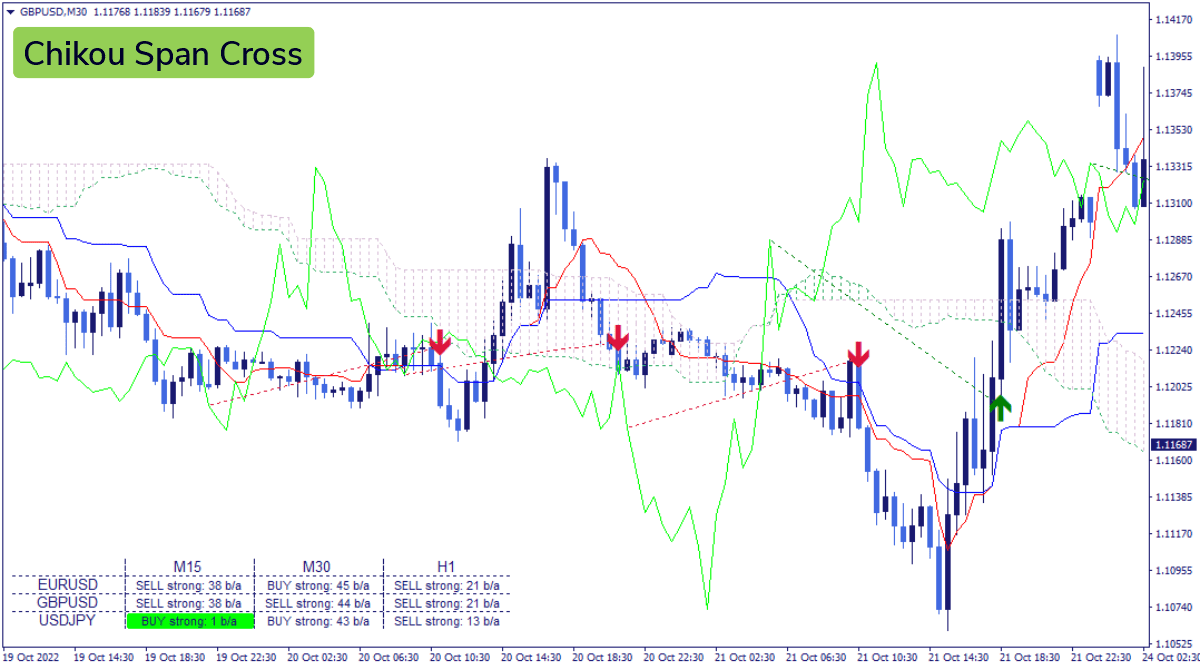
A bullish condition is registered when Chikou Span moves upward and crosses price from below.
Weak condition — the current price is below Cloud.
Neutral condition — the current price is inside Cloud.
Strong condition — the current price is above Cloud.
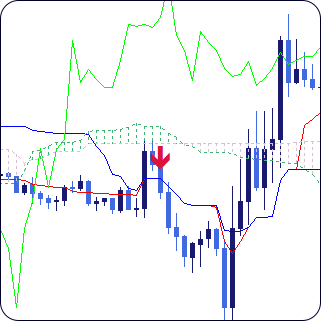
A bearish condition is registered when Chikou Span moves downward and crosses price from above.
Weak condition — the current price is above Cloud.
Neutral condition — the current price is inside Cloud.
Strong condition — the current price is below Cloud.
Indicator Limitations
The Ichimoku indicator reflects calculations based on historical price data and does not predict future price movement. Registered conditions do not guarantee any particular market outcome and should be evaluated within a broader analytical framework.
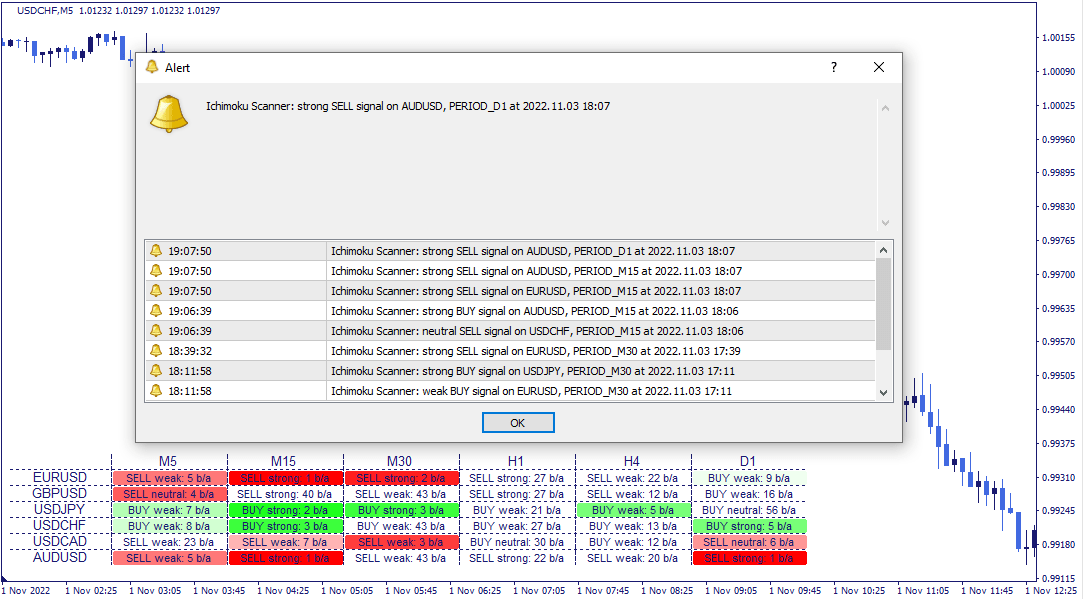
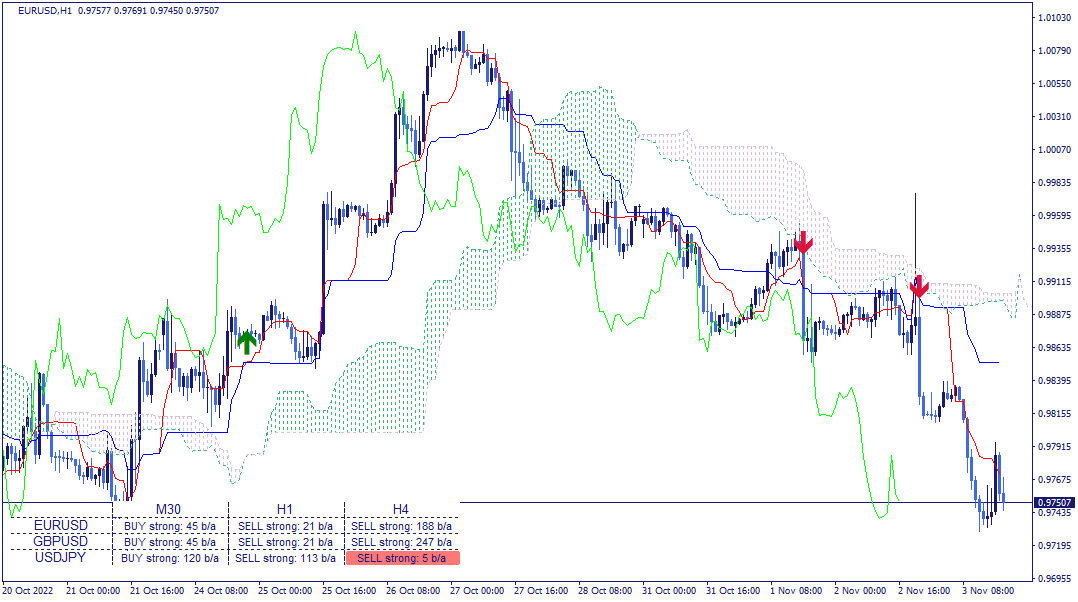
The dashboard displays the current detection status across all monitored assets and timeframes in a single structured view.
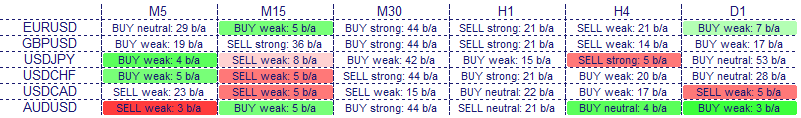
Each cell shows the directional context of the most recently registered condition — bullish or bearish — its strength level (weak, neutral, or strong), and the number of bars back at which it was registered. Green cells indicate a bullish condition, red cells a bearish one. Color saturation decreases as the condition becomes less recent. Clicking any cell updates the chart to the corresponding asset and timeframe directly.
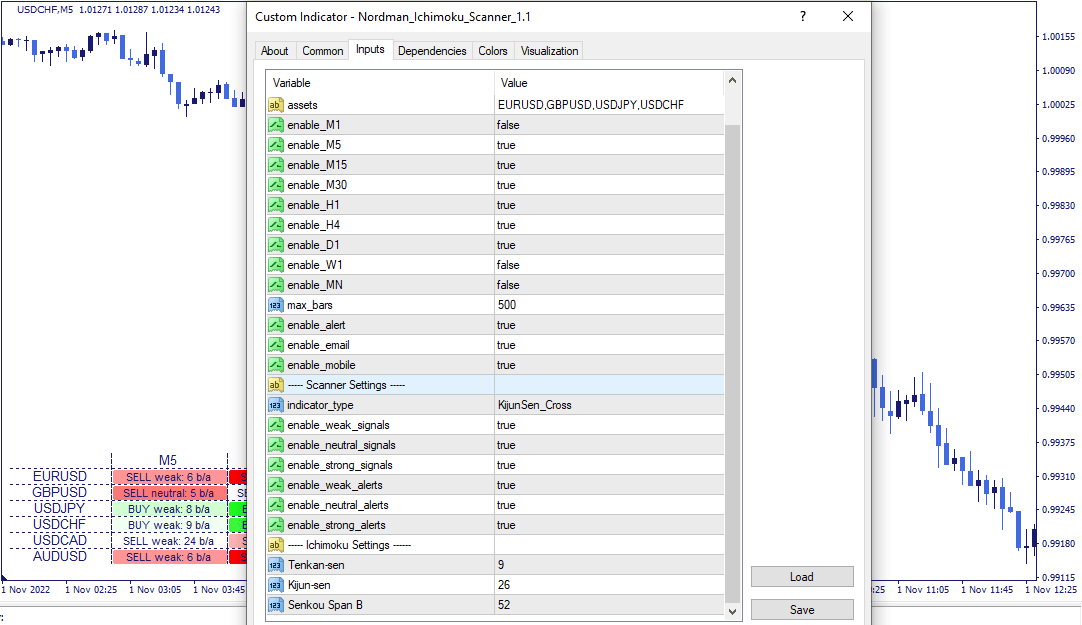
The indicator has the following parameters:
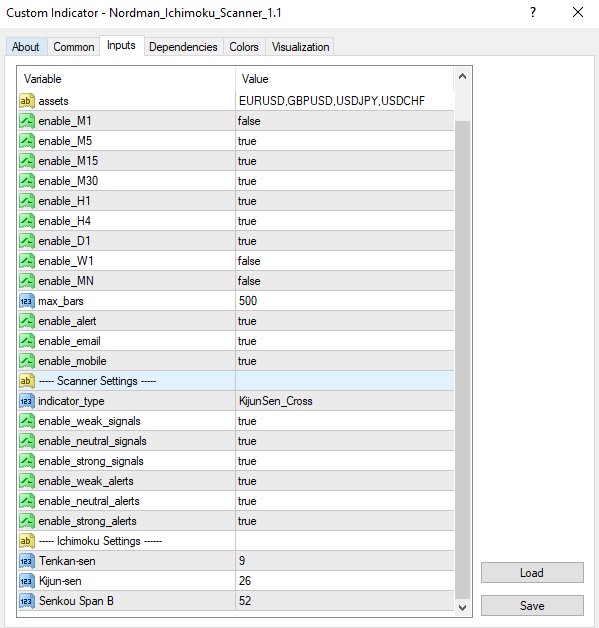
Assets — instruments to include in the scanner.
Enable_M1–MN — include or exclude individual timeframes from the scanner scope.
Max_bars — limits how far back the scanner evaluates conditions. Reducing this value improves calculation speed.
Enable alert / Enable email / Enable mobile — alert delivery: platform notifications, email, or mobile — each configurable independently.
Ichimoku Settings — individual parameters for each Ichimoku line.
Indicator_type — selects the active configuration from 5 available: Kumo Breakout, Tenkan/Kijun Cross, Kijun Cross, Senkou Span Cross, Chikou Span Cross.
Enable_strong_conditions / Enable_neutral_conditions / Enable_weak_conditions — enables or disables registration of strong, neutral, and weak analytical conditions independently.
Enable_strong_alerts / Enable_neutral_alerts / Enable_weak_alerts — enables or disables alerts for each condition strength level independently.

We can customize this indicator to your requirements by adding new features, modifying calculation logic, or combining multiple tools into a unified solution.
We also develop automated trading strategies (Expert Advisors) based on custom logic. The system can include configurable management modules such as dynamic risk parameters, multi-stage trailing stops, additional confirmation filters, and other custom functionality based on your specifications.
The final solution is delivered with full source code and post-delivery support. Contact us for a free consultation to discuss the scope and timeline of your project.
We are committed to the ongoing development and refinement of our indicators. If you’ve spotted a bug, feel that something essential is missing, or have ideas that could make the indicator even better, just send us a message. Your feedback helps us improve and deliver tools that truly meet traders’ needs.
Nordman Algorithms is a trade name of Nordman Algorithms OÜ (Reg. No. 14435535), registered in Tallinn, Estonia.
Software Nature & User Responsibility — Nordman Algorithms provides algorithmic software tools for technical analysis. Nordman Algorithms is not a financial advisor and is not liable for any losses. All trades conducted based on the software’s output are executed at the user’s sole discretion and risk.
Visual Markers & Signal Disclosure — This software may display visual markers (such as arrows, dots, or alerts) when predefined mathematical conditions are met. These markers are provided for educational and analytical purposes only, must not be interpreted as financial guidance, and do not constitute a recommendation to buy, sell, or hold any financial instrument. Users must independently validate all visual cues within their own trading methodology.
No Financial Advice — Nordman Algorithms does not provide discretionary trading signals, investment advice, or managed signal services. Our software represents a mathematical visualization of historical and real-time data. The appearance of a visual marker does not guarantee a profitable trade or predict future market behavior.
Trading Risk Warning — Futures, Forex, and options trading involve significant risk. Risk capital is money that can be lost without jeopardizing financial security. Only risk capital should be used for trading. Past performance is not indicative of future results. View Full Risk Disclosure: https://www.nordman-algorithms.com/risk-disclosure/
ESMA Risk Warning — Financial instruments, especially those involving leverage such as CFDs and Forex, are complex and carry a high risk of rapid financial loss. Our software provides analytical outputs and visual markers based on predefined mathematical conditions and does not mitigate or reduce inherent market risks. You should carefully consider whether you understand how leveraged financial instruments work and whether you can afford the high risk of losing your capital.
CFTC Rule 4.41 — Hypothetical or simulated performance results have inherent limitations. Unlike actual performance records, simulated results do not represent real trading. Because trades have not actually been executed, these results may under- or over-compensate for the impact of market factors such as liquidity. No representation is being made that any account will achieve profits or losses similar to those shown.


