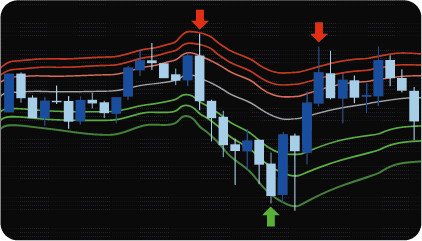
MT4 VWAP Indicator displays the volume weighted average price with several levels of standard deviation bands.
VWAP (Value-Weighted Average Price) is similar to a moving average, but with one significant difference – it additionally takes volume into account, when calculating the average price. Including volume in the calculation of the average price allows a more accurate reflection of the true average value of an asset, as price levels with more volume will matter more than price levels with less volume.
The VWAP Indicator is primarily used for trading with a mean reversion strategy. This strategy assumes that the price of a financial instrument after a significant movement (growth or fall) will tend to return to its average values. When the current market price is above the average, it is expected to fall in the future, and when it is lower, it is expected to rise.
The main feature of MT4 VWAP Indicator is that standard deviation bands are used along with VWAP. It is believed that the market is in a trend only 30% of the time; in the remaining significant part of the time it is in a sideways movement or does not have a prevailing direction. The upper and lower bands of the standard deviation from the VWAP form a kind of price channel in which the market price moves most of the time. For trading with a mean reversion strategy, the goal is to find the moment when the price rolls back from the upper and lower bands of the standard deviation to the middle line-VWAP.
For the convenience of monitoring trading signals, the indicator has a dashboard in which you can configure any symbols of interest to track. In the indicator parameters, you can also select any standard timeframe to search for trading signals. This gives a chance to use the VWAP Indicator in various trading styles from scalping to day-trading.
MT4 VWAP Indicator has useful advanced settings:
The indicator shows price crossing signals from one to three levels at the closing of the bar, which means that its signals always have a formed, final form and are never redrawn.
Trading signals for the indicator are touches of standard deviation levels.
As part of the strategy, it is assumed that after the price touches one of the standard deviation levels, it can start moving in the opposite direction – that is towards the middle VWAP line.
When the price crosses the lower levels of the standard deviation, a signal to buy is given; when the upper levels are crossed, a signal to sell is given. The crossing of the most extreme levels of the bands (level 3) is the most reliable signal.
The accuracy of the signals increases when using higher timeframes and the weekly VWAP calculation cycle.
The dashboard shows information about the current status of detecting signals.
An asset / timeframe cell contains information about the trade direction (BUY or SELL), the standard deviation level (1-3) and the bar number (number of bars ago) on which the signal was detected.
When a signal is detected, the dashboard highlights the currency pair / timeframe cell with the color corresponding to the direction of the signal (green – BUY, red – SELL). The color of the cell changes the saturation of the main color depending on how far the distance of the bars from the last bar where the signal was detected increases.
When clicking on a cell where a signal appears, the chart instantly changes to the asset and timeframe on which the signal was detected, which allows you to quickly assess the market situation and make a decision to enter a trade.
The indicator has the following parameters:
assets – selection of assets to search for signals.
enable_M1 – enable_MN – include / exclude timeframes (from a minute to a month) to search for signals via them.
max_bars – the maximum number of bars back, by which the scanner will search for signals. The parameter limits the number of calculations to speed up the indicator.
enable_alert – the option enables / disables alerts.
enable_email – allows you to send email alerts.
enable_mobile – allows you to send alerts to your mobile device.
max_period_counts – maximum number of periods for calculation.
band_deviation_N – level standard deviation multiplier.
enable_vwap_level_N – enable / disable detection of signals at a given level.
enable_alert_vwap_level_N – enable / disable alerts at a given level.

We can also turn the indicator into an Expert Advisor (trading robot) with an extended set of custom functions (stop loss, take profit, trailing stop, risk management parameters, trading time limit, and others).
Request a free consultation from our team of professional programmers and find out the cost and timing of your project development.
Nordman Algorithms is not liable for any risk that you face using the software. Please, use the software on your own responsibility. The software is coded in accordance with a common known concept and Nordman Algorithms does not guarantee accuracy or trading performance of the software signals.
Futures, foreign currency and options trading contains substantial risk and is not for every investor. An investor could potentially lose all or more than the initial investment. Risk capital is money that can be lost without jeopardizing one’s financial security or lifestyle. Only risk capital should be used for trading and only those with sufficient risk capital should consider trading. Past performance is not necessarily indicative of future results. View Full Risk Disclosure.
CFTC Rules 4.41 – Hypothetical or Simulated performance results that have certain inherent limitations. Unlike the results shown in an actual performance record, these results do not represent actual trading. Also, because these trades have not actually been executed, these results may have under-or over-compensated for the impact, if any, of certain market factors, such as lack of liquidity. Simulated or hypothetical trading programs in general are also subject to the fact that they are designed with the benefit of hindsight. No representation is being made that any account will or is likely to achieve profits or losses similar to these being shown.