MT4 Pivot Point Indicator calculates structural price reference levels using one of six selectable methods. The levels are derived from the high, low, close, and in some methods the open of the previous calculation period — producing a central Pivot Point and a set of support and resistance levels positioned symmetrically or asymmetrically around it depending on the method.
The indicator calculates levels using one of the following methods:
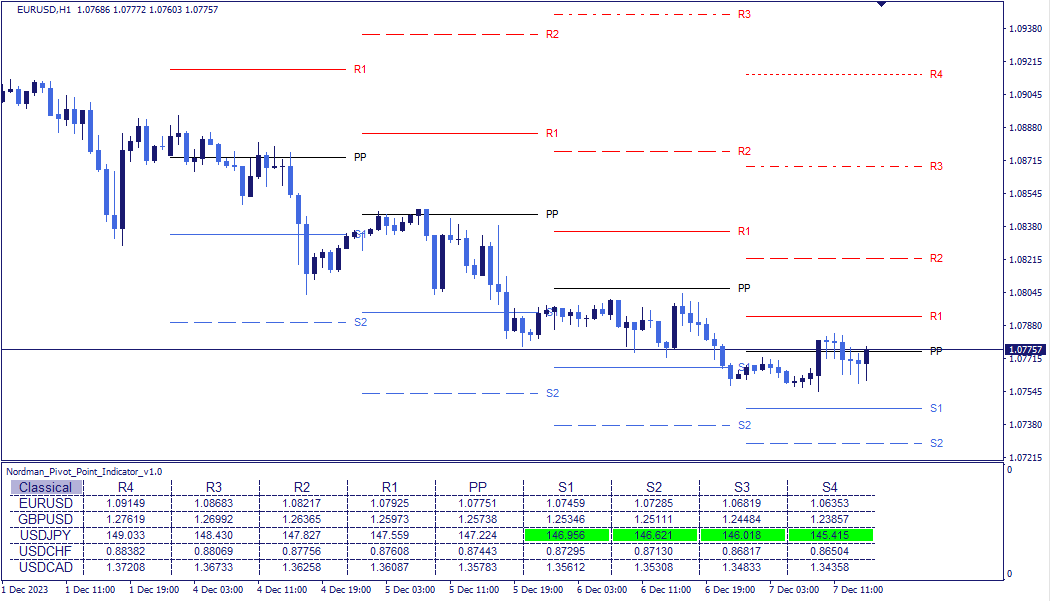
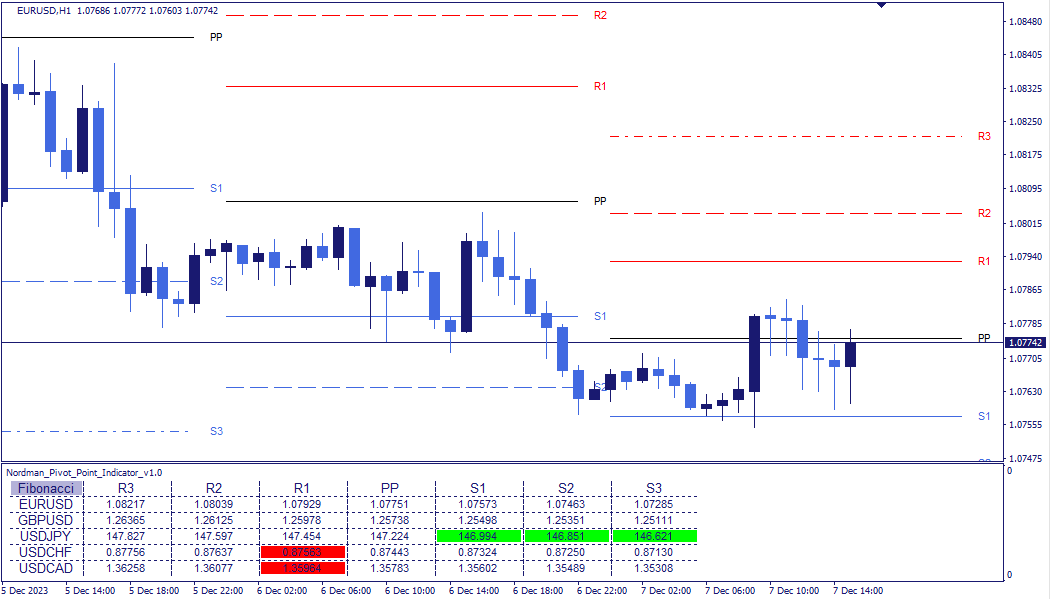
(1) Standard / Classical. The Pivot Point is calculated from the high, low, and close of the previous period. Four support and four resistance levels are derived symmetrically from the Pivot Point using the price range.
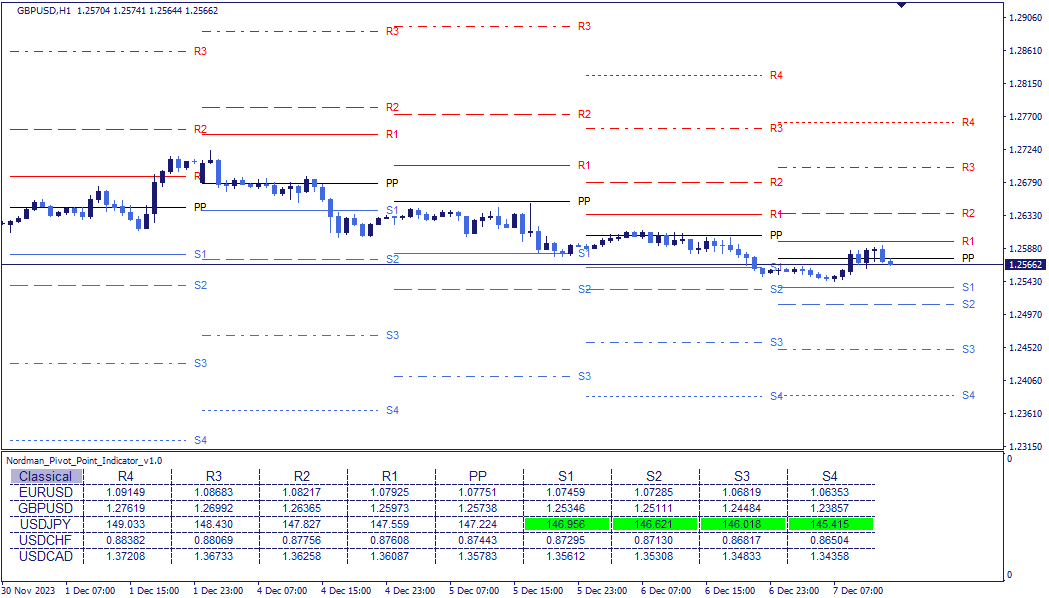
The formula used to calculate Classical Pivot Points is:
(2) Woodie. The opening price of the new period is used instead of the closing price and is given double weight — producing a Pivot Point positioned closer to the current market price. Four support and resistance levels are calculated.

The formula used in the calculation of Woodie Pivot Points are:
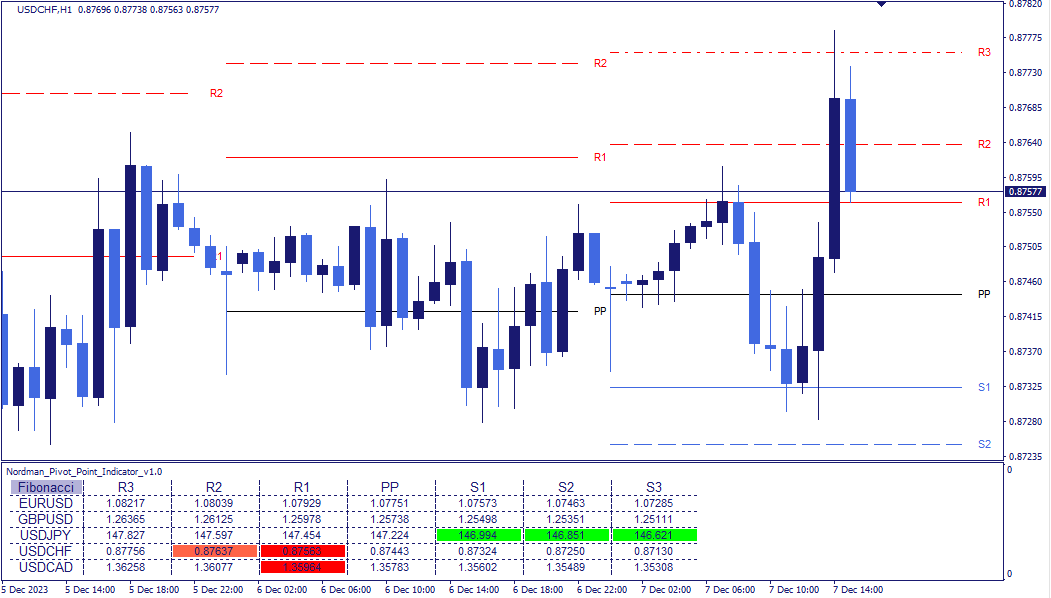
(3) Fibonacci. The Pivot Point is calculated using the standard formula. Additional levels are derived from the price range using Fibonacci ratios. Three support and resistance levels are calculated.
The formula used to calculate Fibonacci Pivot Points is:
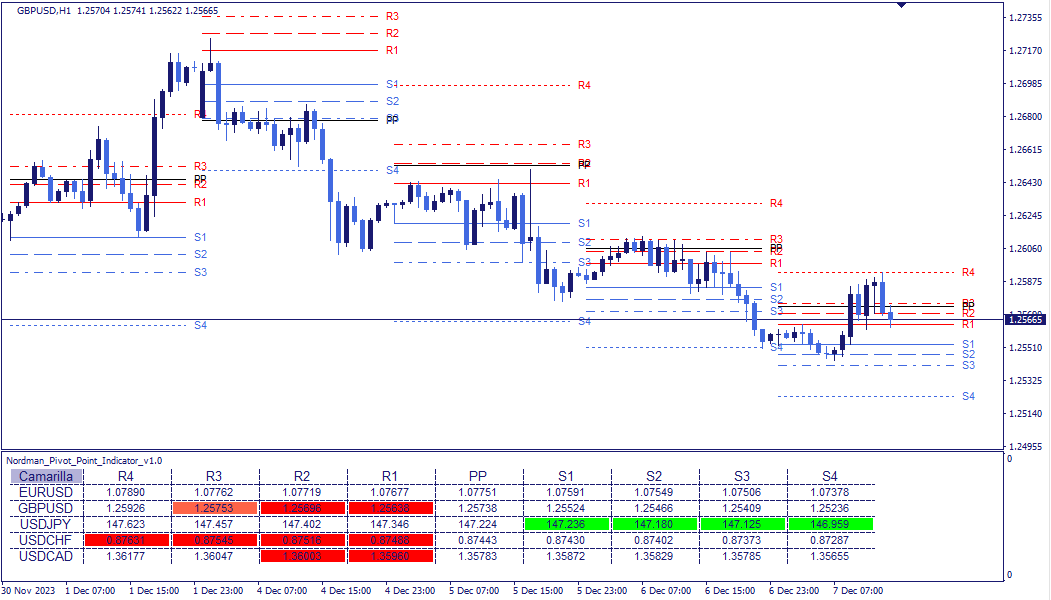
(4) Camarilla. The Pivot Point is calculated using the standard formula. Support and resistance levels are derived from the price range using a fixed multiplier (1.1), positioned symmetrically around the closing price of the calculation period. Four levels are calculated on each side.
The formula used to calculate Camarilla Pivot Points is:
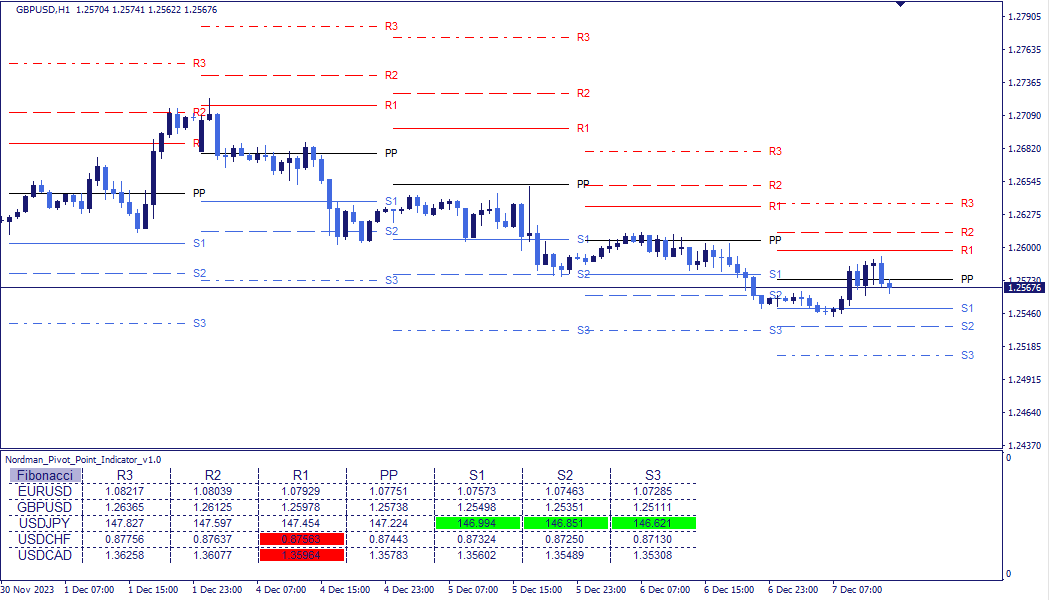
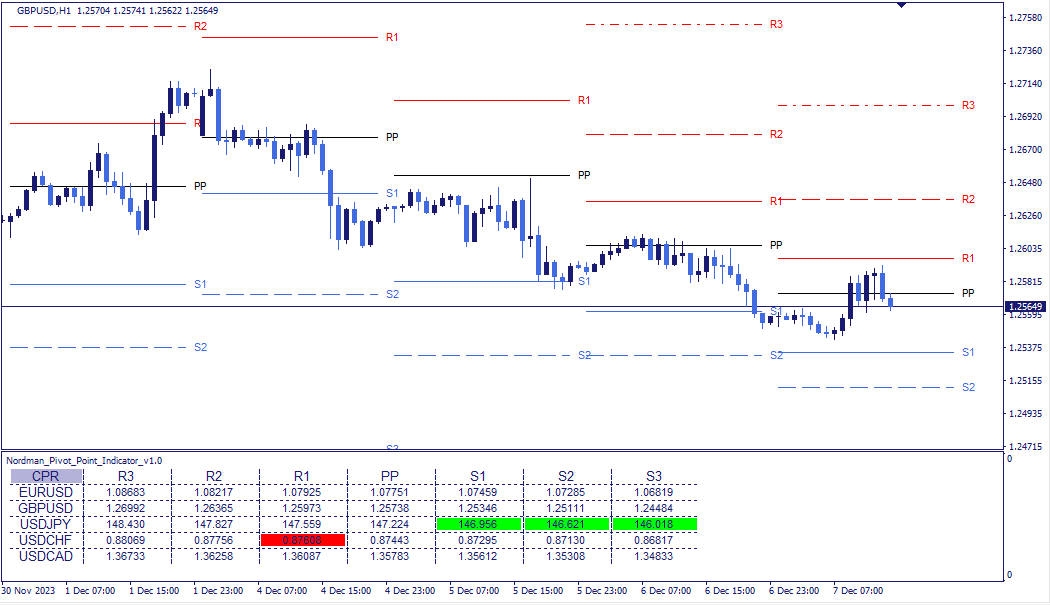
(5) Central Pivot Range (CPR). Two reference levels are calculated: the standard Pivot Point and an additional level derived from the high and low of the period. Three support and resistance levels are calculated.
The formula Central Pivot Range (CPR) calculation:
(6) DeMark. A single reference level and two additional levels are calculated — one support and one resistance. The calculation applies different weights to the high, low, and close depending on the relationship between the closing and opening prices.
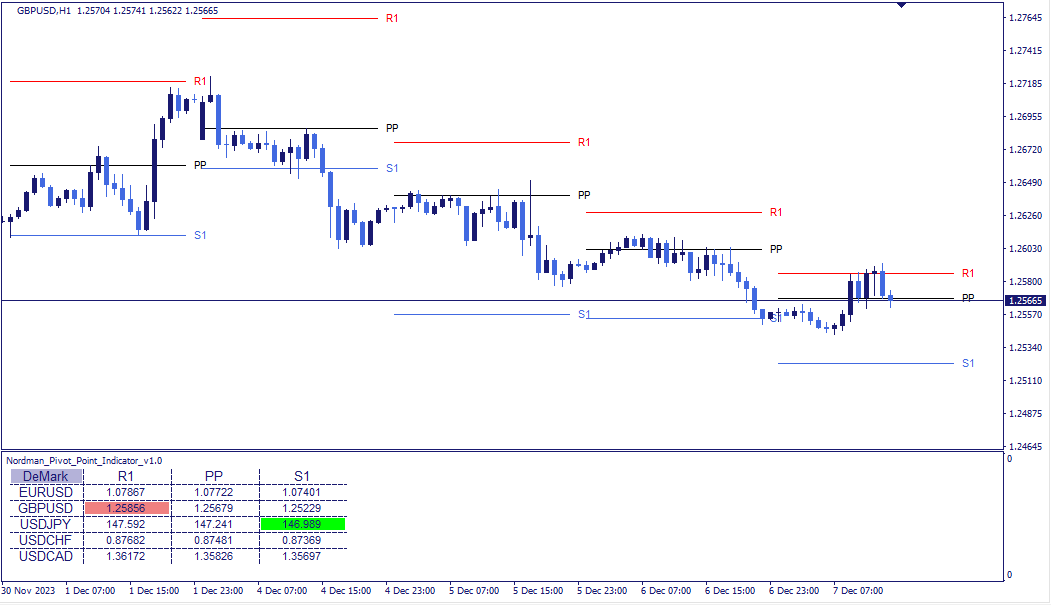
The formula used in calculating DeMark’s Pivot Points:
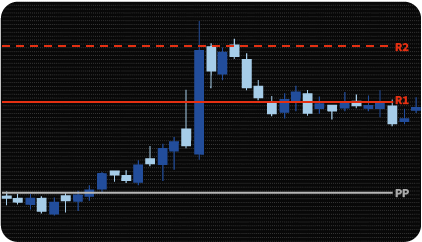
On the chart, the Pivot Point is displayed in black and labeled “PP”. Resistance levels are displayed in red and labeled “R”. Support levels are displayed in blue and labeled “S”. Each level can be enabled or disabled independently in the settings.
The calculation period is configurable across four options: Day, Week, Month, or Custom. The custom option allows the start and end of the calculation interval to be defined in hours and minutes.
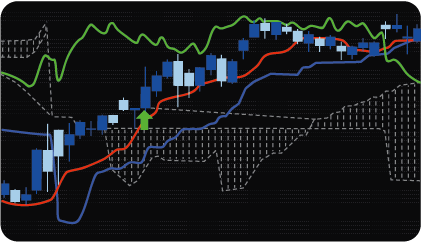
Pivot Point levels are structural reference points derived from the prior period’s price data. The position of the current price relative to the central Pivot Point provides a directional context reading: price above PP reflects a bullish structural context, price below PP reflects a bearish one.
The distance between the session opening price and the Pivot Point provides additional structural context. When the opening price is close to the Pivot Point, price behavior tends toward a ranging condition where the nearest support and resistance levels function as structural boundaries. When the opening price is significantly above or below the Pivot Point, a directional bias is more likely — price may move toward the Pivot Point, interact with it, and then continue in the direction of the prevailing move.
Pivot Point levels are also used as structural reference points for risk parameter definition — the nearest support or resistance level provides a structural boundary that can be used within a position management framework.
Indicator Limitations
Pivot Point levels are calculated from the prior period’s high, low, and close. They represent mathematical reference points based on historical data — they do not predict future price movement and do not guarantee that price will react at any displayed level. All identified levels should be evaluated within a broader analytical framework.
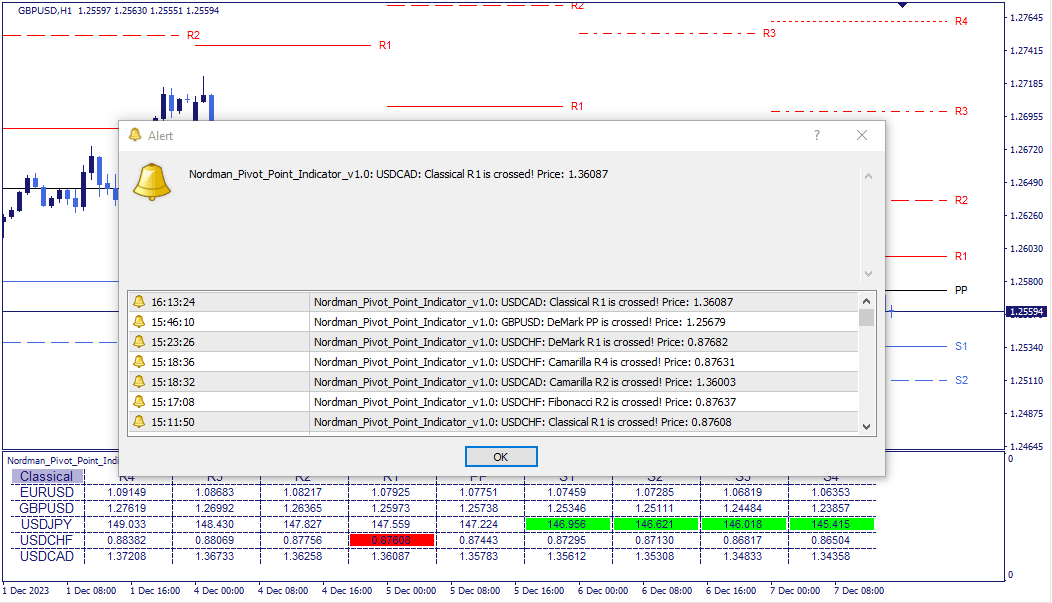
The dashboard displays all Pivot Point levels with their current prices across all monitored assets in a single structured table — assets in rows, level values in columns.
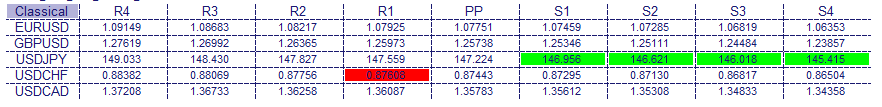 When price approaches a level, the corresponding cell is highlighted: resistance level cells turn red, support level cells turn green. An alert is issued simultaneously. Clicking any row updates the chart to the corresponding asset directly.
The indicator has the following parameters:
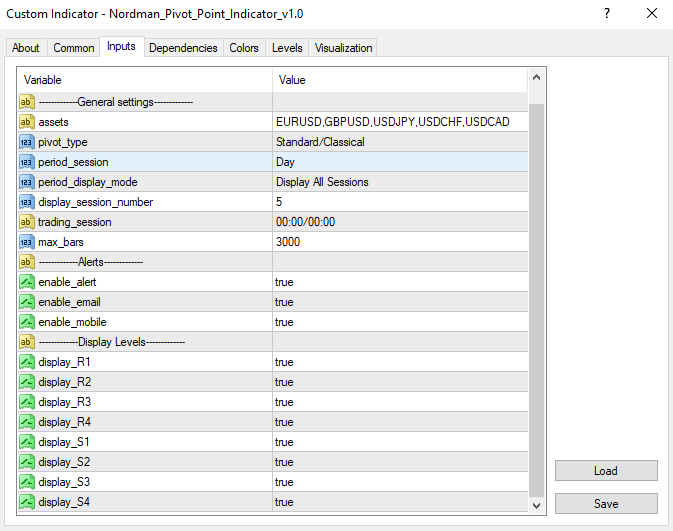
Assets — instruments to include in the scanner, entered as a comma-separated list.
Max_bars — limits the historical calculation depth. Reducing this value improves calculation speed.
Enable alert / Enable email / Enable mobile — alert delivery: platform notifications, email, or mobile — each configurable independently.
Pivot_type — selects the calculation method: Classical, Woodie, Fibonacci, Camarilla, CPR, or DeMark.
Period_session — selects the data period for calculation: Day, Week, Month, or Custom.
Period_display_mode — configures whether one or multiple calculation periods are displayed simultaneously.
Display_session_number — the number of periods to display when multi-period display is enabled.
Trading_session — defines the custom session start and end times in hours and minutes. Applicable only when a custom period is selected.
Display_R1–R4 / S1–S4 — enables or disables individual support and resistance levels independently.

We can customize this indicator to your requirements by adding new features, modifying calculation logic, or combining multiple tools into a unified solution.
We also develop automated trading strategies (Expert Advisors) based on custom logic. The system can include configurable management modules such as dynamic risk parameters, multi-stage trailing stops, additional confirmation filters, and other custom functionality based on your specifications.
The final solution is delivered with full source code and post-delivery support. Contact us for a free consultation to discuss the scope and timeline of your project.
We are committed to the ongoing development and refinement of our indicators. If you’ve spotted a bug, feel that something essential is missing, or have ideas that could make the indicator even better, just send us a message. Your feedback helps us improve and deliver tools that truly meet traders’ needs.
Nordman Algorithms is a trade name of Nordman Algorithms OÜ (Reg. No. 14435535), registered in Tallinn, Estonia.
Software Nature & User Responsibility — Nordman Algorithms provides algorithmic software tools for technical analysis. Nordman Algorithms is not a financial advisor and is not liable for any losses. All trades conducted based on the software’s output are executed at the user’s sole discretion and risk.
Visual Markers & Signal Disclosure — This software may display visual markers (such as arrows, dots, or alerts) when predefined mathematical conditions are met. These markers are provided for educational and analytical purposes only, must not be interpreted as financial guidance, and do not constitute a recommendation to buy, sell, or hold any financial instrument. Users must independently validate all visual cues within their own trading methodology.
No Financial Advice — Nordman Algorithms does not provide discretionary trading signals, investment advice, or managed signal services. Our software represents a mathematical visualization of historical and real-time data. The appearance of a visual marker does not guarantee a profitable trade or predict future market behavior.
Trading Risk Warning — Futures, Forex, and options trading involve significant risk. Risk capital is money that can be lost without jeopardizing financial security. Only risk capital should be used for trading. Past performance is not indicative of future results. View Full Risk Disclosure: https://www.nordman-algorithms.com/risk-disclosure/
ESMA Risk Warning — Financial instruments, especially those involving leverage such as CFDs and Forex, are complex and carry a high risk of rapid financial loss. Our software provides analytical outputs and visual markers based on predefined mathematical conditions and does not mitigate or reduce inherent market risks. You should carefully consider whether you understand how leveraged financial instruments work and whether you can afford the high risk of losing your capital.
CFTC Rule 4.41 — Hypothetical or simulated performance results have inherent limitations. Unlike actual performance records, simulated results do not represent real trading. Because trades have not actually been executed, these results may under- or over-compensate for the impact of market factors such as liquidity. No representation is being made that any account will achieve profits or losses similar to those shown.