
The MACD + Bollinger Bands Indicator combines two analytical layers into a single calculation pipeline. Rather than applying Bollinger Bands to price directly, the indicator first calculates the MACD histogram — which smooths short-term price fluctuations — and then applies Bollinger Bands to the MACD output. The band boundaries are used to distinguish significant histogram movements from minor fluctuations.
This two-stage approach changes what the indicator tracks: instead of registering every MACD histogram reversal, it registers only reversals that are large enough to cross the Bollinger Band boundaries. Minor histogram movements that remain within the band range are displayed in a neutral dark color and do not generate a registered condition. This reduces the frequency of conditions while focusing attention on structurally more significant histogram movements.
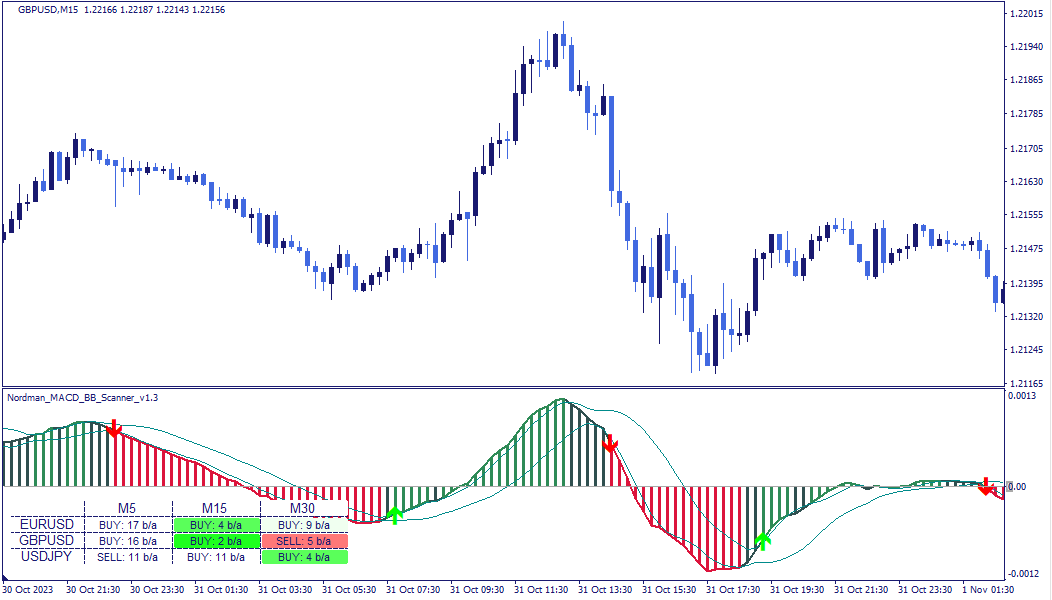
The indicator uses color and directional markers to communicate three distinct states:
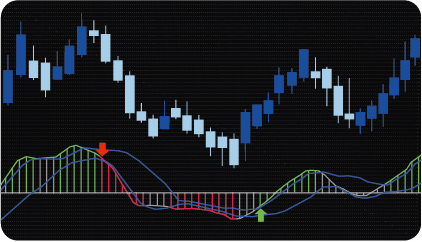
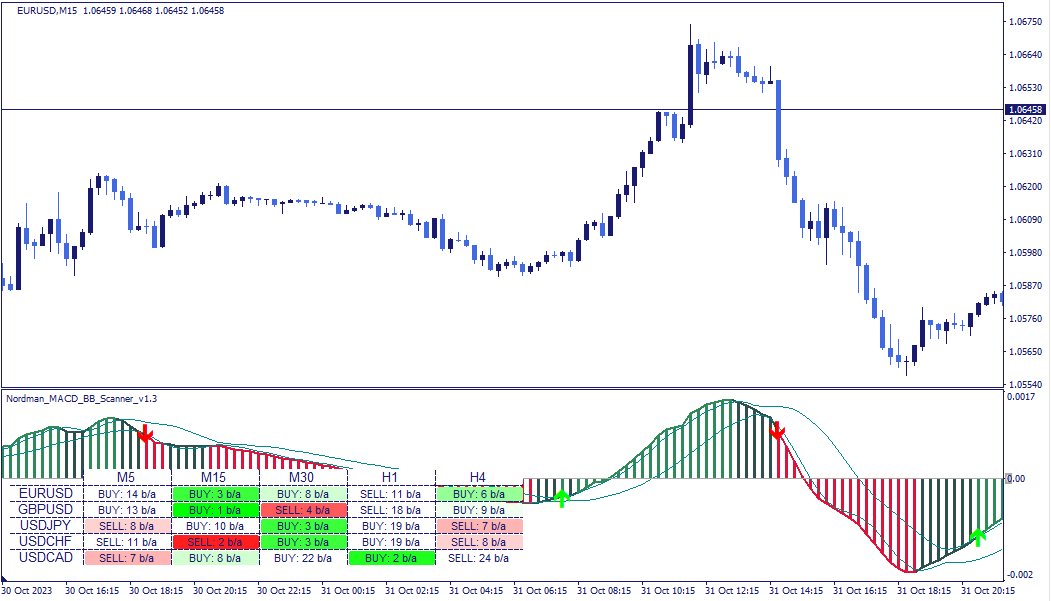
Bullish condition — registered when the MACD histogram crosses above the upper Bollinger Band boundary from below. A green upward arrow appears at the crossover point. The histogram turns bright green following the arrow, indicating active directional momentum.
Bearish condition — registered when the MACD histogram crosses below the lower Bollinger Band boundary from above. A red downward arrow appears at the crossover point. The histogram turns bright red following the arrow.
Neutral zone — when the histogram reverses direction but does not reach the opposite Bollinger Band boundary, it is displayed in a dark neutral color — the same shade regardless of direction. This reflects a period where the MACD is moving but has not yet developed sufficient momentum to reach the band boundary. When the histogram resumes movement toward the active directional side and brightness returns, the prior directional context is re-established.
The zero line can be enabled or disabled in the settings for additional visual reference. The MACD display method can also be switched between histogram and line formats.
The indicator registers two types of analytical readings depending on the timeframe context.
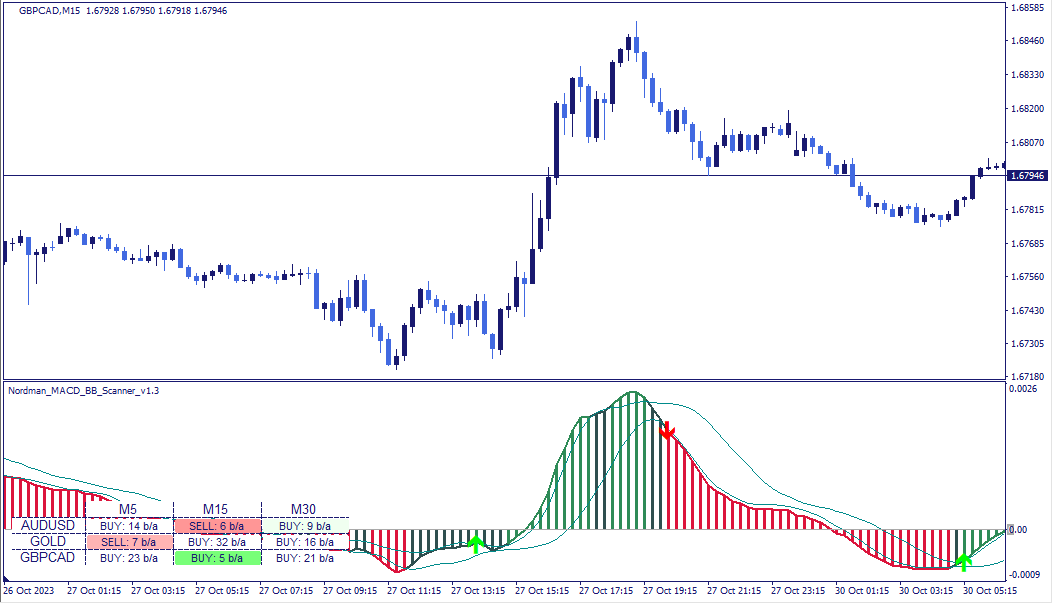
Crossover conditions — a bullish condition is registered when the MACD histogram crosses above the upper Bollinger Band. A bearish condition is registered when it crosses below the lower band. These are the primary registered conditions displayed in the dashboard and marked with directional arrows on the chart.
Trend context on higher timeframes — on longer timeframes, the histogram color provides a directional context reading independent of crossover events. A bright green histogram reflects a bullish directional context; a bright red histogram reflects a bearish one. A dark histogram indicates a neutral zone where no clear directional momentum is present. This color-based reading can be used alongside a lower-timeframe analysis to evaluate whether the broader directional context aligns with shorter-term conditions.
The dashboard displays the current condition status across all monitored assets and timeframes in a structured table — assets in rows, timeframes in columns.
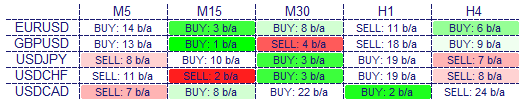
Each cell shows the directional context of the most recently registered condition — bullish or bearish — and the number of bars back at which it was registered. Green cells indicate a bullish condition, red cells a bearish one. Color saturation decreases as the condition becomes less recent. Clicking any cell updates the chart to the corresponding asset and timeframe directly.
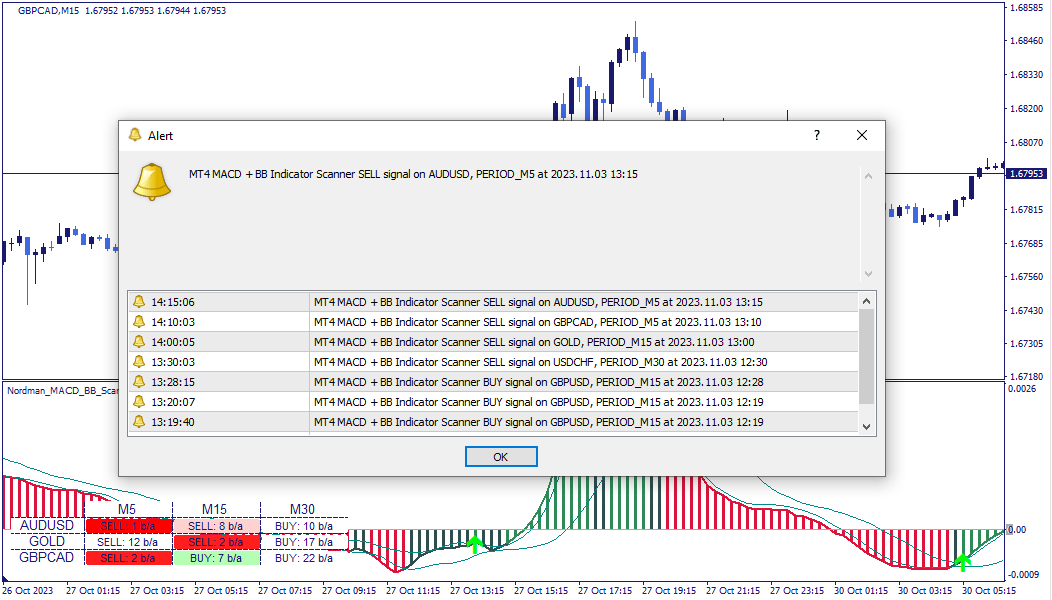
When the indicator initializes, a summary window opens displaying the most recent conditions across all monitored assets and timeframes. During operation, notifications appear when new conditions are registered.
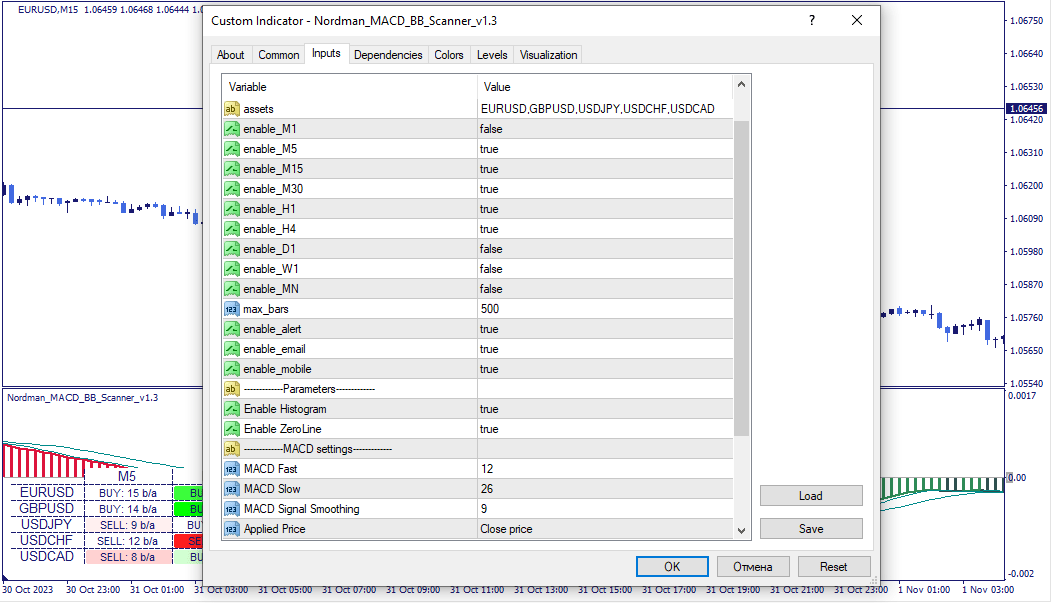
The indicator has the following parameters:
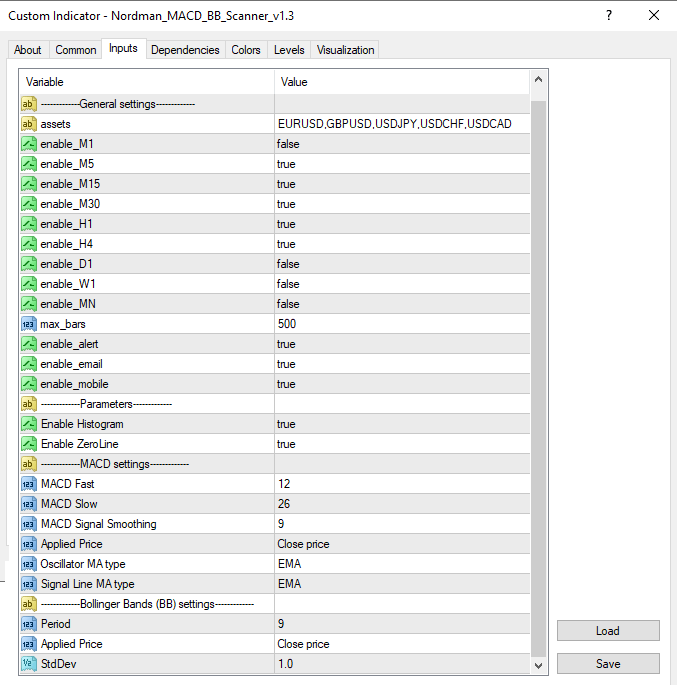
Assets — instruments to include in the scanner.
Enable_M1–MN — include or exclude individual timeframes from the scanner scope.
Max_bars — limits how far back the scanner evaluates conditions. Reducing this value improves calculation speed.
Enable alert / Enable email / Enable mobile — alert delivery: platform notifications, email, or mobile — each configurable independently.
MACD and Bollinger Bands settings — individual parameter configuration for the MACD calculation and the Bollinger Band applied to its output.
Indicator Limitations
The MACD + Bollinger Bands Indicator reflects calculations based on historical price data. Registered conditions indicate that the MACD histogram has crossed a Bollinger Band boundary — they do not predict the magnitude or duration of the subsequent move. The neutral zone between the band boundaries can persist for extended periods, and a histogram reversal from neutral to directional does not guarantee continuation. All registered conditions should be evaluated within a broader analytical framework.

We can customize this indicator to your requirements by adding new features, modifying calculation logic, or combining multiple tools into a unified solution.
We also develop automated trading strategies (Expert Advisors) based on custom logic. The system can include configurable management modules such as dynamic risk parameters, multi-stage trailing stops, additional confirmation filters, and other custom functionality based on your specifications.
The final solution is delivered with full source code and post-delivery support. Contact us for a free consultation to discuss the scope and timeline of your project.
We are committed to the ongoing development and refinement of our indicators. If you’ve spotted a bug, feel that something essential is missing, or have ideas that could make the indicator even better, just send us a message. Your feedback helps us improve and deliver tools that truly meet traders’ needs.
Nordman Algorithms is a trade name of Nordman Algorithms OÜ (Reg. No. 14435535), registered in Tallinn, Estonia.
Software Nature & User Responsibility — Nordman Algorithms provides algorithmic software tools for technical analysis. Nordman Algorithms is not a financial advisor and is not liable for any losses. All trades conducted based on the software’s output are executed at the user’s sole discretion and risk.
Visual Markers & Signal Disclosure — This software may display visual markers (such as arrows, dots, or alerts) when predefined mathematical conditions are met. These markers are provided for educational and analytical purposes only, must not be interpreted as financial guidance, and do not constitute a recommendation to buy, sell, or hold any financial instrument. Users must independently validate all visual cues within their own trading methodology.
No Financial Advice — Nordman Algorithms does not provide discretionary trading signals, investment advice, or managed signal services. Our software represents a mathematical visualization of historical and real-time data. The appearance of a visual marker does not guarantee a profitable trade or predict future market behavior.
Trading Risk Warning — Futures, Forex, and options trading involve significant risk. Risk capital is money that can be lost without jeopardizing financial security. Only risk capital should be used for trading. Past performance is not indicative of future results. View Full Risk Disclosure: https://www.nordman-algorithms.com/risk-disclosure/
ESMA Risk Warning — Financial instruments, especially those involving leverage such as CFDs and Forex, are complex and carry a high risk of rapid financial loss. Our software provides analytical outputs and visual markers based on predefined mathematical conditions and does not mitigate or reduce inherent market risks. You should carefully consider whether you understand how leveraged financial instruments work and whether you can afford the high risk of losing your capital.
CFTC Rule 4.41 — Hypothetical or simulated performance results have inherent limitations. Unlike actual performance records, simulated results do not represent real trading. Because trades have not actually been executed, these results may under- or over-compensate for the impact of market factors such as liquidity. No representation is being made that any account will achieve profits or losses similar to those shown.