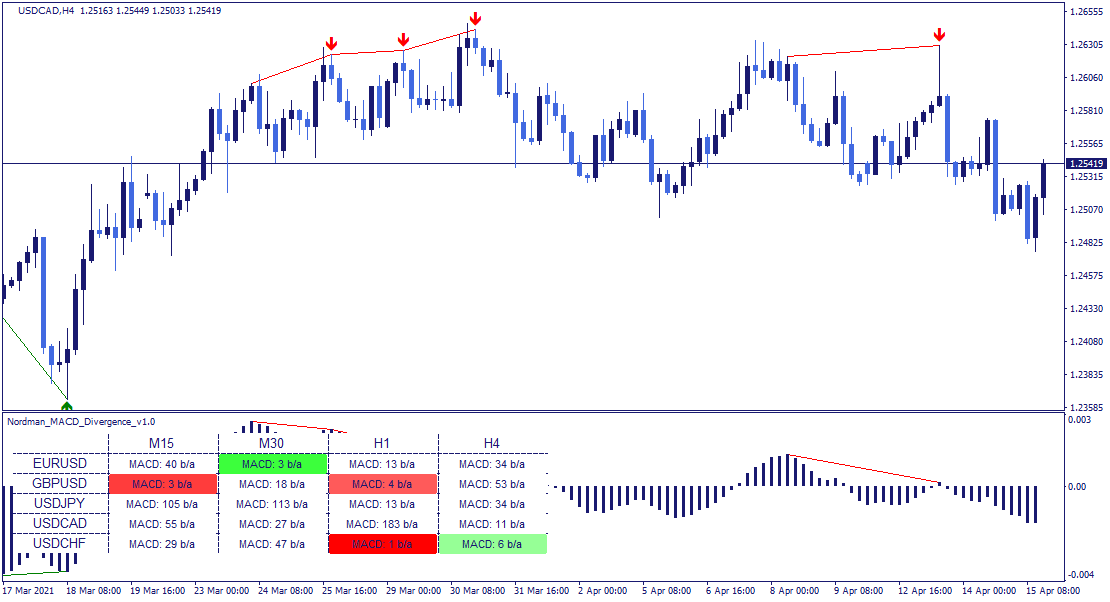
MT4 MACD Divergence Indicator (Scanner) is a technical analysis tool that automatically monitors all specified assets and timeframes to detect classic and hidden divergences between price and the MACD indicator.
Divergence is one of the most widely referenced concepts in technical analysis. It occurs when price movement and MACD movement diverge in direction — a condition that analysts use to evaluate potential shifts in trend momentum or structure.
We have designed this indicator as a dashboard so that you can view the most recent divergences across the assets and timeframes you want to monitor. This approach provides a structured overview of the market at a glance, identifying instruments and timeframes where divergence conditions have recently formed. Clicking on any cell in the dashboard updates the chart to the corresponding instrument and timeframe directly.
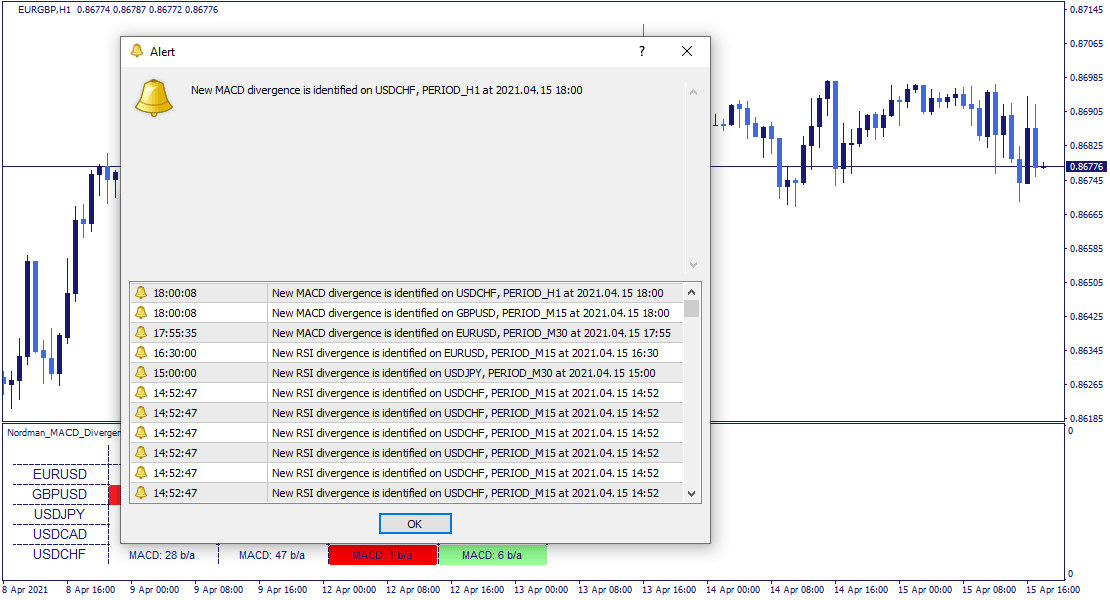
You can configure an alert that will notify you when a divergence condition is registered — without continuous manual monitoring.
Divergence is a discrepancy between what the price chart shows and the direction of the MACD indicator line. The indicator evaluates these discrepancies to identify potential momentum shifts in trend structure.
Traders use divergence to evaluate potential price reversal conditions within a broader analytical framework.
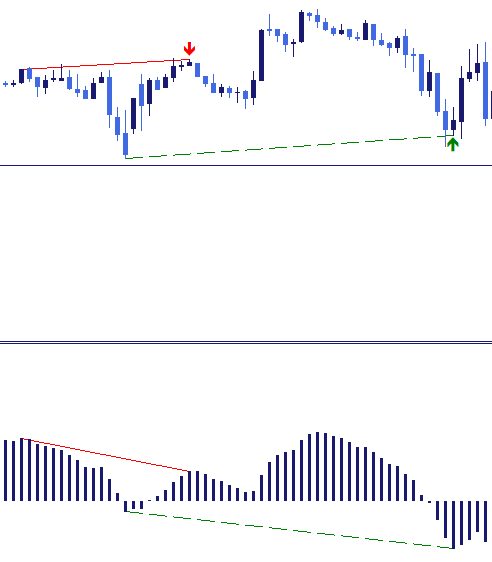
Divergences are divided into two types — bullish and bearish.
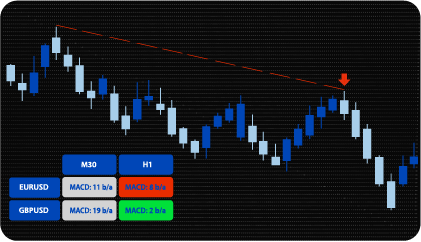
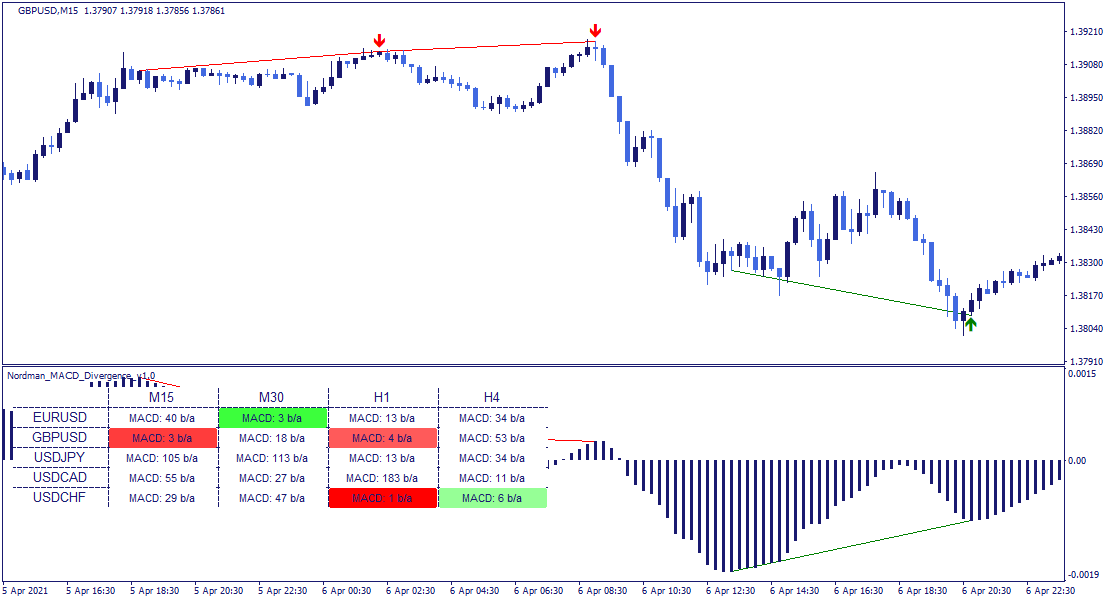
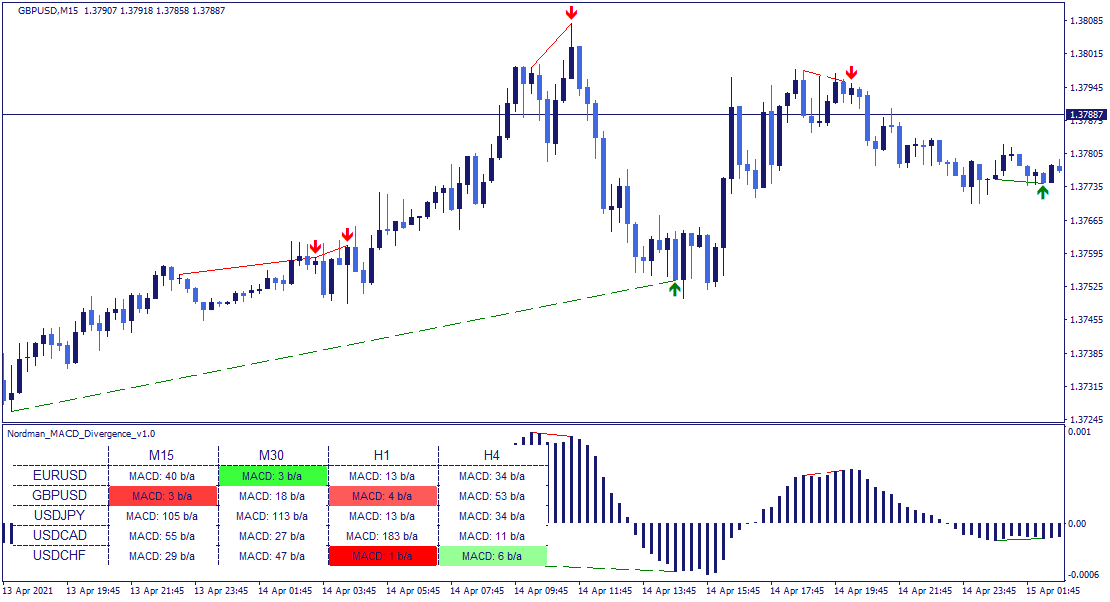
Bearish divergence is registered when price forms a sequence of higher highs in an uptrend, while the MACD does not follow that trend and forms a descending pattern.
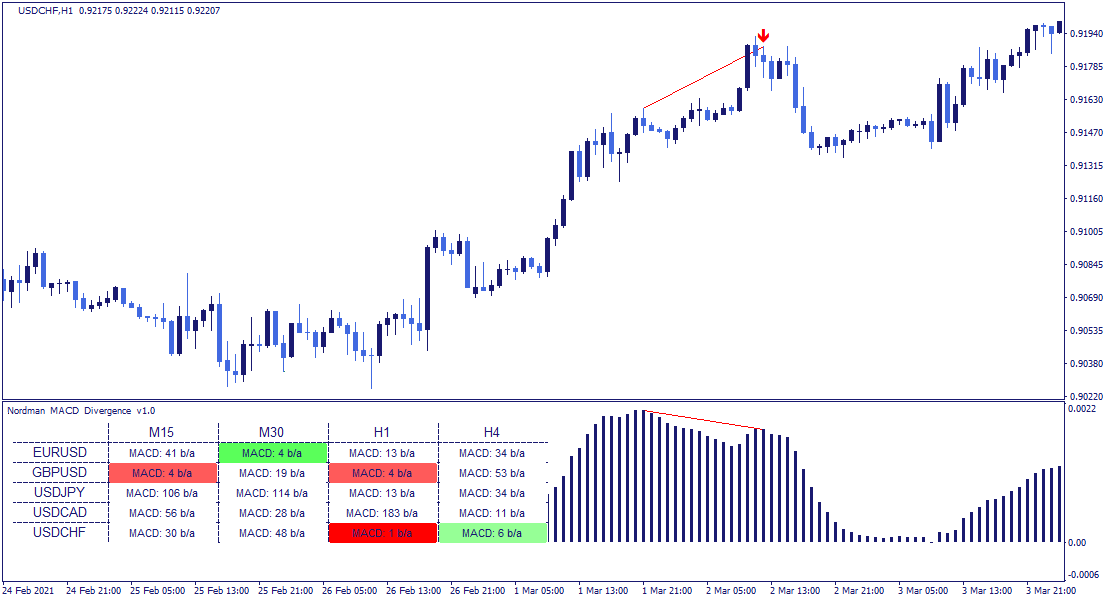
When price rises and the MACD value falls, this registers a bearish divergence condition — reflecting a potential weakening of upward momentum. The indicator displays a red line connecting the relevant price and MACD peaks, and a red directional marker indicating the bearish context.
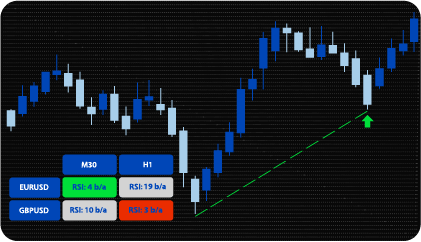
Bullish divergence is registered when price forms a sequence of lower lows in a downtrend, while the MACD does not confirm this by forming an ascending pattern.
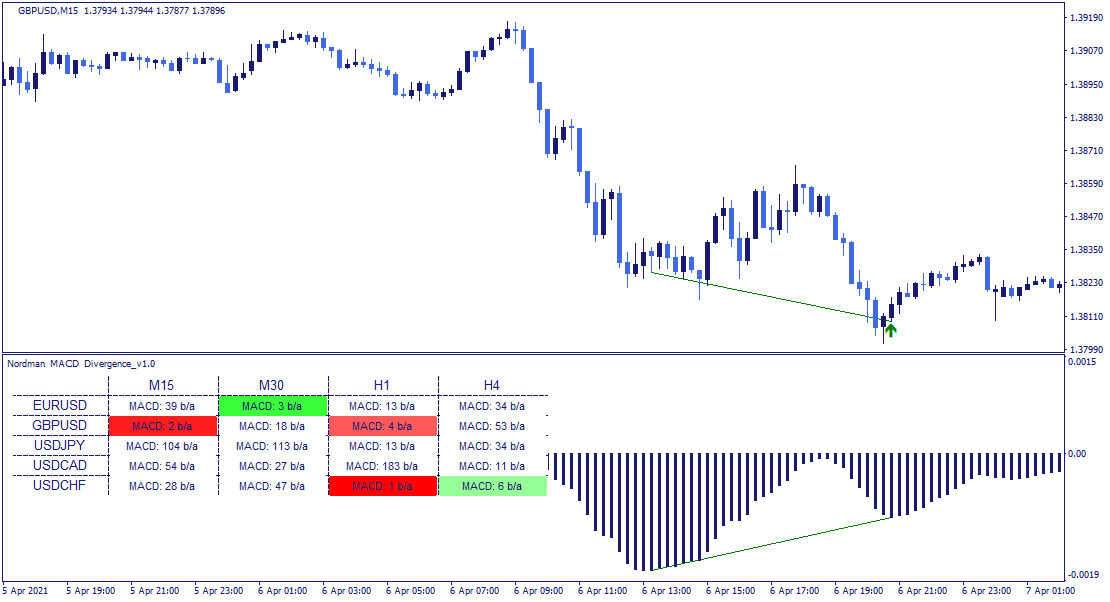
When price falls and the MACD rises, this registers a bullish divergence condition — reflecting a potential shift in downward momentum. The indicator displays a green line connecting the relevant price and MACD troughs, and a green directional marker indicating the bullish context.
The indicator detects two types of divergences: classic and hidden. Classic divergence is displayed as a continuous line; hidden divergence is displayed as a dashed line.
Please note that since divergences are identified using formed indicator vertices, the directional marker will appear 2 bars back. A formed vertex is defined as follows:
Indicator Limitations
MACD divergence detection is based on historical price and oscillator data. Registered divergence conditions do not predict future price movement and do not guarantee that a trend reversal or continuation will follow. The presence of a divergence condition reflects a mathematical discrepancy between price and the MACD — it should be evaluated within a broader analytical framework that considers overall market structure and context.
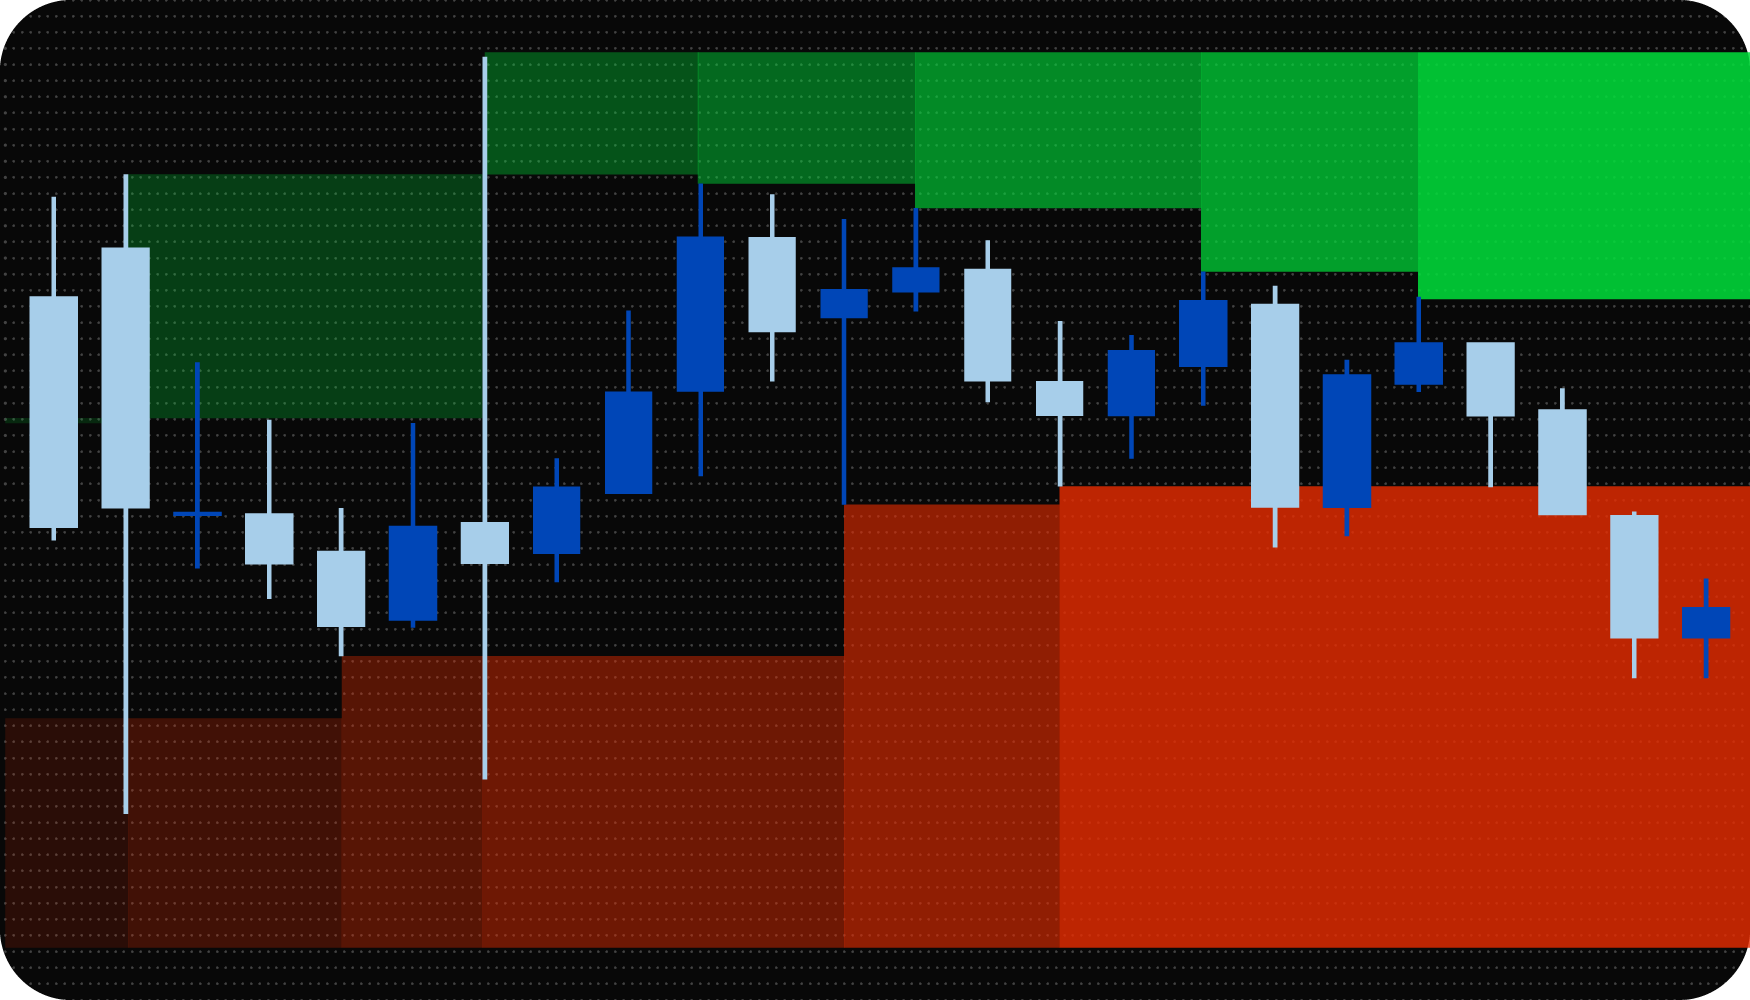
The dashboard provides a structured overview of MACD divergence conditions identified across the selected assets and timeframes.
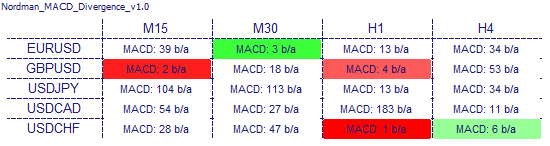
Each asset/timeframe cell displays the most recently detected divergence on that chart. The cell color indicates the directional context — bullish or bearish — with color saturation decreasing as the number of bars since the last detected condition increases. This allows you to prioritize charts where divergence conditions are most recent.
Clicking on any cell updates the chart to the asset and timeframe of the selected cell.
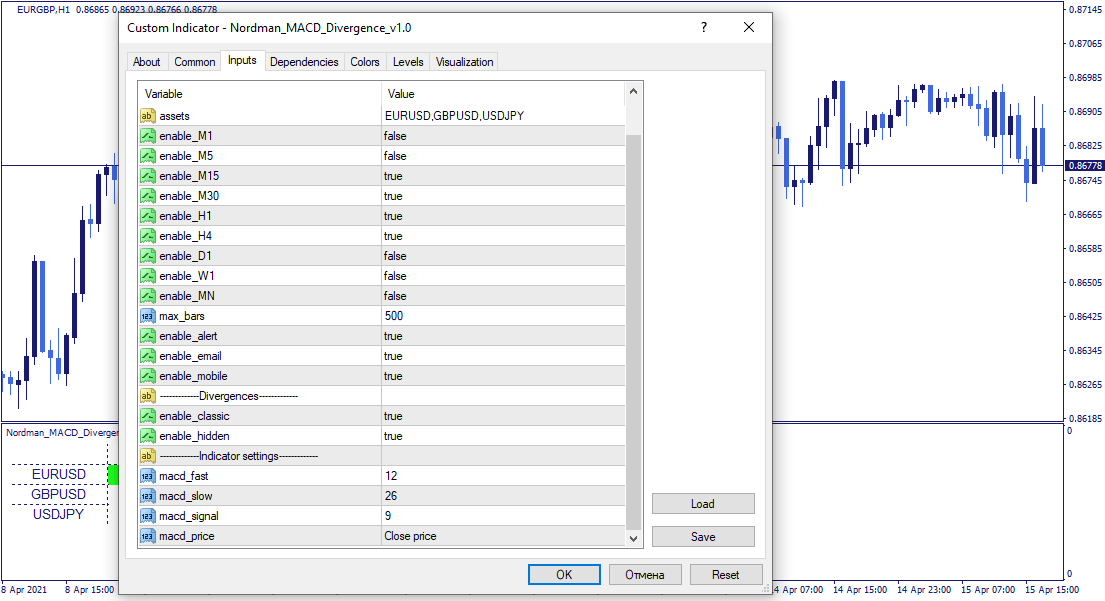
The indicator input parameters are quite simple and do not require any additional explanation.
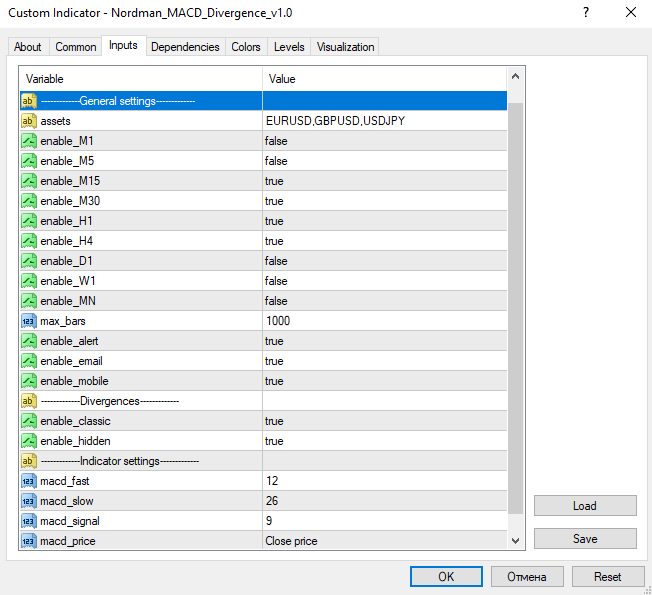
Assets and timeframes — select the instruments and timeframes to monitor.
max_bars — limits the number of bars included in calculations to improve indicator performance. Adjust this parameter if you do not require divergence detection far back in the historical data.
Classic / Hidden divergence display — configurable separately, allowing you to display one or both divergence types on the chart and dashboard.

We can customize this indicator to your requirements by adding new features, modifying calculation logic, or combining multiple tools into a unified solution.
We also develop automated trading strategies (Expert Advisors) based on custom logic. The system can include configurable management modules such as dynamic risk parameters, multi-stage trailing stops, additional confirmation filters, and other custom functionality based on your specifications.
The final solution is delivered with full source code and post-delivery support. Contact us for a free consultation to discuss the scope and timeline of your project.
We are committed to the ongoing development and refinement of our indicators. If you’ve spotted a bug, feel that something essential is missing, or have ideas that could make the indicator even better, just send us a message. Your feedback helps us improve and deliver tools that truly meet traders’ needs.
Nordman Algorithms is a trade name of Nordman Algorithms OÜ (Reg. No. 14435535), registered in Tallinn, Estonia.
Software Nature & User Responsibility — Nordman Algorithms provides algorithmic software tools for technical analysis. Nordman Algorithms is not a financial advisor and is not liable for any losses. All trades conducted based on the software’s output are executed at the user’s sole discretion and risk.
Visual Markers & Signal Disclosure — This software may display visual markers (such as arrows, dots, or alerts) when predefined mathematical conditions are met. These markers are provided for educational and analytical purposes only, must not be interpreted as financial guidance, and do not constitute a recommendation to buy, sell, or hold any financial instrument. Users must independently validate all visual cues within their own trading methodology.
No Financial Advice — Nordman Algorithms does not provide discretionary trading signals, investment advice, or managed signal services. Our software represents a mathematical visualization of historical and real-time data. The appearance of a visual marker does not guarantee a profitable trade or predict future market behavior.
Trading Risk Warning — Futures, Forex, and options trading involve significant risk. Risk capital is money that can be lost without jeopardizing financial security. Only risk capital should be used for trading. Past performance is not indicative of future results. View Full Risk Disclosure: https://www.nordman-algorithms.com/risk-disclosure/
ESMA Risk Warning — Financial instruments, especially those involving leverage such as CFDs and Forex, are complex and carry a high risk of rapid financial loss. Our software provides analytical outputs and visual markers based on predefined mathematical conditions and does not mitigate or reduce inherent market risks. You should carefully consider whether you understand how leveraged financial instruments work and whether you can afford the high risk of losing your capital.
CFTC Rule 4.41 — Hypothetical or simulated performance results have inherent limitations. Unlike actual performance records, simulated results do not represent real trading. Because trades have not actually been executed, these results may under- or over-compensate for the impact of market factors such as liquidity. No representation is being made that any account will achieve profits or losses similar to those shown.