MT4 Support and Resistance Zones indicator is a special tool that allows identifying major support and resistance zones where price has historically interacted — either a reversal or a breakout with momentum expansion. The zones can be identified based on how price behaves around specific levels or ranges.
The indicator allows you to visualize the market key levels, where price has previously shown repeated interaction — suggesting structural significance rather than random occurrence. The more stops (touches) there are – the more significant the zone is.
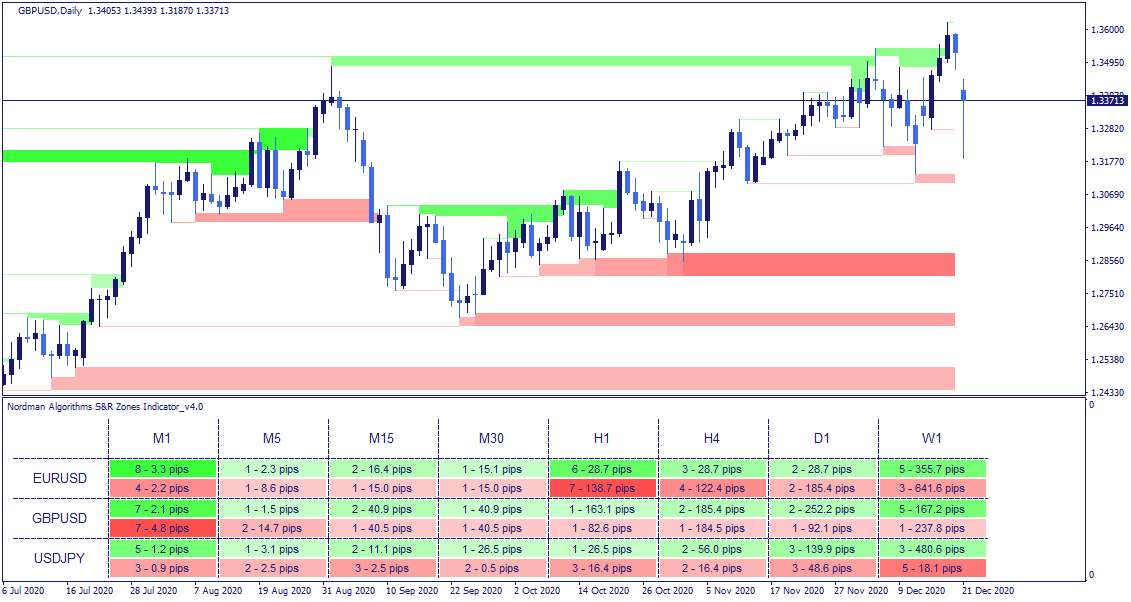
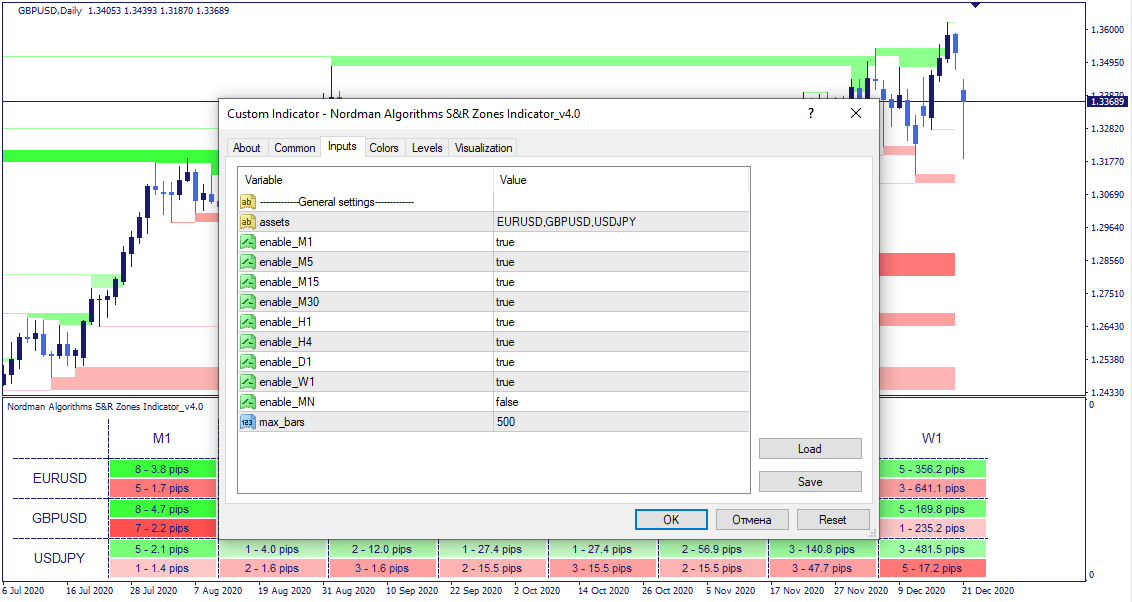
We have designed this indicator in a form of a dashboard in order to allow you to visualize the nearest zones and their related strengths across selected currencies and timeframes. Such approach provides the ability to view the market at a glance identifying instruments and timeframes where zones of higher structural significance are currently present.
There are 2 main price interaction patterns that this indicator is designed to highlight — a bounce condition and a breakout condition
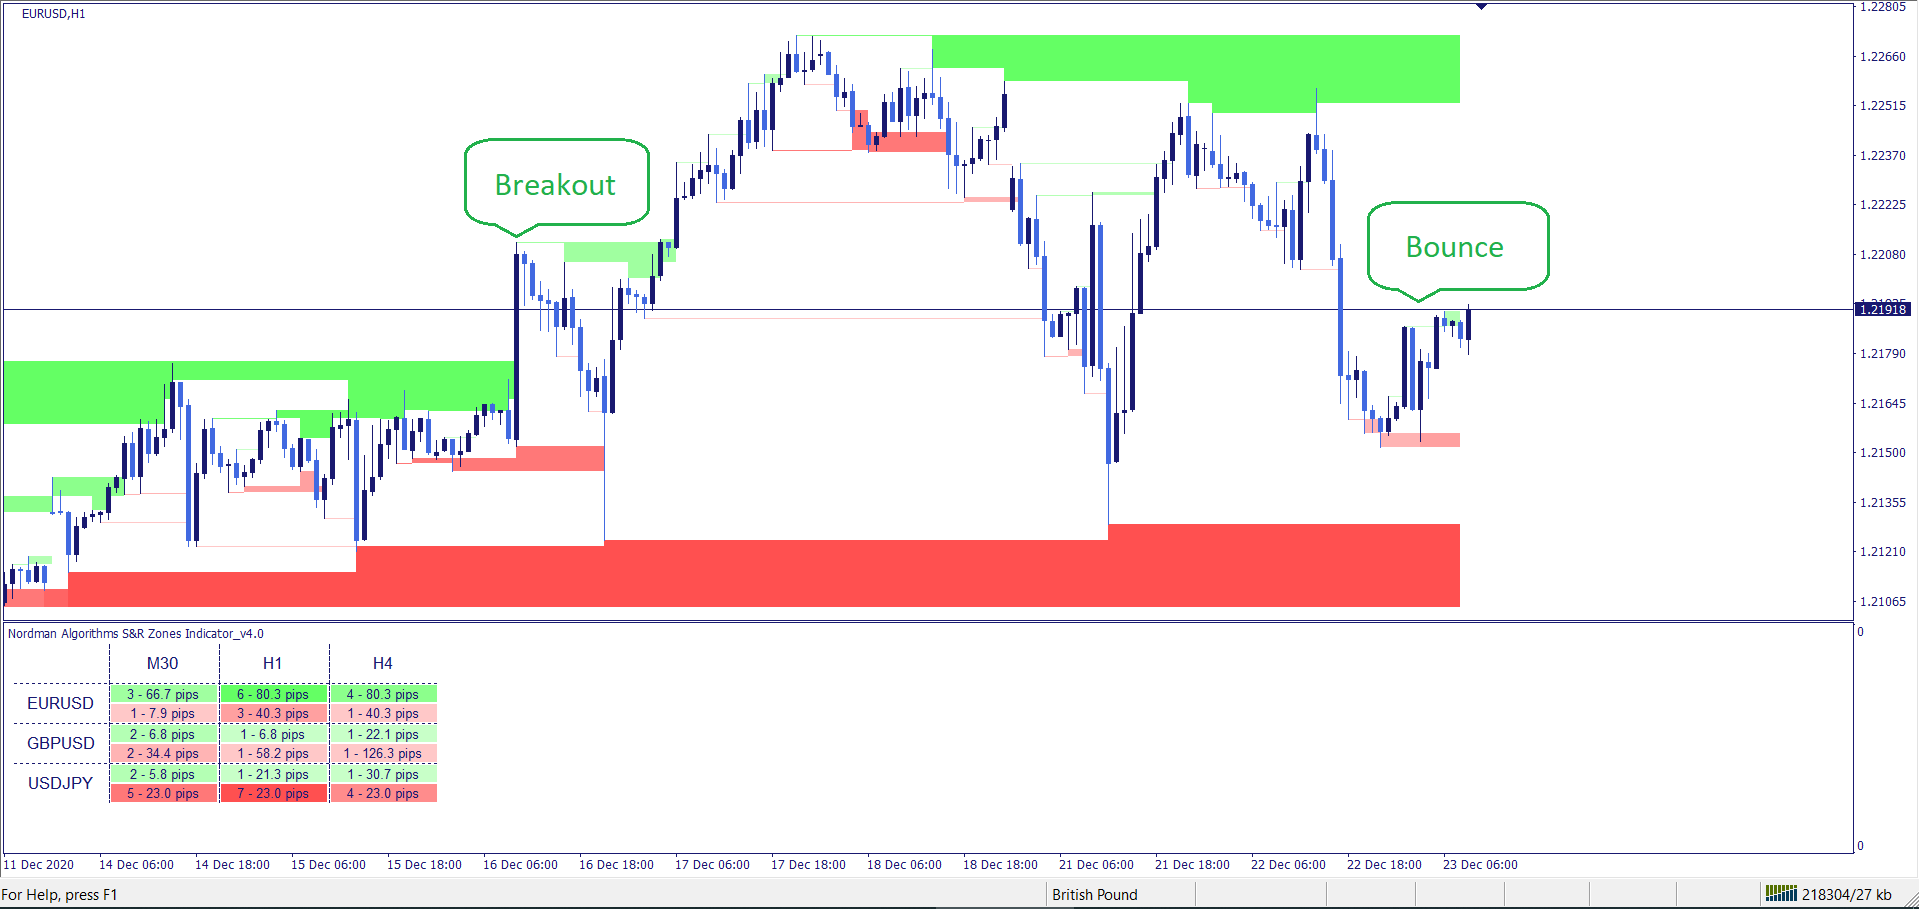
A bounce condition is observed when price reverses at a zone boundary. A breakout condition is observed when price moves through the zone — historically, this has historically been associated with continued directional movement following the breakout.
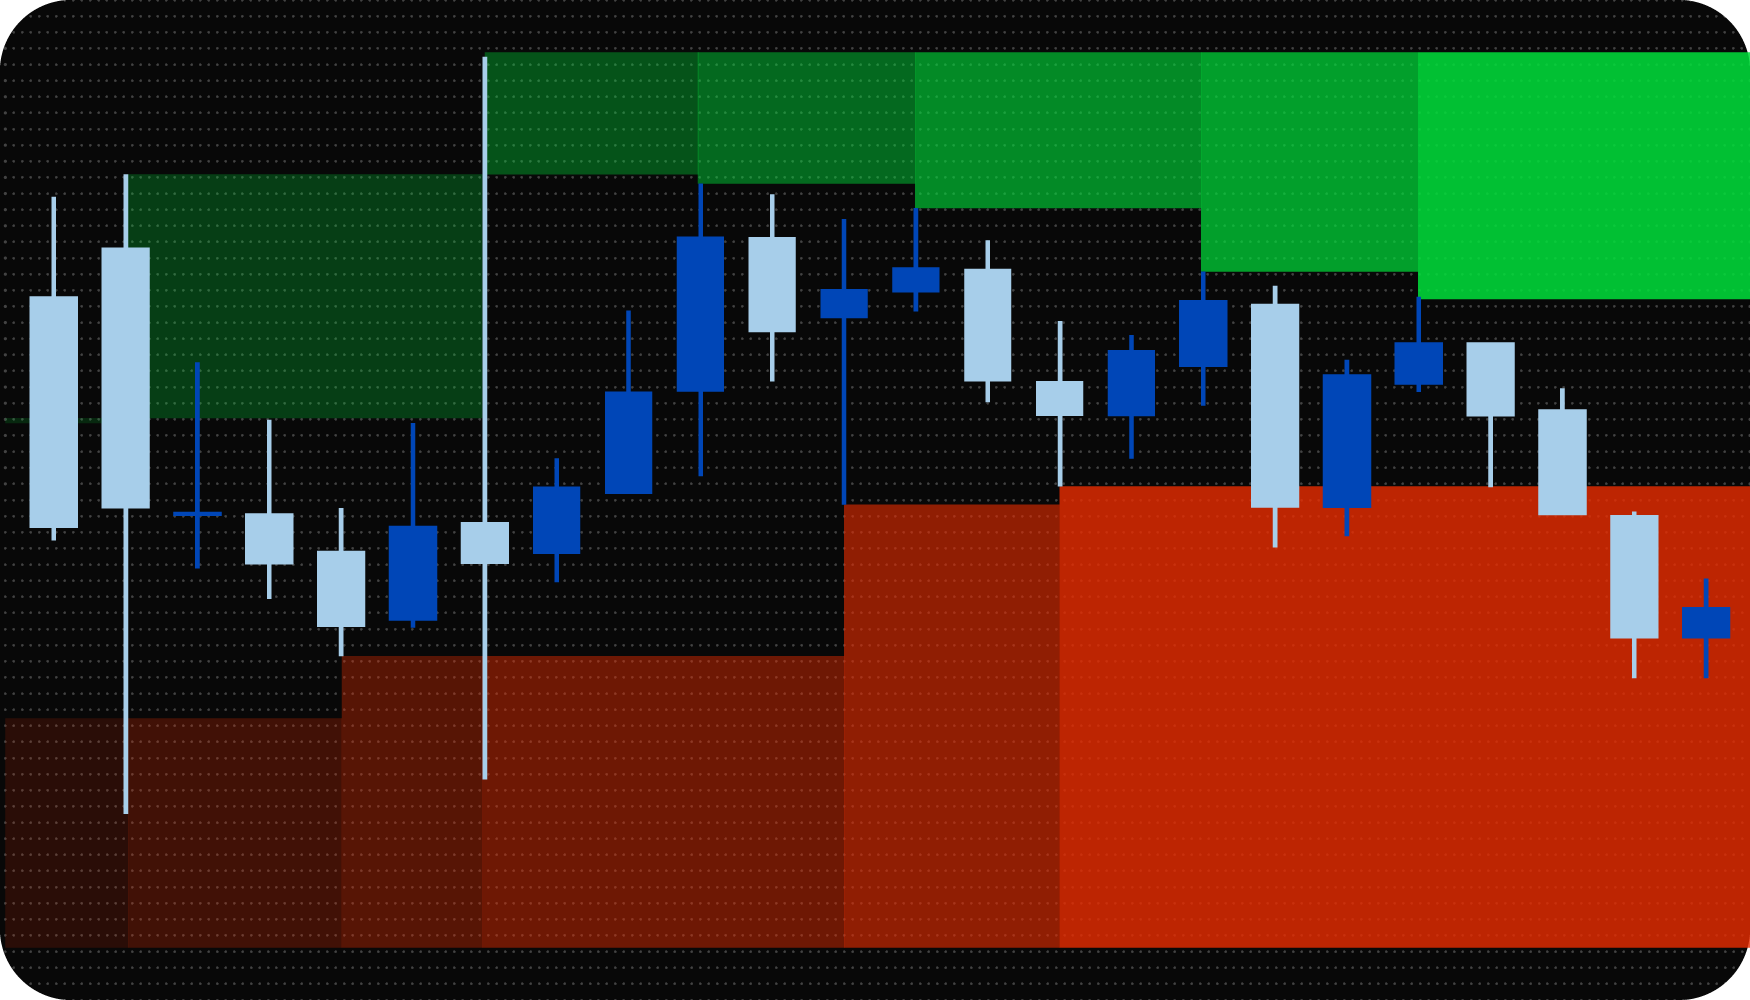
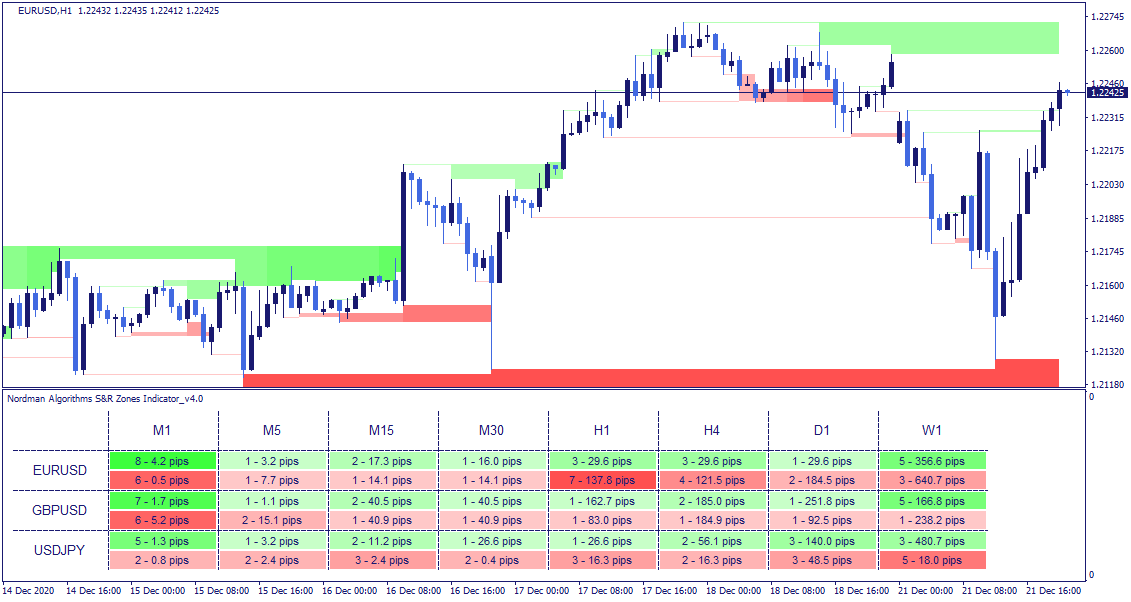
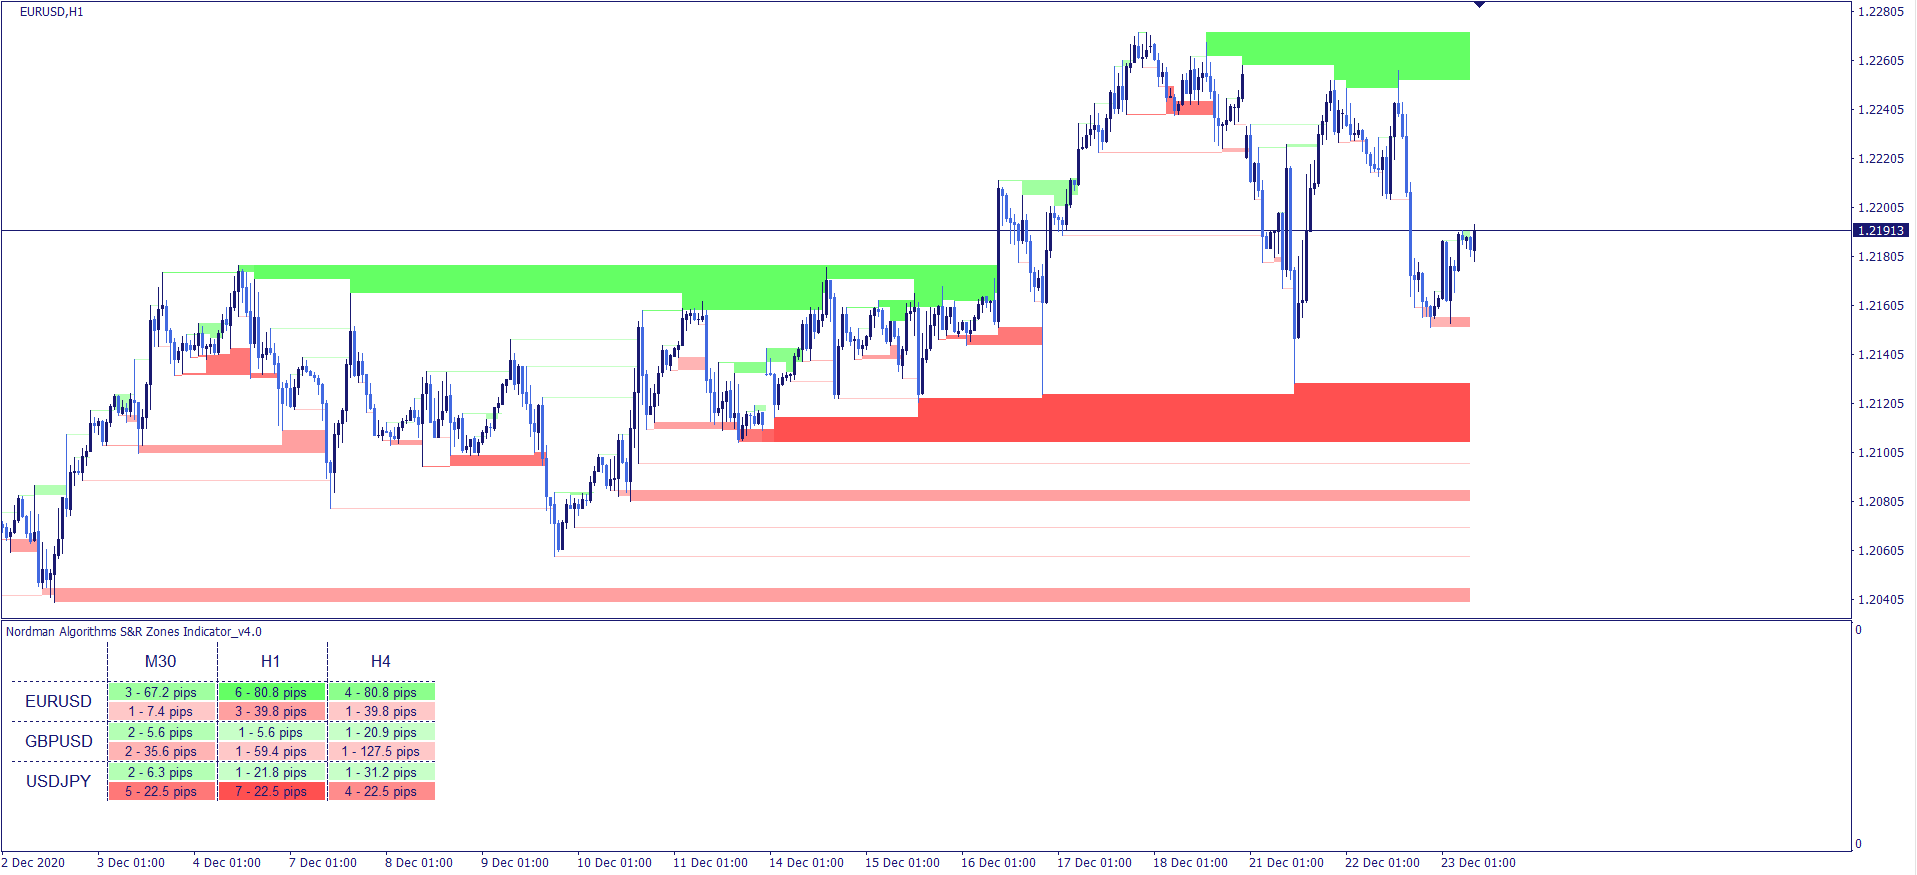
Basically, the indicator draws Support and Resistance zones across the market – red for Support (below the market) and green for Resistance (above the market). Zones are changing during the time in terms of size and strength. They can widen (often) or narrow (rarely); they can become stronger or decrease in strength and become weaker.
While the size of a zone is self-explanatory, the strength is represented by a color. The stronger the zone is, the darker its color would be. You can check the zone strength by hovering a mouse over it. The weakest zones have strength around 1-2, the zones of a middle strength are 3-5 and the strongest zones have 6-10 strength index (it can be even more in rare cases).
Zones with higher strength and wider ranges have historically shown more frequent price interaction. A breakout through a high-strength zone has historically been associated with stronger subsequent momentum — though past behavior does not guarantee future outcomes.
The dashboard provides a structured overview of support and resistance zones across multiple assets and timeframes.
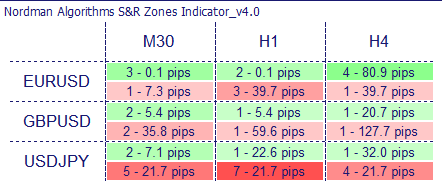
Each currency pair/timeframe cell contains 2 boxes – green and red. The green box contains the information about the nearest Resistance zone located on the related chart, while the red box – about the nearest Support zone. The info in each box is designed in the following format:
X – Y pips
Where X is the strength index of the nearest Support/Resistance zone on the related chart and Y – is the amount of pips the zone is located away from the current market price. This allows you to identify charts where high-strength zones are located close to the current price — for prioritized review within your analytical workflow.
Support and resistance zones are identified based on historical price behavior and do not predict future price movement. Zone strength reflects historical interaction frequency — not a guarantee of future price reaction. All identified zones should be evaluated within a broader analytical framework.
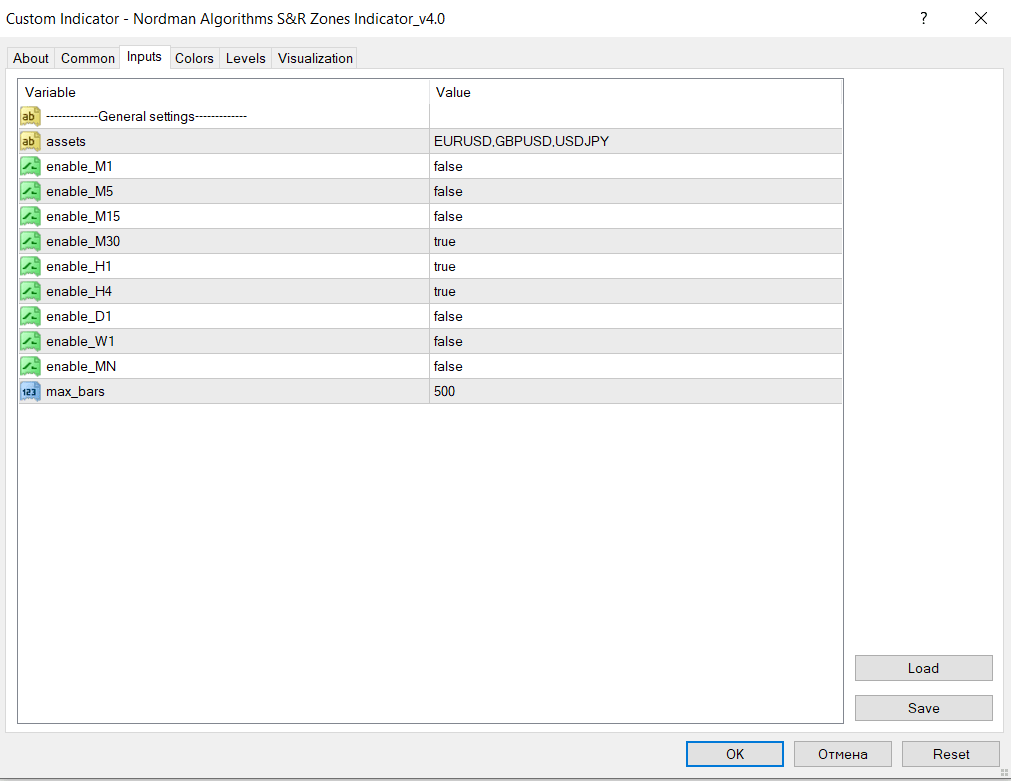
The indicator parameters allow you to configure the monitored asset scope and calculation depth. It allows you to select the currency pairs and timeframes that you want to monitor. Parameter “max_bars” limits the amount of calculations in order to speed up the indicator in case you do not need it to calculate zones too far in the past.

We can customize this indicator to your requirements by adding new features, modifying calculation logic, or combining multiple tools into a unified solution.
We also develop automated trading strategies (Expert Advisors) based on custom logic. The system can include configurable management modules such as dynamic risk parameters, multi-stage trailing stops, additional confirmation filters, and other custom functionality based on your specifications.
The final solution is delivered with full source code and post-delivery support. Contact us for a free consultation to discuss the scope and timeline of your project.
We are committed to the ongoing development and refinement of our indicators. If you’ve spotted a bug, feel that something essential is missing, or have ideas that could make the indicator even better, just send us a message. Your feedback helps us improve and deliver tools that truly meet traders’ needs.
Nordman Algorithms is a trade name of Nordman Algorithms OÜ (Reg. No. 14435535), registered in Tallinn, Estonia.
Software Nature & User Responsibility — Nordman Algorithms provides algorithmic software tools for technical analysis. Nordman Algorithms is not a financial advisor and is not liable for any losses. All trades conducted based on the software’s output are executed at the user’s sole discretion and risk.
Visual Markers & Signal Disclosure — This software may display visual markers (such as arrows, dots, or alerts) when predefined mathematical conditions are met. These markers are provided for educational and analytical purposes only, must not be interpreted as financial guidance, and do not constitute a recommendation to buy, sell, or hold any financial instrument. Users must independently validate all visual cues within their own trading methodology.
No Financial Advice — Nordman Algorithms does not provide discretionary trading signals, investment advice, or managed signal services. Our software represents a mathematical visualization of historical and real-time data. The appearance of a visual marker does not guarantee a profitable trade or predict future market behavior.
Trading Risk Warning — Futures, Forex, and options trading involve significant risk. Risk capital is money that can be lost without jeopardizing financial security. Only risk capital should be used for trading. Past performance is not indicative of future results. View Full Risk Disclosure: https://www.nordman-algorithms.com/risk-disclosure/
ESMA Risk Warning — Financial instruments, especially those involving leverage such as CFDs and Forex, are complex and carry a high risk of rapid financial loss. Our software provides analytical outputs and visual markers based on predefined mathematical conditions and does not mitigate or reduce inherent market risks. You should carefully consider whether you understand how leveraged financial instruments work and whether you can afford the high risk of losing your capital.
CFTC Rule 4.41 — Hypothetical or simulated performance results have inherent limitations. Unlike actual performance records, simulated results do not represent real trading. Because trades have not actually been executed, these results may under- or over-compensate for the impact of market factors such as liquidity. No representation is being made that any account will achieve profits or losses similar to those shown.