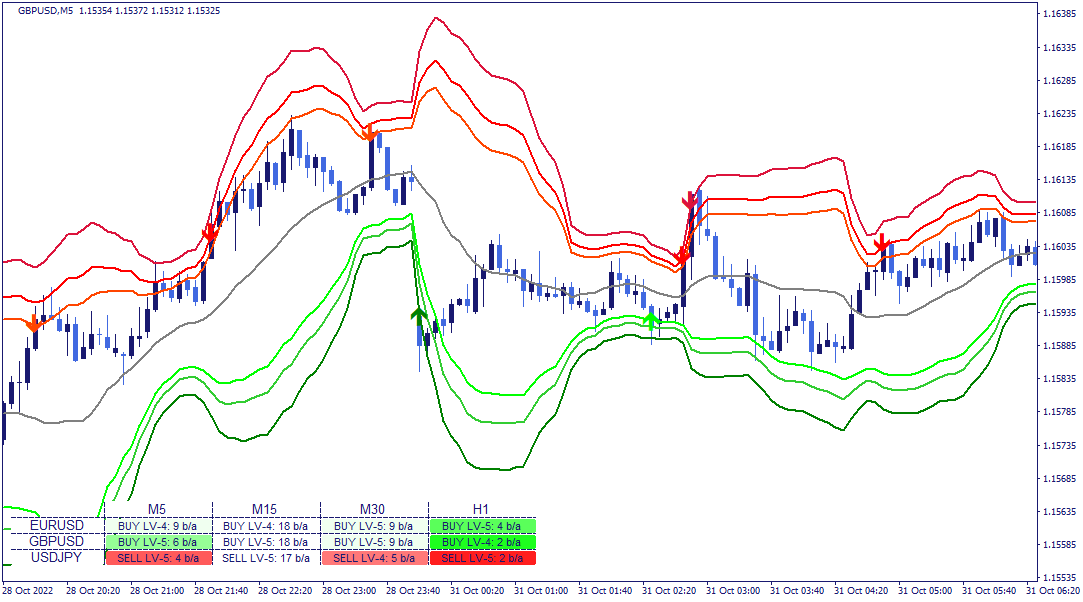
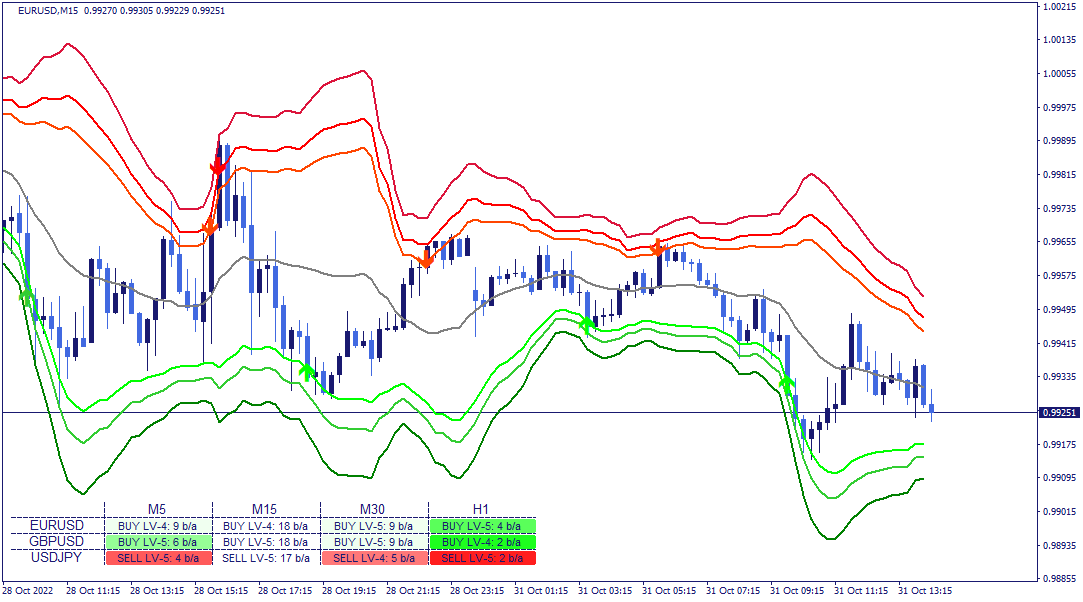
The Fibonacci + Bollinger Bands Indicator combines a dynamic baseline with Fibonacci-ratio-based bands plotted above and below it. The baseline represents the average price over a defined period — calculated using SMA, EMA, or VWMA depending on the configuration. The bands are positioned at Fibonacci ratio distances from this baseline, scaled by either standard deviation or ATR depending on the selected calculation mode.
The analytical premise is straightforward: when price moves away from its statistical average, the distance of that deviation can be measured and contextualized using Fibonacci ratios. The further price moves from the baseline, the more structurally extended the deviation becomes relative to recent price behavior.
The indicator evaluates conditions on closed bars only — a directional marker appears only when the interaction with a band level is fully confirmed on a completed bar. This means registered conditions do not redraw.
The indicator supports two band calculation modes, selectable in the settings.
Standard Deviation mode — bands are calculated by multiplying the standard deviation of recent price data by each Fibonacci ratio. Up to six band levels can be configured at Fibonacci ratios: 0.236, 0.382, 0.5, 0.618, 0.764, and 1.0. Each level can be enabled or disabled independently.
ATR Deviation mode — bands are calculated by multiplying a smoothed Average True Range value by each Fibonacci ratio. Three band levels are available at Fibonacci ratios: 1.618, 2.618, and 4.236 — the extended ratios that reflect larger deviations from the baseline. Each level can be enabled or disabled independently.
The two modes reflect different approaches to measuring deviation: Standard Deviation mode scales bands relative to statistical price dispersion, while ATR Deviation mode scales bands relative to average price range. The choice affects both the positioning of the bands and their responsiveness to volatility changes.
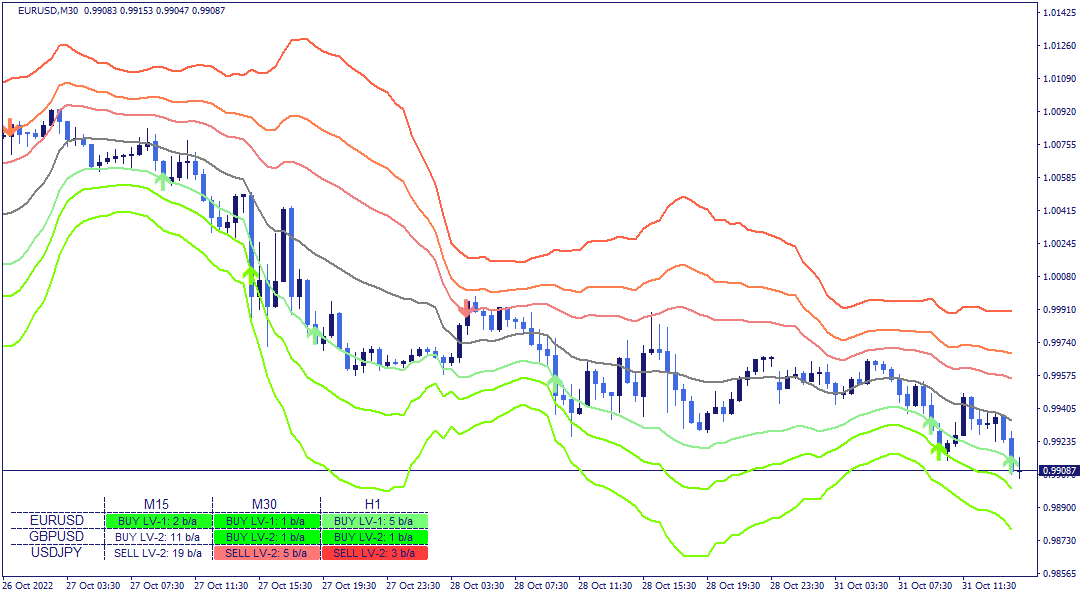
The indicator registers a condition when price interacts with a band level — crossing it from below or above. The directional context of the registered condition reflects the direction of the interaction: a bullish condition is registered when price crosses a band from above back toward the baseline, and a bearish condition when price crosses a band from below back toward the baseline.
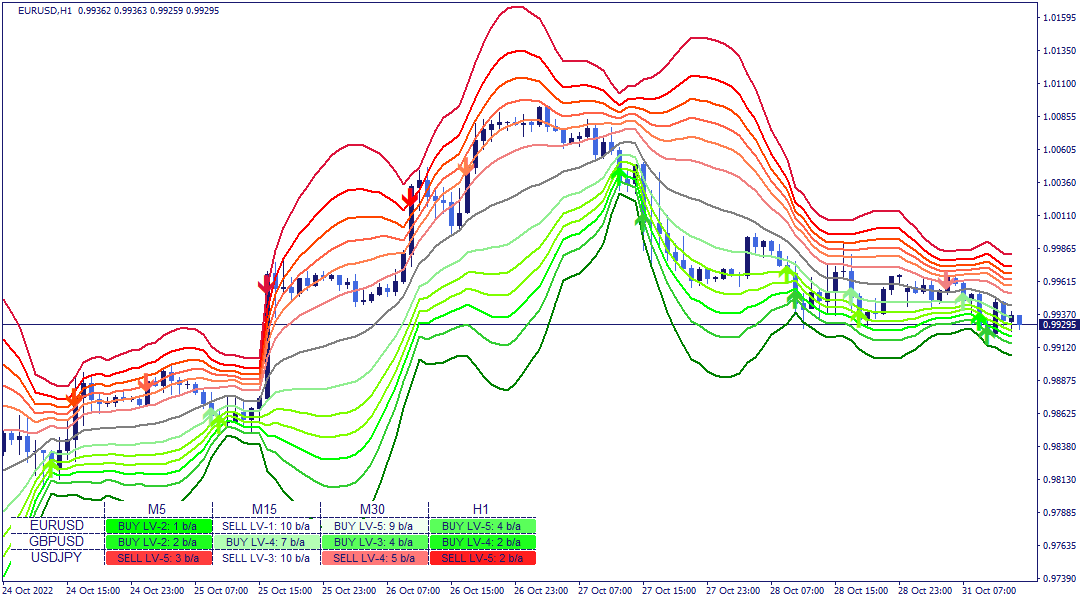
The bands are structured in layers — each successive band level represents a greater deviation from the baseline. The more extreme the band level, the less frequently price reaches it and the stronger the structural significance of the interaction. Band color saturation reflects this: darker colors indicate more extreme levels, lighter colors indicate levels closer to the baseline.
All conditions are evaluated on closed bars. A directional marker appears only when the bar has fully closed beyond or at a band level — partial interactions within an open bar do not register.
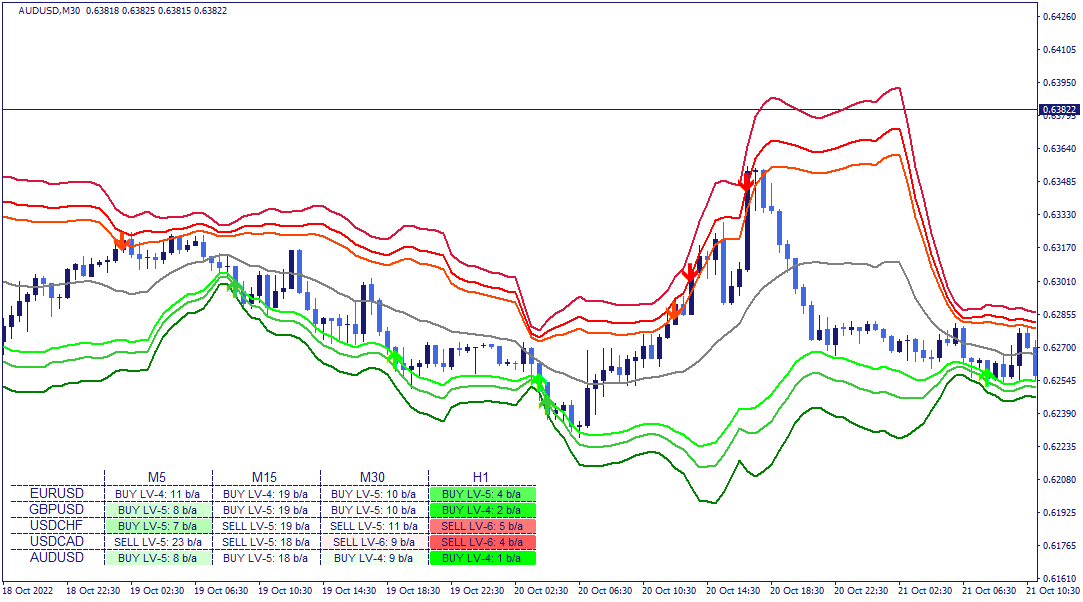
The dashboard displays the current condition status across all monitored assets and timeframes in a single structured view.
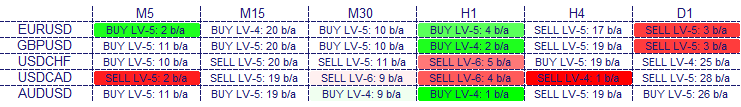
Each cell shows the directional context of the most recently registered condition — bullish or bearish — the band level at which the interaction occurred, and the number of bars back at which it was registered. This combination allows you to assess both the recency and the structural level of the most recent condition for each monitored instrument. Clicking any cell updates the chart to the corresponding asset and timeframe directly.
The indicator has the following parameters:
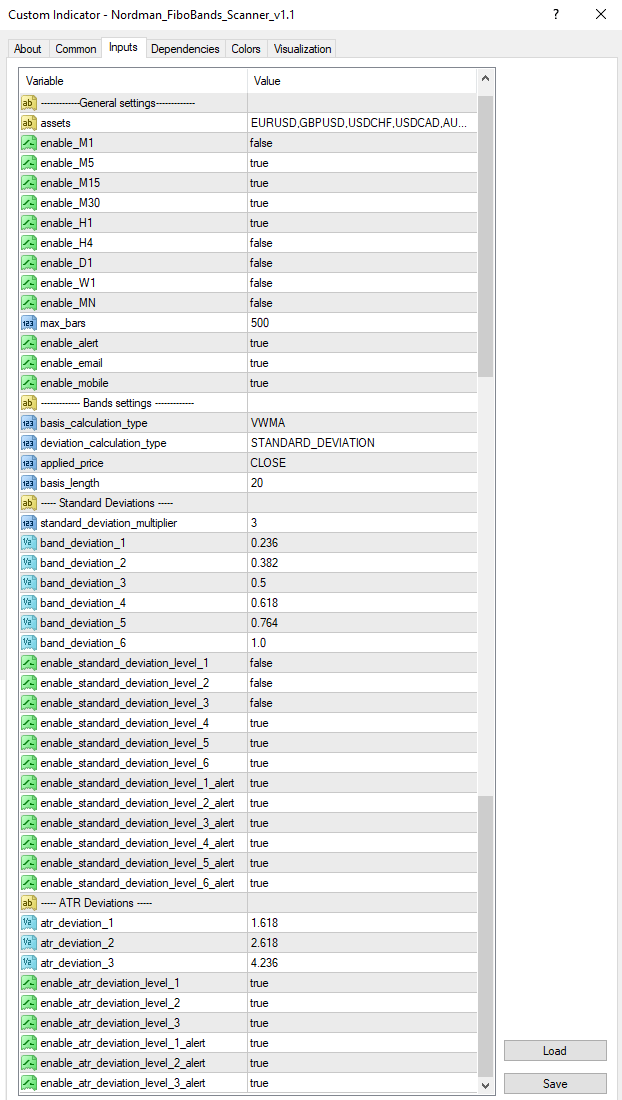
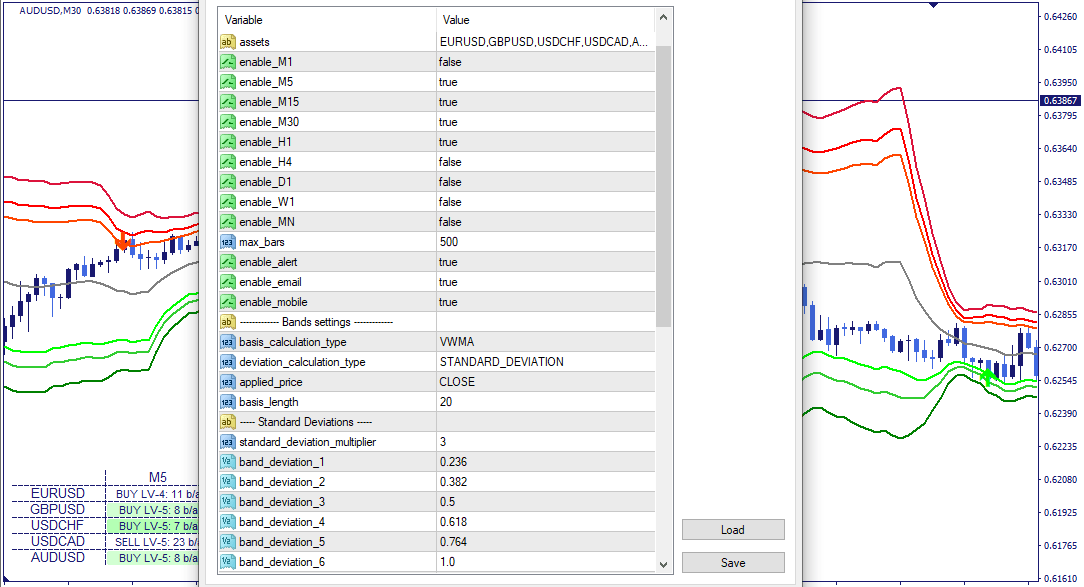
Assets — instruments to include in the scanner.
Enable_M1–MN — include or exclude individual timeframes from the scanner scope.
Max_bars — limits how far back the scanner evaluates conditions. Reducing this value improves calculation speed.
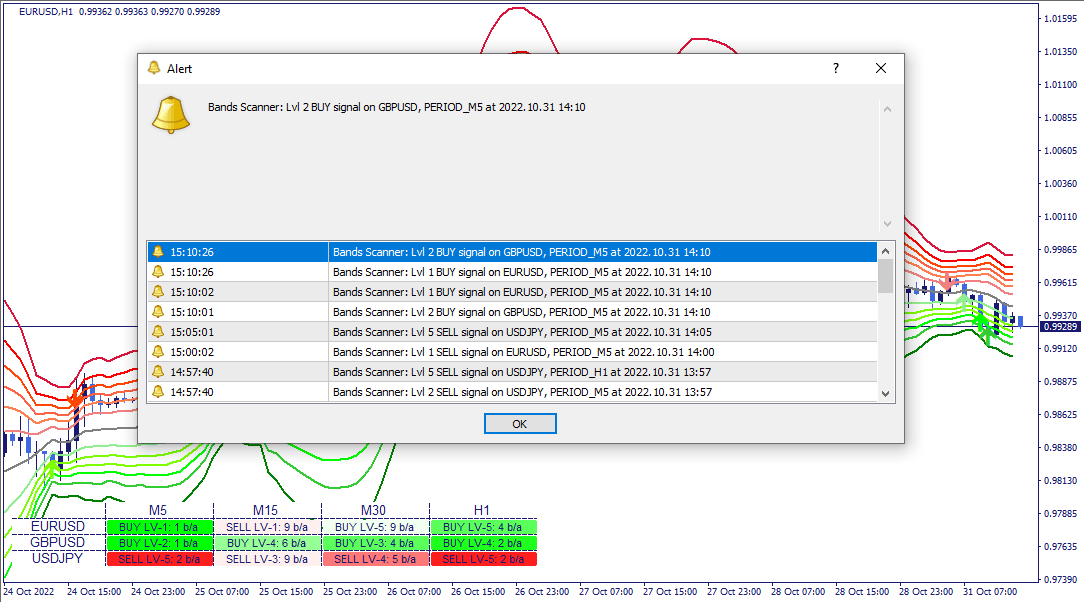
Enable alert / Enable email / Enable mobile — alert delivery: platform notifications, email, or mobile — each configurable independently.
Basis_calculation_type — selects the baseline calculation method: SMA, EMA, or VWMA.
Deviation_calculation_type — selects the band calculation mode: Standard Deviation or ATR Deviation.
Applied_price — price type used for calculations: OPEN, HIGH, LOW, CLOSE, HL2, HLC3, or OHLC4.
Basis_length — number of periods used for baseline and deviation calculations.
Standard_deviation_multiplier — multiplier applied to the standard deviation before Fibonacci ratios are applied.
Band_deviation_1–6 — configurable Fibonacci ratio levels for Standard Deviation mode (default: 0.236, 0.382, 0.5, 0.618, 0.764, 1.0).
Enable_standard_deviation_level_# / Enable_standard_deviation_level_#_alert — enables or disables detection and alerts for each individual Standard Deviation band level.
ATR_deviation_1–3 — configurable Fibonacci ratio levels for ATR Deviation mode (default: 1.618, 2.618, 4.236).
Enable_atr_deviation_level_# / Enable_atr_deviation_level_#_alert — enables or disables detection and alerts for each individual ATR Deviation band level.
Indicator Limitations
The Fibonacci + Bollinger Bands Indicator reflects calculations based on historical price and volatility data. Band levels represent mathematical distances from the baseline derived from Fibonacci ratios — they do not predict where price will reverse or how far it will move after reaching a band. Price can interact with a band and continue moving in the same direction, or reach multiple band levels in sequence. All registered conditions should be evaluated within a broader analytical framework that considers current market structure and context.

We can customize this indicator to your requirements by adding new features, modifying calculation logic, or combining multiple tools into a unified solution.
We also develop automated trading strategies (Expert Advisors) based on custom logic. The system can include configurable management modules such as dynamic risk parameters, multi-stage trailing stops, additional confirmation filters, and other custom functionality based on your specifications.
The final solution is delivered with full source code and post-delivery support. Contact us for a free consultation to discuss the scope and timeline of your project.
We are committed to the ongoing development and refinement of our indicators. If you’ve spotted a bug, feel that something essential is missing, or have ideas that could make the indicator even better, just send us a message. Your feedback helps us improve and deliver tools that truly meet traders’ needs.
Nordman Algorithms is a trade name of Nordman Algorithms OÜ (Reg. No. 14435535), registered in Tallinn, Estonia.
Software Nature & User Responsibility — Nordman Algorithms provides algorithmic software tools for technical analysis. Nordman Algorithms is not a financial advisor and is not liable for any losses. All trades conducted based on the software’s output are executed at the user’s sole discretion and risk.
Visual Markers & Signal Disclosure — This software may display visual markers (such as arrows, dots, or alerts) when predefined mathematical conditions are met. These markers are provided for educational and analytical purposes only, must not be interpreted as financial guidance, and do not constitute a recommendation to buy, sell, or hold any financial instrument. Users must independently validate all visual cues within their own trading methodology.
No Financial Advice — Nordman Algorithms does not provide discretionary trading signals, investment advice, or managed signal services. Our software represents a mathematical visualization of historical and real-time data. The appearance of a visual marker does not guarantee a profitable trade or predict future market behavior.
Trading Risk Warning — Futures, Forex, and options trading involve significant risk. Risk capital is money that can be lost without jeopardizing financial security. Only risk capital should be used for trading. Past performance is not indicative of future results. View Full Risk Disclosure: https://www.nordman-algorithms.com/risk-disclosure/
ESMA Risk Warning — Financial instruments, especially those involving leverage such as CFDs and Forex, are complex and carry a high risk of rapid financial loss. Our software provides analytical outputs and visual markers based on predefined mathematical conditions and does not mitigate or reduce inherent market risks. You should carefully consider whether you understand how leveraged financial instruments work and whether you can afford the high risk of losing your capital.
CFTC Rule 4.41 — Hypothetical or simulated performance results have inherent limitations. Unlike actual performance records, simulated results do not represent real trading. Because trades have not actually been executed, these results may under- or over-compensate for the impact of market factors such as liquidity. No representation is being made that any account will achieve profits or losses similar to those shown.