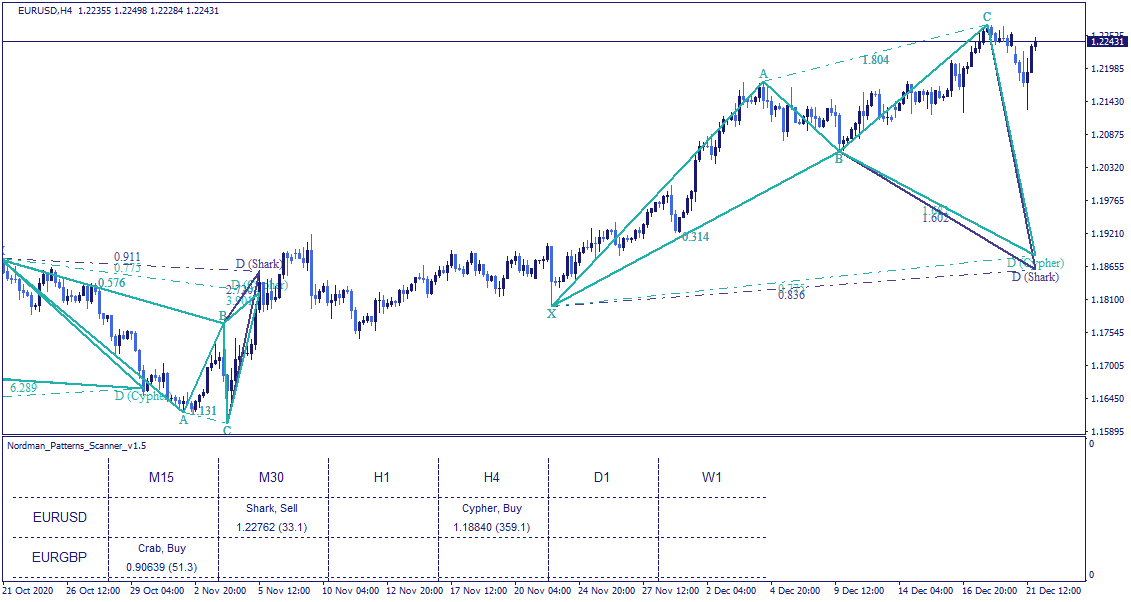
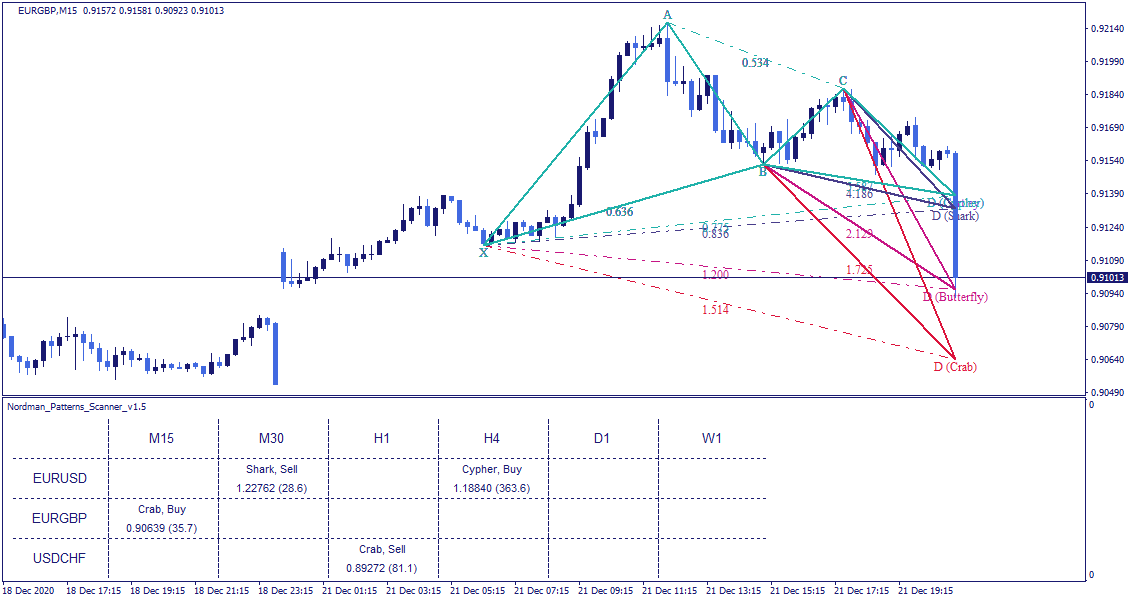
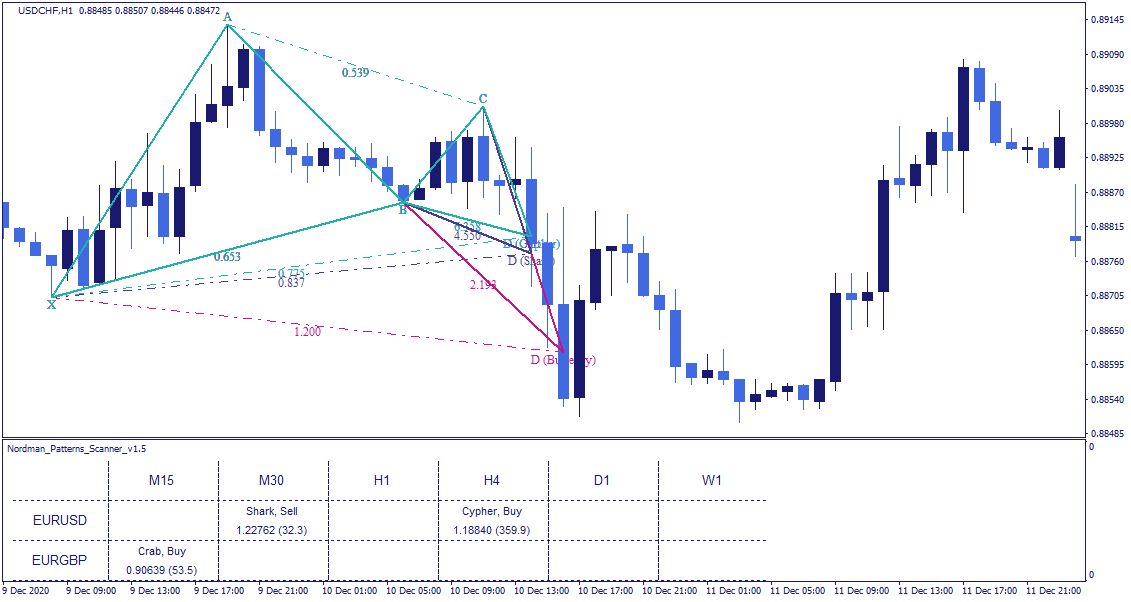
The MT4 Harmonic Patterns Indicator is a multi-currency, multi-timeframe scanner that automatically identifies harmonic patterns across all instruments and timeframes available in the MetaTrader 4 terminal — from M1 to MN — and presents the results in a structured dashboard format.
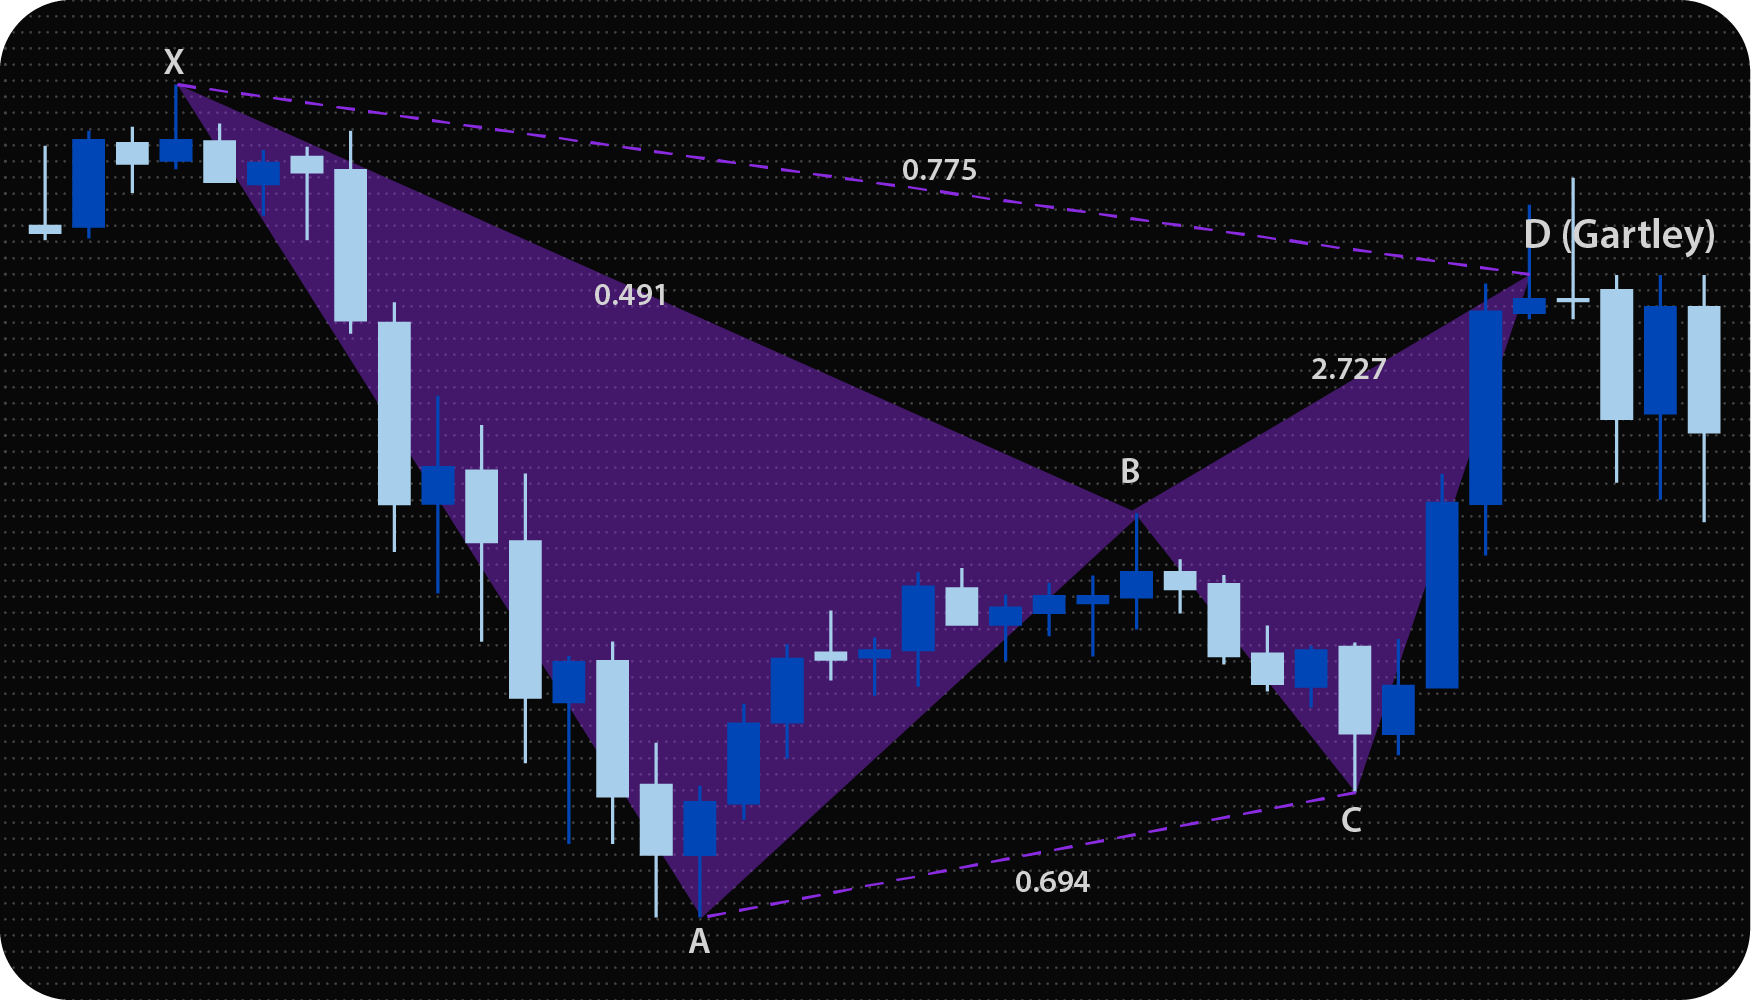
Harmonic patterns are price formations defined by specific Fibonacci retracement and extension ratios between their component points (X, A, B, C, D). The indicator identifies these formations automatically by evaluating whether the measured ratios between price swings fall within the defined parameters for each pattern type. Pattern identification is based entirely on mathematical relationships between price levels — not on subjective interpretation.
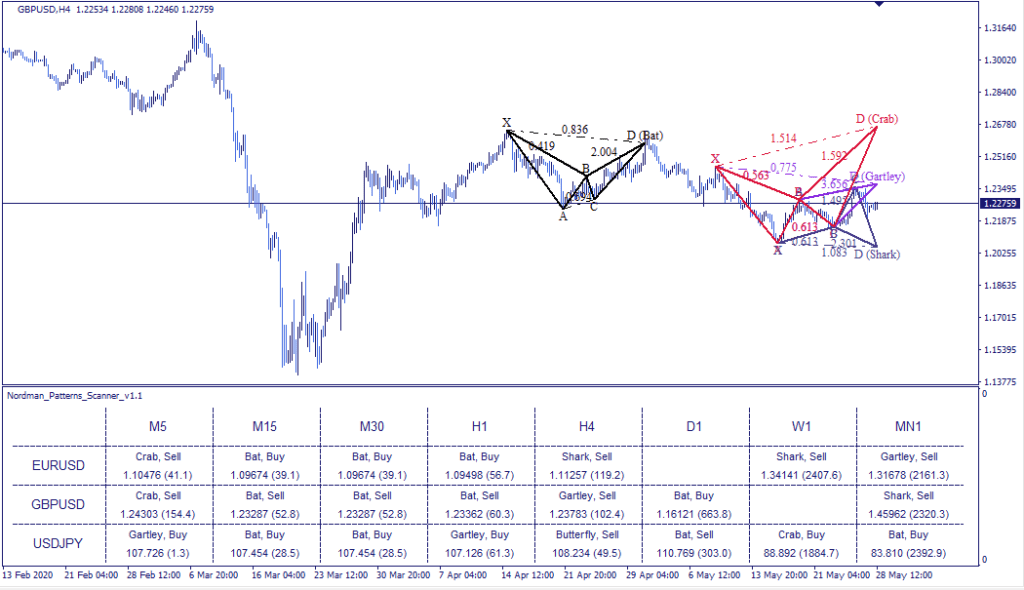
The dashboard displays the results of continuous pattern detection across all monitored instruments and timeframes in a single window. For each detected pattern, the dashboard shows:
Clicking on any row in the dashboard updates the chart to the corresponding instrument and timeframe directly, without opening a new window.
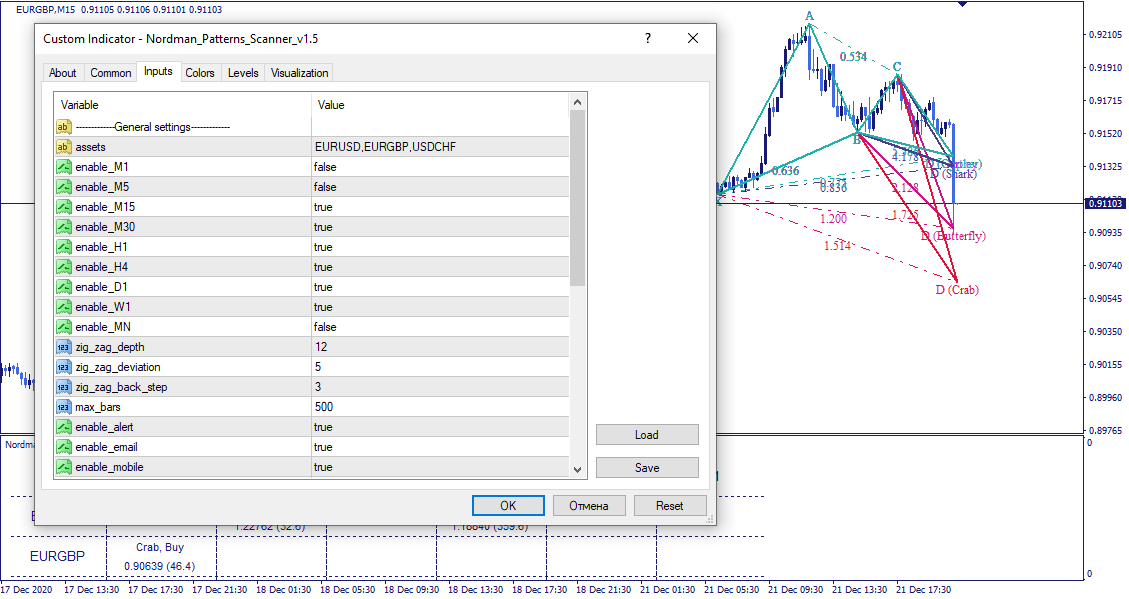
The dashboard also supports configurable alerts — notifications can be delivered as MT4 platform alerts, email messages, or mobile push notifications when a pattern meets the defined detection criteria.
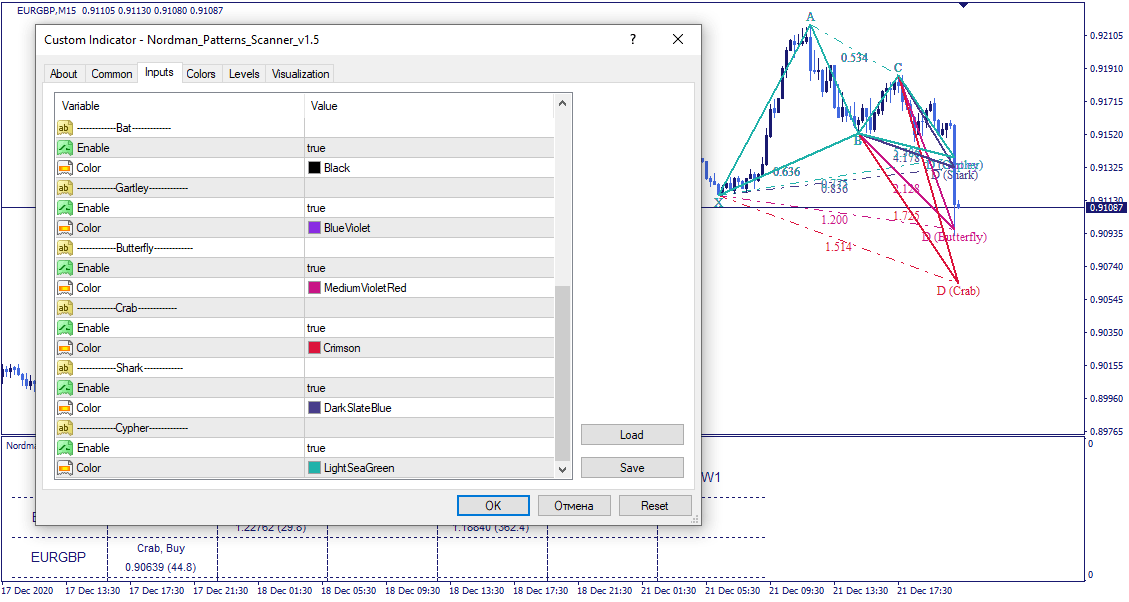
The indicator identifies six harmonic patterns, each with bullish and bearish variants. All patterns are defined by Fibonacci ratios between their structural points:
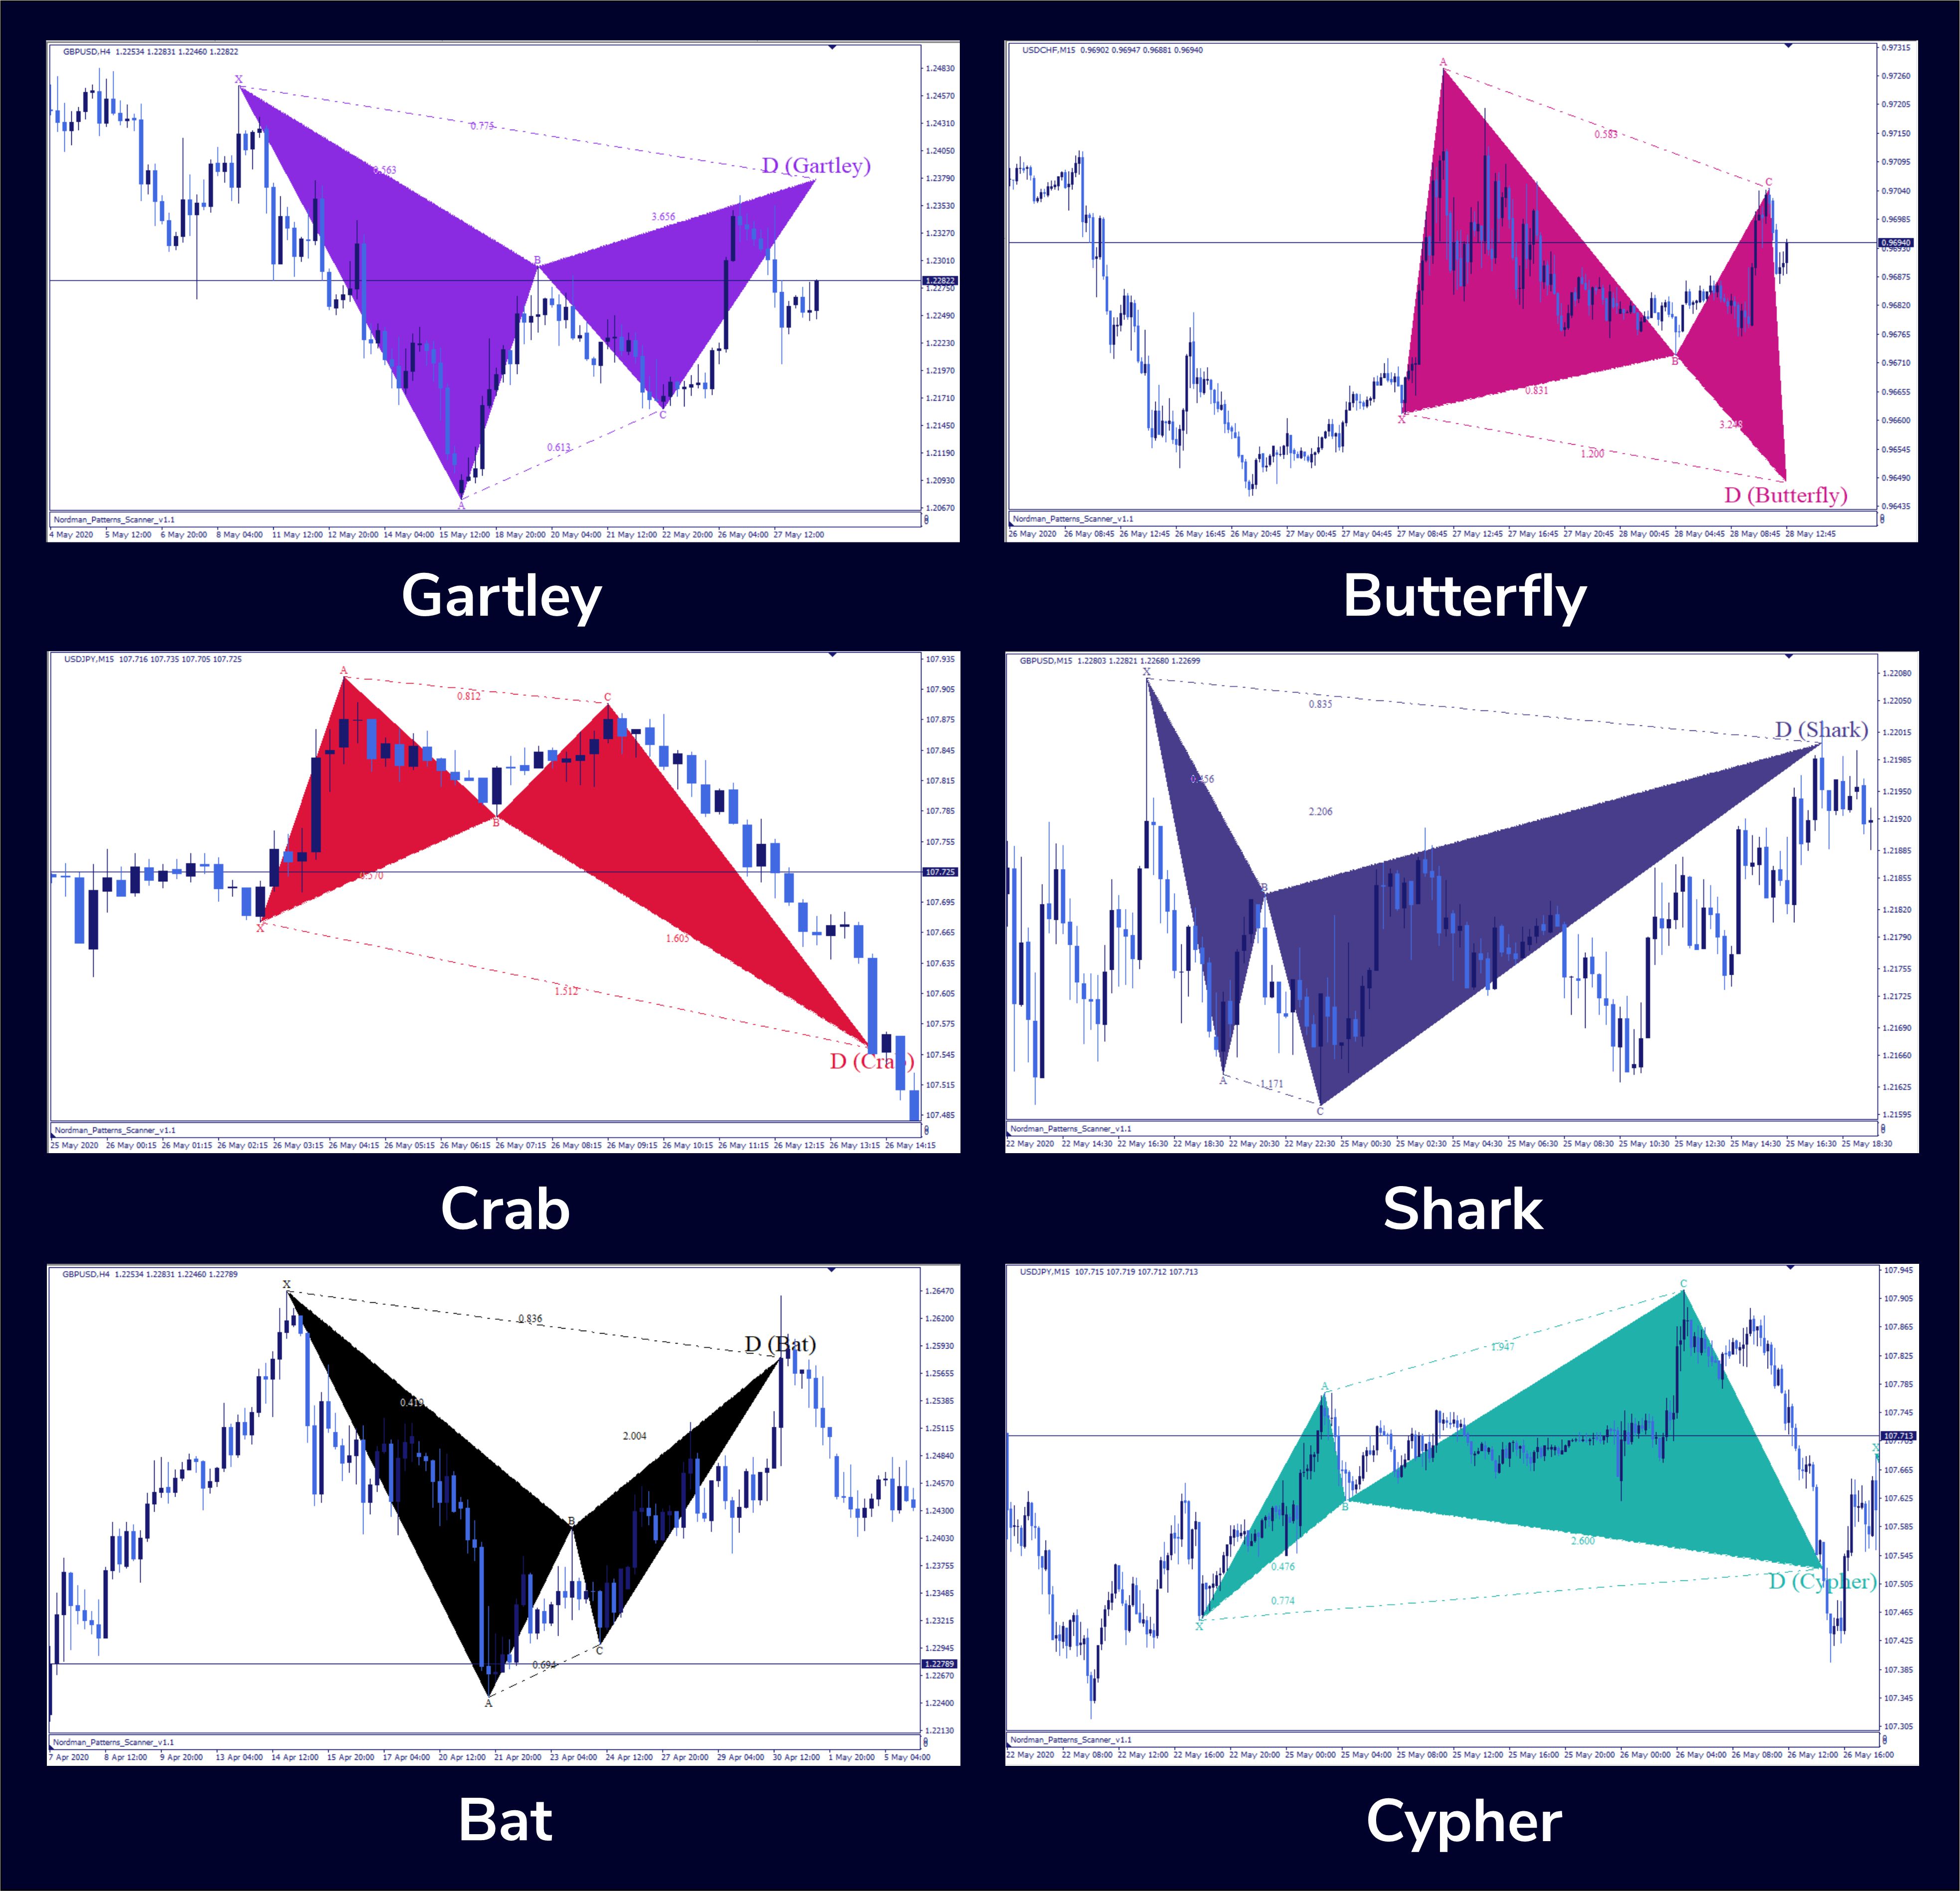
Each pattern is identified by a specific set of Fibonacci retracement and extension ratios between points X, A, B, C, and D. The table below shows the ratio criteria used by the scanner for each pattern:
| Pattern | AB | BC | CD | XD | XC |
| Bat | 0.618 retracement of XA |
0.382-0.886 retracement of AB |
1.128-1.618 extension of BC |
0.786 retracement of XA |
X |
| Gartley | 0.382-0.5 retracement of XA |
0.382-0.886 retracement of AB |
1.618-2.618 extension of BC |
0.886 retracement of XA |
X |
| Butterfly | 0.786 retracement of XA |
0.382-0.886 retracement of AB |
1.618-2.618 extension of BC |
1.272–1.618 extension of XA |
X |
| Crab | 0.382–0.618 retracement of XA |
0.382-0.886 retracement of AB |
2.24–3.618 extension of BC |
1.618 extension of XA |
X |
| Shark | 0.382–0.618 retracement of XA |
1.128-1.618 extension of AB |
1.618–2.236 extension of BC |
0.886-1.128 retracement of XA |
X |
| Cypher | 0.382–0.618 retracement of XA |
X | 0.786 retracement of XA |
X | 1.272-1.414 extension of XA |
The scanner evaluates these ratios continuously as new price data forms. A pattern is registered in the dashboard when the measured price relationships fall within the defined ratio ranges for all required legs.
Indicator Limitations
Harmonic pattern detection is based on Fibonacci ratio calculations applied to historical price swing data. The indicator identifies formations that match defined mathematical criteria — it does not predict future price movement or guarantee that a detected pattern will develop in any particular direction. Point D represents a structural reference level based on the calculated ratios, not a forecast of where price will go. All detected patterns should be evaluated within a broader analytical framework that considers overall market structure and current conditions.

We can customize this indicator to your requirements by adding new features, modifying calculation logic, or combining multiple tools into a unified solution.
We also develop automated trading strategies (Expert Advisors) based on custom logic. The system can include configurable management modules such as dynamic risk parameters, multi-stage trailing stops, additional confirmation filters, and other custom functionality based on your specifications.
The final solution is delivered with full source code and post-delivery support. Contact us for a free consultation to discuss the scope and timeline of your project.
We are committed to the ongoing development and refinement of our indicators. If you’ve spotted a bug, feel that something essential is missing, or have ideas that could make the indicator even better, just send us a message. Your feedback helps us improve and deliver tools that truly meet traders’ needs.
Nordman Algorithms is a trade name of Nordman Algorithms OÜ (Reg. No. 14435535), registered in Tallinn, Estonia.
Software Nature & User Responsibility — Nordman Algorithms provides algorithmic software tools for technical analysis. Nordman Algorithms is not a financial advisor and is not liable for any losses. All trades conducted based on the software’s output are executed at the user’s sole discretion and risk.
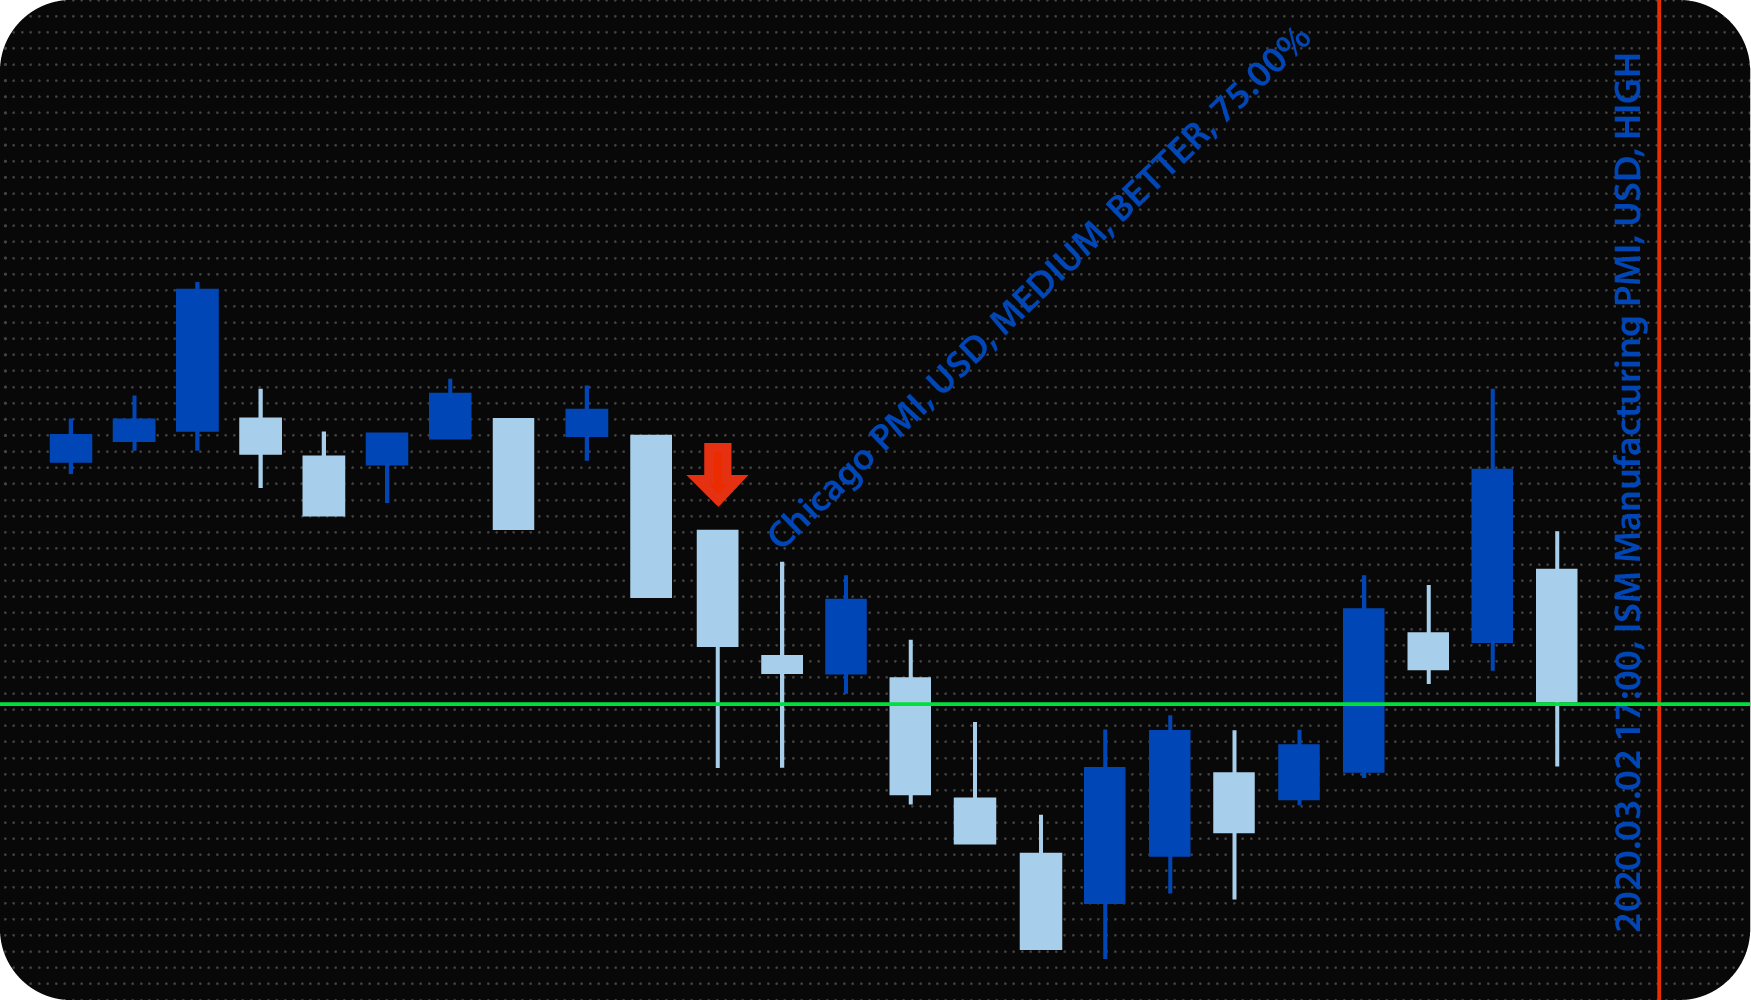
Visual Markers & Signal Disclosure — This software may display visual markers (such as arrows, dots, or alerts) when predefined mathematical conditions are met. These markers are provided for educational and analytical purposes only, must not be interpreted as financial guidance, and do not constitute a recommendation to buy, sell, or hold any financial instrument. Users must independently validate all visual cues within their own trading methodology.
No Financial Advice — Nordman Algorithms does not provide discretionary trading signals, investment advice, or managed signal services. Our software represents a mathematical visualization of historical and real-time data. The appearance of a visual marker does not guarantee a profitable trade or predict future market behavior.
Trading Risk Warning — Futures, Forex, and options trading involve significant risk. Risk capital is money that can be lost without jeopardizing financial security. Only risk capital should be used for trading. Past performance is not indicative of future results. View Full Risk Disclosure: https://www.nordman-algorithms.com/risk-disclosure/
ESMA Risk Warning — Financial instruments, especially those involving leverage such as CFDs and Forex, are complex and carry a high risk of rapid financial loss. Our software provides analytical outputs and visual markers based on predefined mathematical conditions and does not mitigate or reduce inherent market risks. You should carefully consider whether you understand how leveraged financial instruments work and whether you can afford the high risk of losing your capital.
CFTC Rule 4.41 — Hypothetical or simulated performance results have inherent limitations. Unlike actual performance records, simulated results do not represent real trading. Because trades have not actually been executed, these results may under- or over-compensate for the impact of market factors such as liquidity. No representation is being made that any account will achieve profits or losses similar to those shown.