 MT4 to NinjaTrader 8: Running an MQL4 EA on a Futures AccountRead article →
Is There a Right Way to Trade Order Blocks? We Tested 10,986 Touches
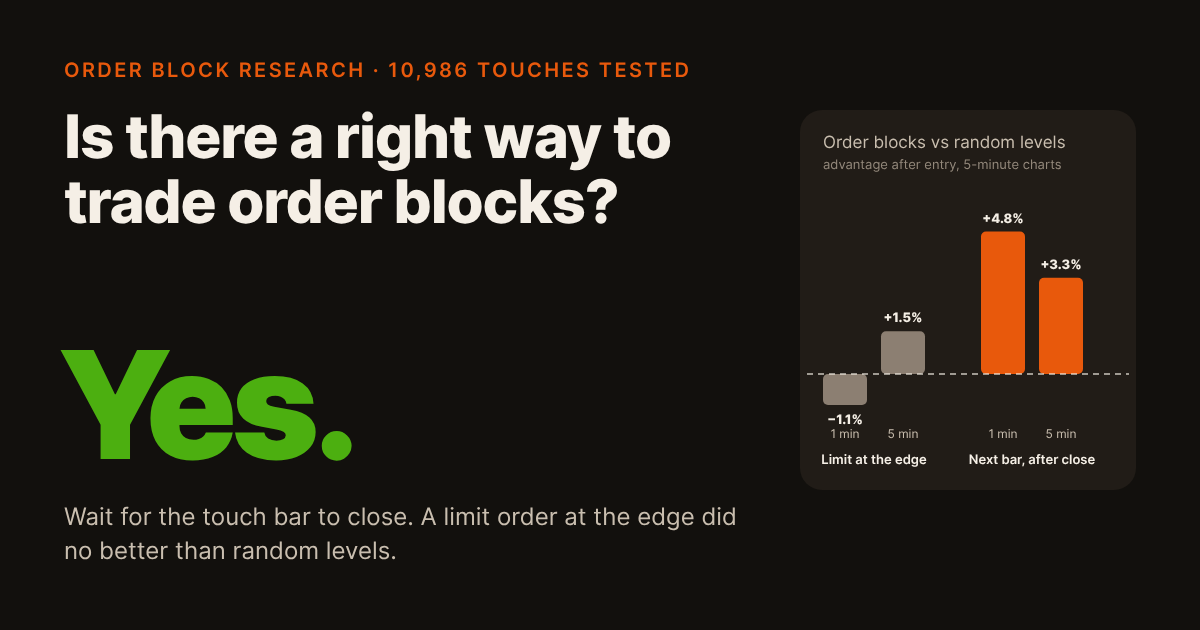
Most traders who use order blocks set a limit order at the zone’s edge and wait for price to come back. We wanted to know whether that works, and if not, whether there is a better way. So we tracked 10,986 returns to order blocks across four futures markets and three years, tried two ways of entering, and compared every order block with ten random zones of the same size and distance, traded exactly the same way.
The short answer: yes, wait for the touch bar to close. With a limit order at the edge, order blocks on 5-minute charts did no better than random levels. Entered on the next bar after the touch bar closes, they beat random levels for the first 1 to 5 minutes, on almost any indicator settings and in all four markets.
10,986
returns to order blocks
109,975
returns to random zones, for comparison
about 5%
better than random, entering after the touch bar closes
99%
of 192 indicator settings beat random levels
36
months of ES, NQ, 6E and 6A
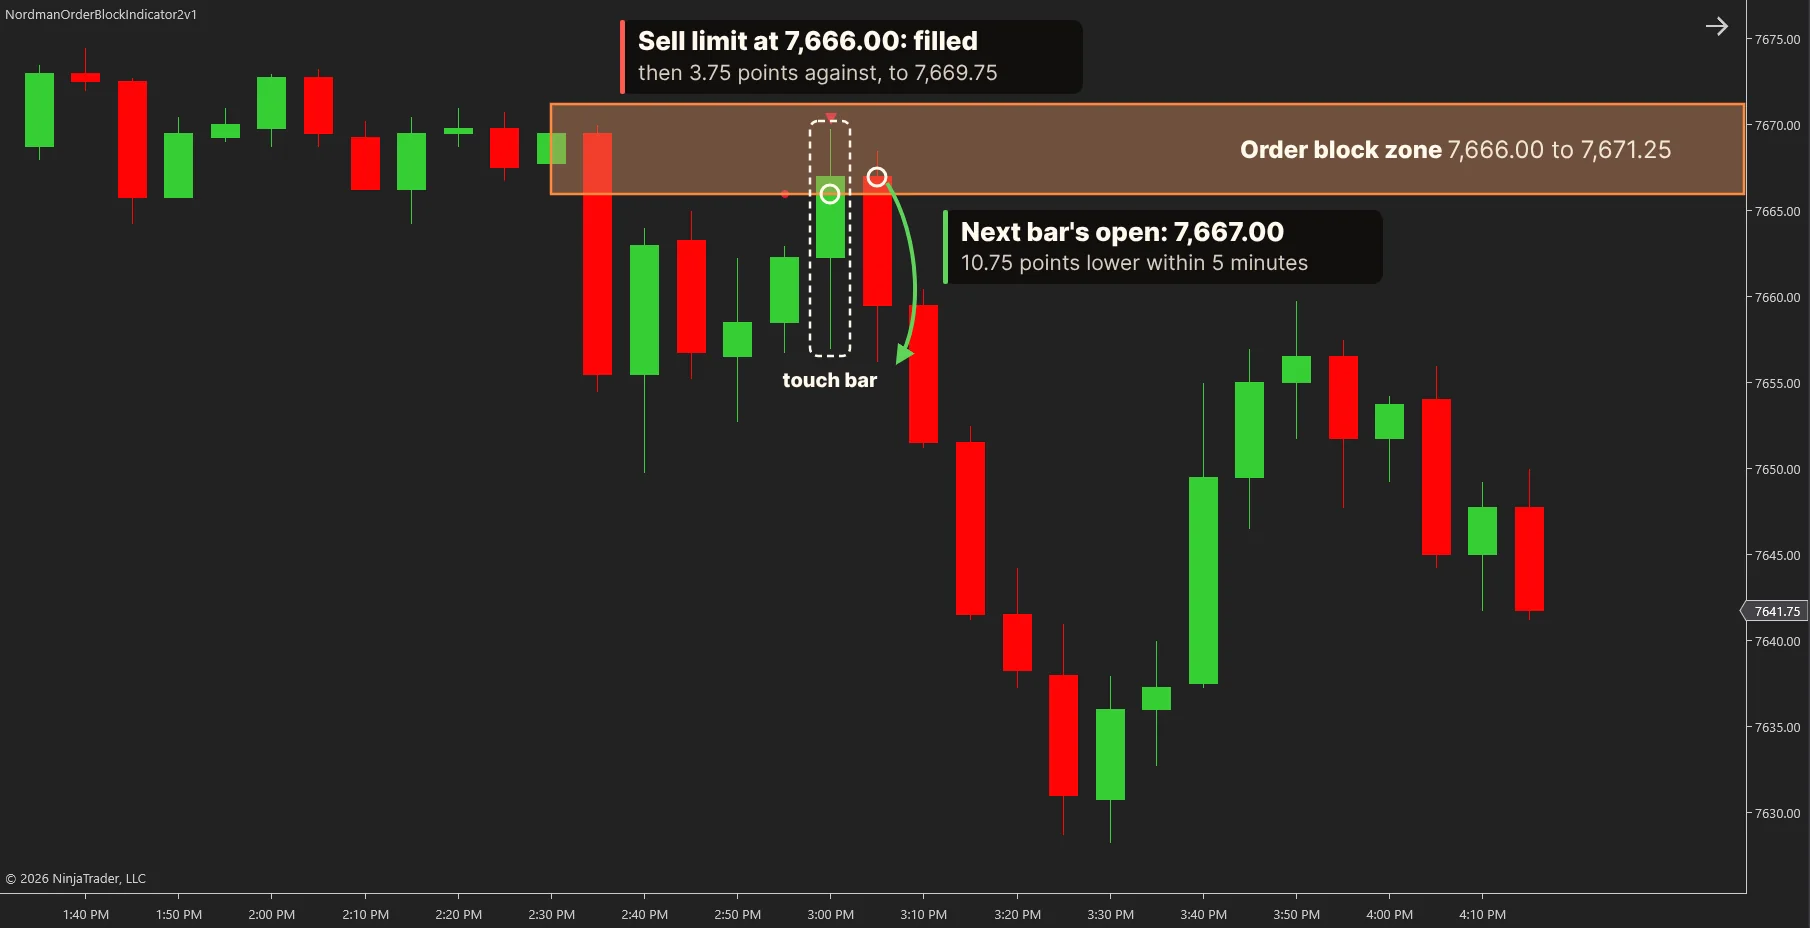
Here is what that looks like on a real chart. The touch bar pushed through most of the zone before price turned: a resting limit order caught the push, an entry after the bar closed caught the turn.
What is an order block?
An order block is the last opposite candle before a strong move: a candle that sweeps the previous candle’s extreme, followed by a move the other way that leaves a fair value gap. In the Nordman Order Block indicator, a bullish order block is three candles:
- A down candle dips below the previous candle’s low. This down candle is the order block.
- The next candle closes up, and its range reaches across the gap described in step 3.
- The candle after that stays entirely above the order block’s high, leaving a gap of at least 0.10 ATR between them.
The zone is the order-block candle’s full range, from its low to its high. Price comes back to it from above, so the near edge is the high. A bearish order block is the mirror image: an up candle that pokes above the previous candle’s high, a down candle next, then a candle that stays entirely below the order block’s low. ATR is the market’s normal bar size: the average range of the last 14 bars on the same chart.
Those three candles are a fair value gap, and the order block is its first candle. Price coming back from above has to cross the whole gap before it touches the order block. So this study tests the next level down from our fair value gap study, on the same moves.
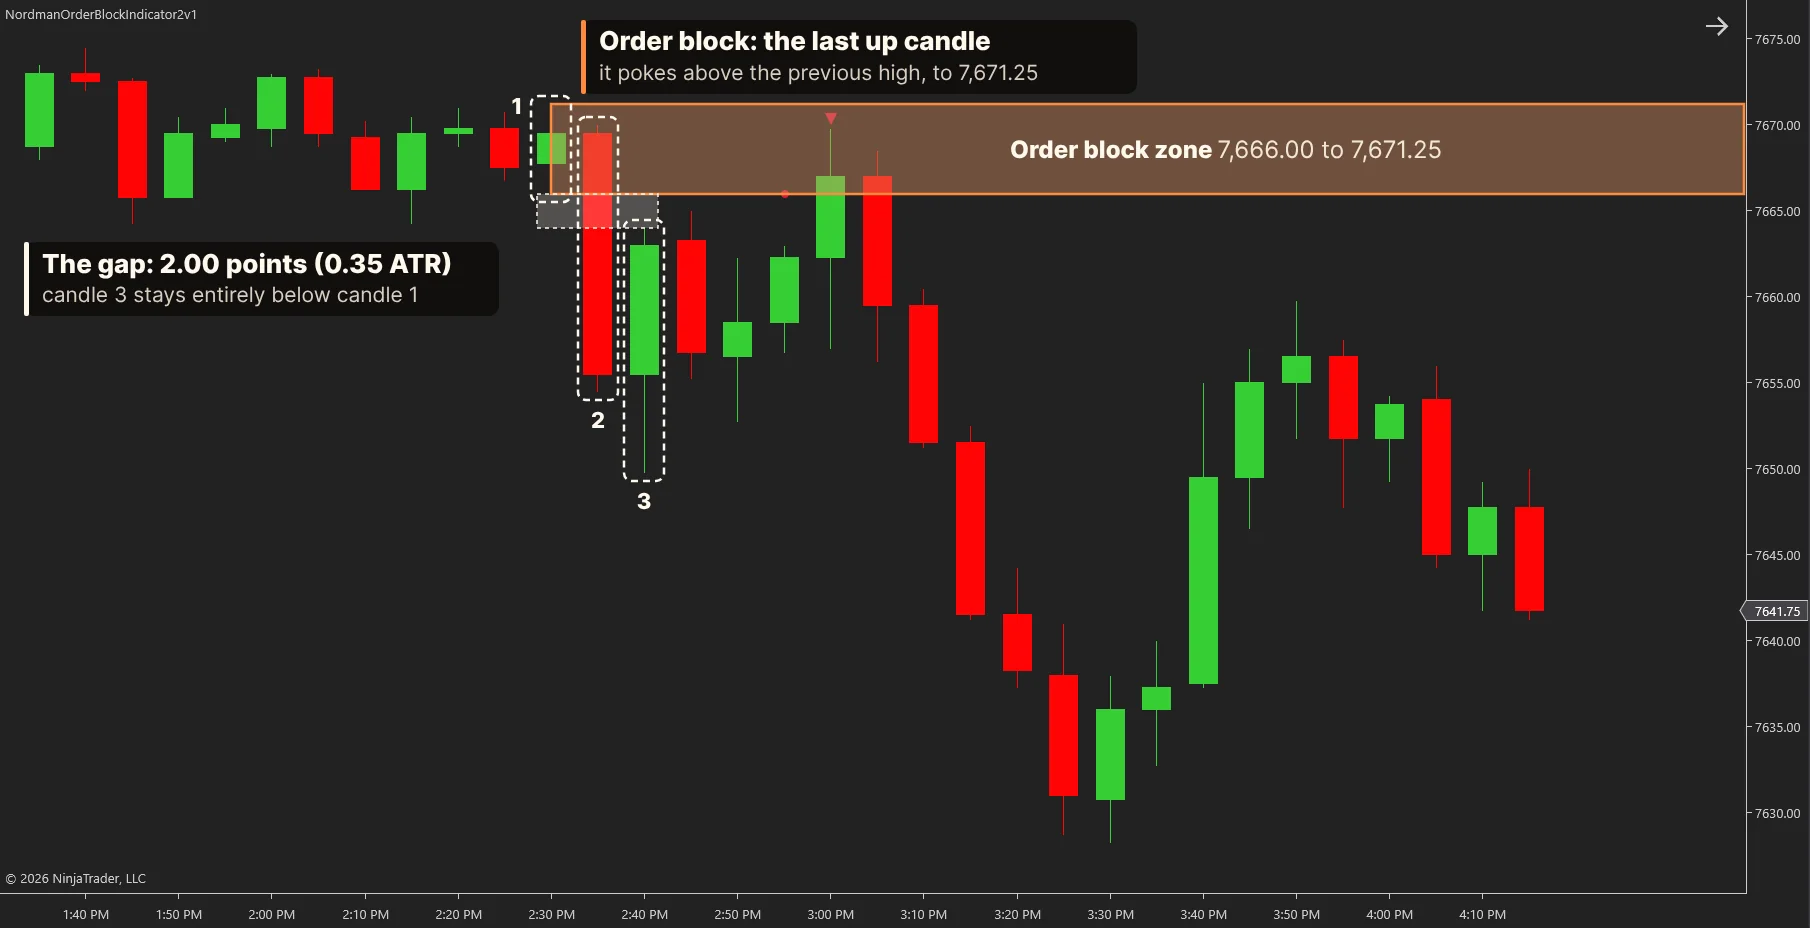
Every order block is the first candle of a fair value gap. The edge showed up only when the entry waited for the touch bar to close.
How we tested it
We used the same test as the fair value gap study, so the two sit side by side. Every order block the indicator showed on its default settings, on 5-minute charts of the E-mini S&P 500 (ES), E-mini Nasdaq-100 (NQ), Euro FX (6E) and Australian dollar (6A) futures from October 2023 to September 2026, was scored on its first touch: 14,916 order blocks, 10,986 of them touched.
To find out whether the order block itself adds anything, every one got ten fake twins: zones of the same size and the same distance from price, placed at a random bar in the same hour of the day and the same month. If order blocks are special, they should beat their fakes.
This time we tried two entries, because a trader uses whichever works: a limit order resting at the zone’s edge, and an entry at the next bar’s open after the touch bar closes. Each zone is compared with random zones traded the same way.
We didn’t use a stop or a target, because those choices alone can turn almost any entry into a winner or a loser. Instead, after every entry we measured two things:
- MFE, the maximum favourable excursion: how far price went in your favour.
- MAE, the maximum adverse excursion: how far price went against you.
We measured both 1 minute, 5 minutes, 15 minutes, 1 hour and 1 day after entry, on 1-minute data, in ATR, so the S&P and the euro can be compared fairly. The whole window counts, including what happens after the best price. Then we combined them into one number:
edge ratio = average MFE ÷ average MAE
An edge ratio of 1.0 is a coin toss: price went as far against you as for you. Random levels are not a coin toss, though: in the first minute they often score close to or above 1.0, because almost any level looks like support right after price pushes into it. That is why we never judge a zone against 1.0, only against random zones traded the same way.
What “X% better” means
It compares the two edge ratios. Here is the worked example, order blocks with the next-bar entry, 1 minute after entry:
| Average MFE | Average MAE | Edge ratio | |
|---|---|---|---|
| Real order blocks (10,986 touches) | 0.247 ATR | 0.242 ATR | 1.018 |
| Random zones (109,975 touches) | 0.255 ATR | 0.262 ATR | 0.971 |
1.018 ÷ 0.971 = 1.048, so order blocks were 4.8% better. In plain words: for each unit price moved against you, it moved 4.8% further in your favour than at a random level. It is not a profit figure: it says how much better the reward-to-risk was, not how much money a trade made. Costs decide whether it pays, and we come back to them below.
How this differs from other order block tests
Most order block pages explain the pattern and say to wait for confirmation, with no data. One open-source TradingView script does compare order blocks with random levels; it counts how often price reaches a target before a stop, and finds no reliable edge. We measured something different: how far price moved for and against you after the entry, so the answer doesn’t depend on where a stop or target sits. And we tested two entries, every main indicator setting, four futures markets and the cost of trading.
The right way: each zone needs its own entry
Yes: wait for the touch bar to close
On 5-minute charts, swap the entries and both zones fail: order blocks don’t work with a limit order, and fair value gaps don’t work with a next-bar entry. Here is the advantage over random levels traded the same way, at 1 and 5 minutes, on the same data:
| At 1 / 5 minutes | Limit order at the edge | Next bar after the touch bar closes |
|---|---|---|
| Fair value gap | +3.3% / +3.7% | −0.8% / +0.7% |
| Order block | −1.1% / +1.5% | +4.8% / +3.3% |
Same 5-minute charts, same markets and months, October 2023 to September 2026. Gaps come from our fair value gap indicator on its defaults.
- Each with its own entry, the two are about equally strong in the first minutes. At 1 and 5 minutes the difference between them is well within chance. At 15 minutes only the gaps still hold (+2.7%).
- With the same next-bar entry, order blocks beat gaps at 1 minute in 99.7% of 1,000 redraws of trading days.
- It is broad, not one lucky setting. Across the 192 settings we tried on 5-minute charts, 99% beat random levels at 1 minute. When we ran the same test on random zones posing as order blocks, only 42% did.
- It held in every market and every year. At 1 minute: NQ +9.8%, ES +4.8%, 6E +2.6%, 6A +0.6%; each study year between +3.0% and +6.0%.
This is the most solid result in the study. Try it yourself: change any of the indicator’s four main settings and see how the order-block edge responds.
128 settings on 5-minute charts, each measured on its own; nothing is estimated. Range type Body also stands for Open-High-Low, which gave identical results. Starts on the indicator’s defaults.
Most combinations beat random levels at 1 minute; a 20-bar duration and a 0.25 ATR minimum gap do best, and a 0.50 ATR minimum gap is the weakest by 5 minutes. On average, range type makes little difference: a body-based zone did better at 1 minute in 7 of 10 combinations, typically by about 1 point, and by 5 minutes the two are even. Single settings can differ much more in either direction, mostly where few order blocks were touched: at 0.50 ATR, 9 bars and a 20-bar duration, full candle shows +11% and body +6%, but on only about 1,500 touches. So pick a range type from the overall pattern, not from one setting.
Does price always come back to an order block?
No
Price came back to 73.7% of order blocks within their 46-bar life, and to 73.7% of random zones the same distance away. Order blocks are not magnets, just as gaps weren’t in the fair value gap study (73.0% against 72.9%).
Zones whose whole 46-bar window lies inside the data, default settings, 5-minute charts. Hover a line for the share at each point.
Is an order block support or resistance?
Partly: briefly, once the touch bar has closed
A limit order at the edge showed no reliable advantage over random levels at any point, from 1 minute to 1 day. Requiring price to trade 1 tick through the order, as in the fair value gap study, only makes it worse: 66% to 96% of orders fill, and every market loses money even before costs. Entered after the touch bar closes, order blocks did about 5% better than random levels at 1 minute and about 3% better at 5 minutes, then the advantage fades by 15 minutes.
Order blocks on 5-minute charts, 10,986 touches against 109,975 random ones. Hover a point for the edge ratios.
On 15-minute charts the next-bar entry doesn’t work (−4.3% across settings at 1 minute), so the result belongs to 5-minute charts.
Are order blocks after bigger moves stronger?
No
With a limit order, the two smaller quarters of gap size reacted (+8.9% and +9.7% at 1 minute) and the two bigger quarters didn’t (−19.9% and +0.9%). With the next-bar entry, a moderate 0.25 ATR minimum gap did best and the largest, 0.50 ATR, did worst, so bigger still doesn’t mean better.
Each quarter holds about 2,700 real touches, each against random zones of the same gap-size range.
Treat this as a pattern, not a proven rule: each quarter holds about 2,700 touches, and 1-minute numbers swing widely.
How long does an order block stay useful?
Not long: fresh ones work best
With the next-bar entry on 5-minute charts, order blocks that live 20 bars beat random levels by +7.5% at 1 minute; with 50 bars +4.9%, with 100 bars +4.8%, and with no limit +4.0%. Every lifetime works for the first 5 minutes; fresher works better.
These are typical values across the 48 settings with each lifetime.
Does an order block make a fair value gap stronger?
No, the opposite
Fair value gaps without an order block behind them beat random levels at 5 and 15 minutes (+4.0% and +3.4%), like all gaps in the fair value gap study. Gaps with an order block behind them didn’t (+2.3% and −0.9%). When a gap has an order block behind it, the gap’s limit entry loses its edge; switch to the order-block entry.
Fair value gaps from our fair value gap indicator on the same data, 5-minute charts.
Treat this as a pattern: we didn’t test the difference between the two groups directly.
Can you trade order blocks on their own?
No: use it for timing
It is a timing edge, not a system. A next-bar entry is a market order, so it pays commission ($4.50 round trip) and a tick of slippage each way. After those costs, order blocks lost $24 per trade in ES, $17 in 6E and $15 in 6A at 5 minutes; NQ roughly broke even (+$0.82). Before costs, real order blocks beat random levels in ES and NQ (NQ about +3 ticks per trade at 5 minutes) but not in the currencies.
Tick values: ES $12.50, NQ $5.00, 6E $6.25, 6A $5.00. Your costs may differ.
| Market | Order block, before costs | Random zone, before costs | Cost per trade | Order block, after costs |
|---|---|---|---|---|
| ES | +0.41 ticks (+$5.12) | +0.12 ticks (+$1.52) | $29.50 | −$24.38 |
| NQ | +3.06 ticks (+$15.32) | −0.02 ticks (−$0.10) | $14.50 | +$0.82 |
| 6E | +0.01 ticks (+$0.04) | +0.04 ticks (+$0.22) | $17.00 | −$16.96 |
| 6A | −0.05 ticks (−$0.24) | +0.03 ticks (+$0.15) | $14.50 | −$14.74 |
The scorecard
| Question | What we found | Verdict |
|---|---|---|
| Is there a right way to trade order blocks? | Yes: wait for the touch bar to close, then enter | Yes |
| Does price always come back to an order block? | No more often than to a random level | No |
| Is an order block support or resistance? | Briefly, and only after the touch bar closes | Partly |
| Are order blocks after bigger moves stronger? | No: the bigger gaps did worse, not better | No |
| How long does an order block stay useful? | Not long: fresh ones work best | Partly |
| Does an order block make a fair value gap stronger? | The opposite: the gap loses its edge | No |
| Can you trade order blocks on their own? | Costs eat the edge; use it for timing | No |
How to trade order blocks: a checklist
Treat the order block as a timing tool, and the fair value gap as a zone for a resting order.
- Test it on your own timeframe first. We tested 5- and 15-minute charts; the edge showed up on 5-minute charts, not on 15-minute ones.
- Prefer fresh order blocks. A 20-bar duration did best; with no limit the edge was weakest.
- Don’t rest a limit order at the edge. Price tends to push into the order block before it turns.
- Wait for the touch bar to close, then enter at the next bar’s open.
- Think in minutes, not hours. The advantage is strongest in the first minute and gone by 15 minutes.
- Use it to time trades you already want to take. On its own, commission and slippage eat the edge.
Try it on your own charts. Every order block in this study came from the Nordman Order Block indicator for NinjaTrader 8 on its default settings. Load it on a 5-minute chart, watch what price does around the touch bar, and try a 20-bar duration, which did best in our tests.
See the Order Block Indicator →FAQ
Do order blocks work?
On 5-minute charts, not with a limit order at the edge, the way most traders use them. With an entry after the touch bar closes, yes: across 10,986 touches in ES, NQ, 6E and 6A futures, order blocks did about 5% better than random zones of the same size and distance 1 minute after entry, and about 3% better at 5 minutes.
Are order blocks better than fair value gaps?
Neither is better; each works with its own entry. With their own entries they are about equally strong in the first minutes, and gaps hold longer (to 15 minutes).
Why wait for the touch bar to close?
Price tends to push into the order block before it reacts. A resting limit order catches the push; an entry after the touch bar closes catches the reaction. This explanation fits the numbers, but we did not test it separately.
Do order blocks work on 15-minute charts?
Not with the next-bar entry. A limit order at the edge beat random levels on most 15-minute settings, but the default setting was among the weakest, the edge shrank year by year and it lost money after costs, so we treat it only as a lead for a later study.
Can I trade order blocks on their own?
No. The edge is real but too small to cover a market order’s commission and slippage. Use it to time entries you already have a reason to take.
Which order block settings work best?
The indicator’s defaults work. The result holds on almost any settings on 5-minute charts; fresher order blocks (a 20-bar lifetime) did best.
What about time of day?
Deliberately left out: every random zone sat in the same hour as its order block. Whether these setups work better at certain times of the day is a question for a future study.
What is the edge ratio?
The average maximum favourable excursion (MFE) divided by the average maximum adverse excursion (MAE), over every touch, in ATR units. 1.0 means price went as far against the trade as for it. We compare each zone with random zones traded the same way, because random levels rarely sit exactly at 1.0.
How the study was done
Data. E-mini S&P 500 (ES), E-mini Nasdaq-100 (NQ), Euro FX (6E) and Australian dollar (6A) futures from Kinetick, back-adjusted continuous contracts, full electronic session, times in UTC, 1 October 2023 to 30 September 2026. Touched order blocks per market: ES 2,486, NQ 2,986, 6E 2,757, 6A 2,757.
Order blocks. Nordman Order Block indicator 2.1 for NinjaTrader 8 on its defaults: 5-minute charts, minimum gap 0.10 × ATR(14), Min length 5, Duration 50 bars, full-candle zone. Rebuilt in Python and checked to match NinjaTrader on every order block (21,025 across 5- and 15-minute charts).
Entries and measurement. Two entries on the first touch: a limit order at the near edge, filled on 1-minute data when price reaches it, and a market entry at the open of the bar after the touch bar. From the entry: MFE and MAE in ATR(14) of the bar before entry, at 1, 5, 15 and 60 minutes and 1 day. Edge ratio: average MFE divided by average MAE, over all touches.
Random zones. Ten per order block, with the same size and distance from price in ATR, placed at a random bar in the same New York hour and month, given the same life, entries and measurement: 109,975 random touches in total.
Plan and checks. We wrote the plan down on 9 November 2026, before computing any outcome. Its main test, the limit order at the edge, did not beat random levels by our standard at any checkpoint (edge ratios, order blocks against random: 1 minute 1.032 against 1.042; 5 minutes 0.961 against 0.947; 15 minutes 0.989 against 0.988; 1 hour 0.988 against 1.004; 1 day 1.004 against 1.001). Order blocks counted as better only if they beat random zones on all markets combined, in at least 3 of 4 markets, in more than half of the months, and in at least 95% of 1,000 redraws of trading days. The next-bar entry was one of the plan’s eight extra runs; we then checked it by market, year and direction, on 15-minute charts, against fair value gaps, and across 384 settings, each also run with random zones posing as order blocks. An independent rebuild from raw data matched every number.
Costs. $4.50 round trip plus one tick of slippage per market order (entry and exit for the next-bar entry; exit only for limit orders). Limit-order results were also checked with the fair value gap study’s two fill rules: filled when price touches the level, and filled only when price trades 1 tick through it. The settings grid and costs were explored after the main test on the same data, so they are leanings, not proof.
About this article
Research and text by Alexei Kuntysh, founder of Nordman Algorithms, a team that builds indicators, strategies and trade copiers for NinjaTrader, MetaTrader, cTrader and TradingView. Alexei has built trading software since 2008. Order blocks were generated with the Nordman Order Block indicator and measured with our own analysis code on historical data.
Sources referenced in this article:
- Historical futures data (ES, NQ, 6E, 6A; 1-minute, 5-minute and 15-minute bars, October 2023 to September 2026): Kinetick, kinetick.com
- Order blocks: Nordman Order Block indicator for NinjaTrader 8, default settings: nordman-algorithms.com
- Charting platform: NinjaTrader 8, ninjatrader.com
- Study 2: Do Fair Value Gaps Work? We Tested 38,114 Returns to FVGs
- Study 1: ICT Displacement and the Market Structure Shift: We Tested 15,817 Signals
- Full method: “How the study was done” above.
Nordman Algorithms provides software infrastructure for trade automation and does not offer financial advice, trading signals, or managed trading services. The results in this study are hypothetical: they are calculated from historical market data by fixed rules, the cost figures are assumptions, and they don’t represent actual trading or guarantee future results. Order blocks do not constitute a recommendation to buy, sell, or hold any instrument. This article is for informational and educational purposes only. Trading futures involves substantial risk of loss. See our risk disclosure.
Related Articles
MT4 to NinjaTrader 8: Running an MQL4 EA on a Futures AccountRead article →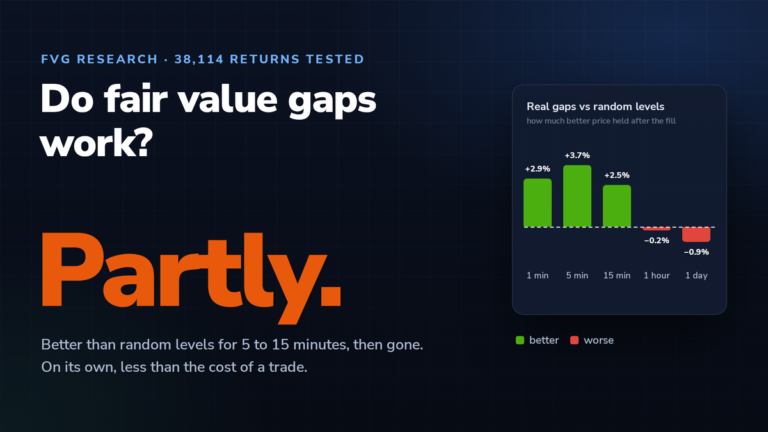 Do Fair Value Gaps Work? We Tested 38,114 Returns to FVGsRead article →
 ICT Displacement and the Market Structure Shift: We Tested 15,817 SignalsRead article →