MT5 Volume Profile Indicator
MT5 Volume Profile Indicator builds session, daily and weekly volume profiles with POC, value area, developing levels, virgin POCs and the initial balance. Four display modes, touch and breakout alerts, and indicator buffers for Expert Advisors are included.
Already a subscriber or have purchased a product?
Volume Profile Explained
A volume profile shows how much trading took place at each price during a period. Instead of volume per bar, it shows volume per price level, so you can see where the market spent most of its activity and where it moved through quickly.
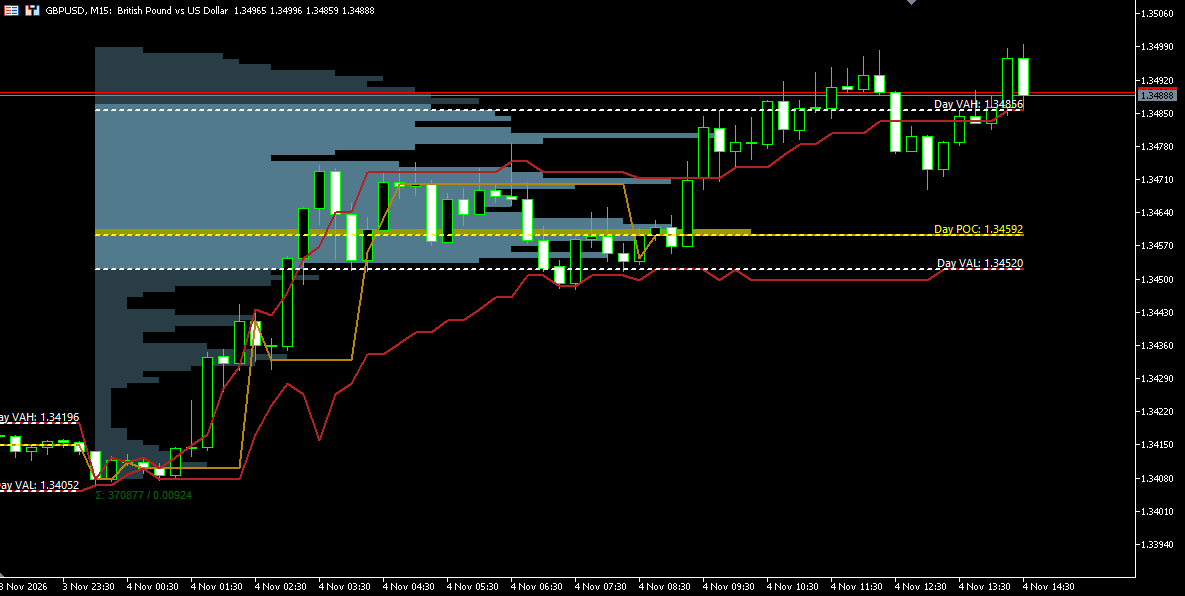
The MT5 Volume Profile Indicator builds a profile for each trading session, day or week on the MetaTrader 5 chart, from one-minute tick volume. Each profile shows its point of control, the price with the highest volume, and its value area, the range that holds 68% of the volume by default, with labelled POC, VAH and VAL lines and a summary of total volume and range.
Four display modes show the same profile as total volume, buying and selling, delta or a heat map. Developing POC and value area lines show how those levels moved during the period. POCs of completed profiles that price has not revisited are extended as virgin POCs, and each period’s initial balance is drawn with its own POC and value area.
Markers and alerts mark touches of virgin POCs and breakouts of the initial balance, and alerts can also be set for touches of the current POC, VAH and VAL. The Volume Profile Explained article covers the concepts in more detail.
Volume Profile Indicator — Key Features
Session, Daily and Weekly Profiles
One profile per trading session, day or week, or several periods combined.
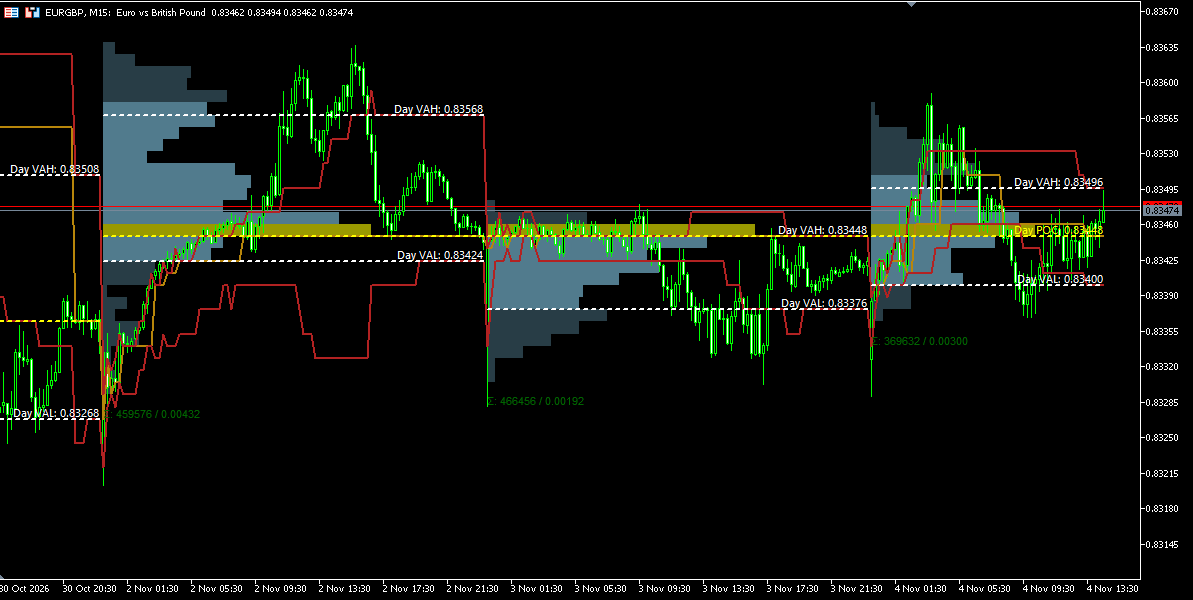
The indicator builds a separate volume profile for each period: a custom session, 08:30 to 22:00 by default, a day or a week. Session times follow the chart’s server time, and a session can run across midnight. Number Of Periods combines several consecutive periods into one profile, for example five days into a single composite profile. Profiles are calculated for the last 1,500 chart bars by default.
Combined Profile from Five Days
Volume From One-Minute Data
Profiles are built from M1 tick volume on any chart timeframe.
For history, the tick volume of each one-minute bar is spread evenly across the prices it traded. In real time, each new volume increment is added at the current price. Ticks Per Level sets the height of each level, 2 ticks by default, so the profile can be made finer or coarser.
Four Display Modes
Standard, Buy / Sell, Delta and Heat views of the same profile.
- Standard — total volume at each level.
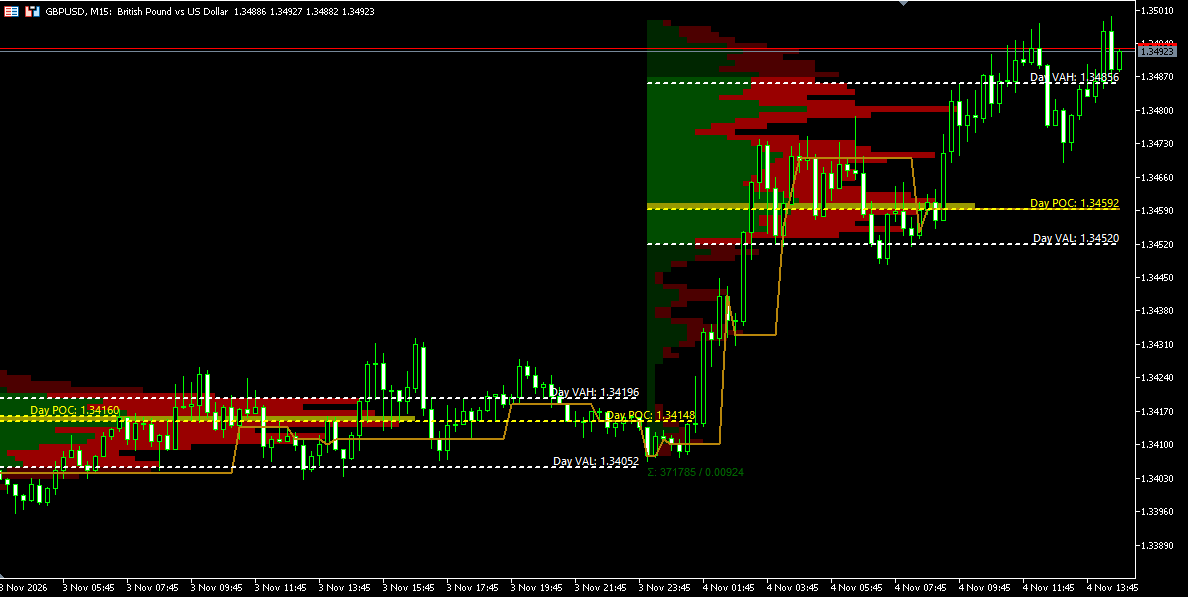
- Buy / Sell — volume split into buying and selling, classified by the direction of each one-minute bar: a bar that closes above its open counts as buying, otherwise as selling.
- Delta — the difference between buying and selling volume at each level.
- Heat — levels coloured by volume, from the start colour to the end colour.
Standard
Buy / Sell
Delta
Heat
POC and Value Area
Point of control and the value area for every profile.
The POC marks the price level with the highest volume. The value area covers 68% of the profile’s volume by default and is built outward from the POC, comparing two levels above with two levels below at each step. Levels inside the value area are drawn lighter than those outside it. POC, VAH and VAL lines can show labels and prices at the end of the profile.
POC, Value Area and Profile Summary
Developing POC and Value Area
See how the POC and value area moved during the period.
When enabled, the developing POC, VAH and VAL are drawn bar by bar, showing where the POC and value area stood at each moment of the session.
Developing POC
Developing Value Area
Virgin POC
POCs of completed profiles that price has not revisited.
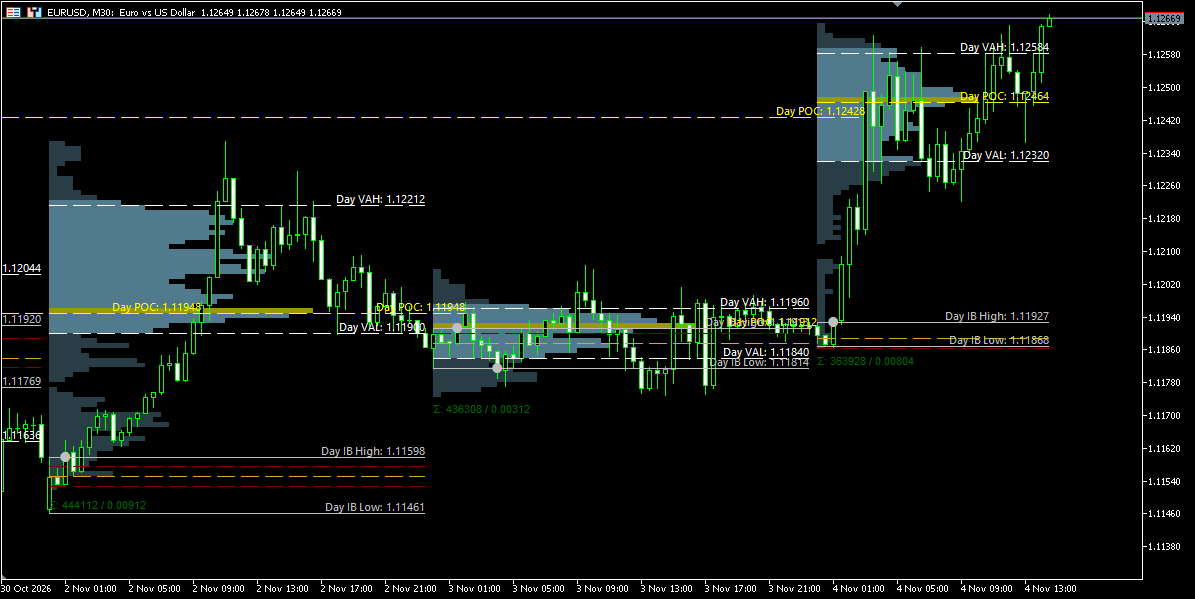
When a profile is complete, its POC is extended to the right and labelled Virgin POC until a later bar trades through it. At the first touch, the line stops at that bar, and a marker and an alert can be shown. The What Is a Virgin POC? article explains the concept.
Virgin POC
Initial Balance
The range of the first part of each period, with its own POC and value area.
The initial balance is the high and low of the first 60 minutes of each period by default. The indicator also builds a profile of that time and draws its POC and value area. A breakout marker and an alert can be shown when price leaves the initial balance after the previous bar closed inside it, judged by the close or by the bar’s high and low. Repeat signals can be allowed after price returns inside the range.
Initial Balance
Touch and Breakout Alerts
Alerts for the levels that matter during the session.
Alerts can be set for touches of the current profile’s POC, VAH and VAL, touches of virgin POCs and initial balance breakouts. Touch alerts for the current profile start once a set share of the period has passed, 20% by default, so the first minutes of a forming profile do not trigger them. Alerts are sent in real time as a sound, a pop-up and an email, each switched on or off separately.
Profile Summary
Total volume and range under each profile.
A line under each profile shows its total volume and its price range, for example Σ: 355019 / 0.00780. Large totals are shortened with K.
Styling
Colours, opacity and line styles for every element.
Profile opacity, colours for each display mode, and colour, width and style for every line can be set separately. Labels and prices can be switched on or off for each line.
Signals Readable by Expert Advisors
Levels and signals stored in indicator buffers.
An Expert Advisor can read the indicator through iCustom() and CopyBuffer(): the POC, VAH and VAL of the current profile, the nearest virgin POCs above and below price, the initial balance levels, the POC and value area of the previous session, the developing levels, and the touch and breakout signals.
How to Read and Use the Volume Profile
Choosing the Period
Match the profile to the time you trade. A custom session limits the profile to your trading hours, set in the chart’s server time; Day and Week profiles cover whole calendar periods. Combining several periods with Number Of Periods gives a broader reference, such as one profile for the last five days.
Reading the POC and Value Area
The POC is the price where the most volume traded in the period, and the value area is the range around it that holds most of the volume. Many traders read the value area as the range of prices the market accepted during that period, and the POC as its centre.
Where the next period opens and trades relative to the previous value area is a common reference: inside it, near its edges, or away from it. The indicator shows these levels; how they are used is part of each trader’s own method.
Reading the Display Modes
Standard shows where volume concentrated. Heat makes high-volume and low-volume areas stand out by colour. Buy / Sell and Delta show whether the volume at each level came mostly from rising or falling one-minute bars.
Watching Virgin POCs
A virgin POC is the POC of a completed profile that price has not traded through since. Many traders treat these untested levels as references for later sessions. The indicator keeps them on the chart until the first touch, then marks the touch and stops the line there.
Using the Initial Balance
The initial balance shows the range of the first part of the period, 60 minutes by default. A move outside it later in the period is marked as a breakout, with the option to judge it by the close or by the bar’s high and low. The initial balance POC and value area show where volume concentrated within that opening range.
Alerts
Alerts and markers show that price has reached a level or left the initial balance. They are a cue to look at the chart, not a complete trading rule.
Limitations
- The profile uses tick volume from MetaTrader 5, which counts price updates, not traded contracts. For forex this is the volume MetaTrader 5 provides, and it can differ between brokers.
- Buy / Sell and Delta classify each one-minute bar as buying or selling by its direction. They are not bid and ask volume.
- In history, each minute’s volume is spread evenly over its price range, so the distribution within a single minute is approximated.
- The profile needs one-minute history for the calculated range. If M1 history is incomplete, the indicator waits for it before drawing.
Indicator Settings & Parameters
Inputs as they appear in the indicator’s Inputs tab.
| Parameter | Description |
|---|---|
| License | |
| License Email | The email used for your trial, subscription or purchase. The license is verified with this email. |
| Alerts | |
| Enable sound alert | Plays a sound when an alert is triggered. Default: true. |
| Enable email alert | Sends an email. Requires email settings in MetaTrader 5. Default: true. |
| Enable pop up alert | Shows a pop-up alert. Default: true. |
| Alert sound file | Sound file played for alerts. Default: Alert1.wav. |
| General Settings | |
| History Bars To Process | Number of chart bars for which profiles are calculated. Default: 1,500. |
| Profile | |
| Profile Period | Custom Session, Day or Week. Default: Custom Session. |
| Number Of Periods | Number of consecutive periods combined into one profile. Default: 1. |
| Custom Session Start Time / End Time | Session hours in the chart’s server time, used with Custom Session. Defaults: 08:30 and 22:00. |
| Profile Display Mode | Standard, Buy / Sell, Delta or Heat. Default: Standard. |
| Ticks Per Level | Number of ticks merged into one profile level. Default: 2. |
| Value Area (%) | Share of the profile’s volume included in the value area. Default: 68. |
| Profile Elements | |
| Show POC | Draws the POC of each profile. Default: true. |
| Show Developing POC | Draws the developing POC bar by bar. Default: false. |
| Show VA | Draws the VAH and VAL of each profile. Default: true. |
| Show Developing VA | Draws the developing VAH and VAL bar by bar. Default: false. |
| Show Virgin POC | Extends the POCs of completed profiles until price touches them. Default: true. |
| Show Initial Balance | Draws the initial balance with its POC and value area. Default: true. |
| Initial Balance Period Minutes | Length of the initial balance. Default: 60. |
| Show Profile Summary | Shows total volume and range under each profile. Default: true. |
| Alerts & Markers | |
| Min Period Progress (%) | Share of the period that must pass before touch alerts for the current POC, VAH and VAL are sent. Default: 20. |
| Enable POC Touch Alert | Alert when price touches the current POC. Default: true. |
| Enable VAH/VAL Touch Alert | Alert when price touches the current VAH or VAL. Default: true. |
| Enable Virgin POC Touch Alert | Alert at the first touch of a virgin POC. Default: true. |
| Enable Initial Balance Breakout Alert | Alert when price breaks out of the initial balance. Default: true. |
| Enable Virgin POC Touch Marker | Marker at the first touch of a virgin POC. Default: true. |
| Enable Initial Balance Breakout Marker | Marker at an initial balance breakout. Default: true. |
| Initial Balance Breakout Price Type | Close or High / Low: how a breakout is judged. Default: Close. |
| Allow Initial Balance Repeat Signals | Allows further breakout signals after price returns inside the initial balance. Default: false. |
| Styling | |
| Profile Opacity (%) | Opacity of the profile. Default: 60. |
| Volume Profile Color | Profile colour in Standard mode. Default: sky blue. |
| Buy / Sell Volume Profile Color | Buying and selling colours in Buy / Sell and Delta modes. Defaults: green and red. |
| Heat Profile Start / End Color | Colours for the lowest and highest volume in Heat mode. Defaults: yellow and red. |
| POC Line Color / Width / Style | Appearance of the POC line. Defaults: yellow, 1, dash. |
| Developing POC Line Color / Width / Style | Appearance of the developing POC. Defaults: dark goldenrod, 1, solid. |
| VAL / VAH Line Color / Width / Style | Appearance of the value area lines. Defaults: white, 1, dash. |
| Developing VA Line Color / Width / Style | Appearance of the developing VAH and VAL. Defaults: fire brick, 1, solid. |
| Initial Balance Line Color / Width / Style | Appearance of the initial balance high and low. Defaults: silver, 1, solid. |
| Initial Balance VA Line Color / Width / Style | Appearance of the initial balance value area. Defaults: maroon, 1, dash. |
| Initial Balance POC Line Color / Width / Style | Appearance of the initial balance POC. Defaults: goldenrod, 1, dash. |
| Line Label / Line Value | Shows the label and the price at the end of each line, set separately for POC, VAH, VAL, initial balance, initial balance VA and initial balance POC lines. |
| Profile Summary Color | Colour of the profile summary. Default: dark green. |
| Virgin POC Touch Marker Color | Default: yellow. |
| IB High / IB Low Breakout Marker Color | Defaults: silver. |
Frequently Asked Questions
Volume Profile Basics
A histogram that shows how much volume traded at each price during a period. Its main levels are the point of control, the price with the highest volume, and the value area, the range that holds most of the volume.
The POC of a completed profile that price has not traded through since. The indicator extends it to the right until the first touch, then marks the touch and stops the line.
The high and low of the first part of each period, 60 minutes by default. The indicator draws it with its own POC and value area and can mark breakouts beyond it.
Tick volume from MetaTrader 5 one-minute bars. For forex this is the volume MetaTrader 5 provides; it counts price updates rather than traded contracts and can differ between brokers.
No. In Buy / Sell and Delta modes, each one-minute bar’s volume counts as buying if the bar closed above its open and as selling otherwise.
Setup & Use
Any. Profiles are built from one-minute data, so the levels are the same on M5, M30 or H1. History Bars To Process counts chart bars, so on higher timeframes the same setting covers more days.
In the chart’s server time. A session can also run across midnight, for example from 22:00 to 06:00.
It needs one-minute history for the calculated range. MetaTrader 5 may still be loading it; the profiles appear once the history is available.
Touch alerts for the current POC, VAH and VAL start after Min Period Progress, 20% of the period by default, so the levels of a just-started profile do not trigger them.
Yes. POC, VAH, VAL, the nearest virgin POCs, initial balance levels, the previous session’s POC and value area, developing levels and touch and breakout signals are stored in indicator buffers.
System Requirements & Installation
What you need to run the indicator, how to download and install it in MetaTrader 5, and how the license works.
System Requirements
- Platform
- MetaTrader 5 (Desktop)
- Operating system
- Windows 10 or Windows 11
- Instruments
- Forex pairs, metals, indices, CFDs and other symbols available from your broker in MetaTrader 5
- Data
- Your broker’s price feed in MetaTrader 5, including one-minute history for the calculated range
Not available on MetaTrader 5 Web or Mobile. Custom indicators run in the MetaTrader 5 desktop terminal only.
License Terms
- Lifetime License
- This indicator only, 1 live and 1 demo account, one-time payment, free updates included.
- All-Access Subscription
- All indicators and trade copiers, billed monthly, cancel anytime, updates included while the subscription is active.
- Free trial
- 5 days on the subscription plan. If not cancelled, the subscription starts automatically.
- License binding
- Linked to your email and to your MetaTrader 5 trading accounts: one live account and one demo account.
- Computers
- Not restricted. The license is linked to your trading accounts, not to a specific computer.
Installation
- Get access
Start the free trial, subscribe, or buy a lifetime license on this page.
- Download
The indicator is not sent by email. Open (top right of this page) and enter the email you used for your trial, subscription or purchase. The indicator file (.ex5) downloads to your computer.
- Copy to the MetaTrader 5 data folder
In MetaTrader 5, go to
File → Open Data Folder, openMQL5 → Indicatorsand copy the downloaded .ex5 file there. - Add to a chart
Restart MetaTrader 5 or right-click Indicators in the Navigator window and select Refresh. Then drag the indicator from the Navigator onto a chart.
- Activate the license
In the indicator inputs, enter the same email. On first activation, the license is linked to that email and to the trading account the terminal is logged into.
The license check needs DLL imports. Allow them in the indicator’s Common tab or under
Tools → Options → Expert Advisors. Without them, or without a valid email, the indicator shows a message and does not load.
Updating: When a new version is released, download it again through and replace the existing .ex5 file in the same folder.
Installation questions? Contact support, Monday to Friday.
Related Products
"Best Seller" and "Trending" reflect Nordman Algorithms sales and usage data, January–September 2026.
Disclaimer — Software Use & Risk Disclosure
Nordman Algorithms is a trade name of Nordman Algorithms OÜ (Reg. No. 14435535), registered in Tallinn, Estonia.
Software Use
Software Nature & User Responsibility — Nordman Algorithms provides algorithmic software tools for technical analysis. Nordman Algorithms is not a financial advisor and is not liable for any losses. All trades conducted based on the software’s output are executed at the user’s sole discretion and risk.
Visual Markers & Signal Disclosure — This software may display visual markers (such as arrows, dots, or alerts) when predefined mathematical conditions are met. These markers are provided for educational and analytical purposes only, must not be interpreted as financial guidance, and do not constitute a recommendation to buy, sell, or hold any financial instrument. Users must independently validate all visual cues within their own trading methodology.
No Financial Advice — Nordman Algorithms does not provide discretionary trading signals, investment advice, or managed signal services. Our software represents a mathematical visualization of historical and real-time data. The appearance of a visual marker does not guarantee a profitable trade or predict future market behavior.
Read the full Terms of Service →Risk Disclosure
Trading Risk Warning — Futures, Forex, and options trading involve significant risk. Risk capital is money that can be lost without jeopardizing financial security. Only risk capital should be used for trading. Past performance is not indicative of future results. An investor could potentially lose all or more than the initial amount committed.
ESMA Risk Warning — Financial instruments, especially those involving leverage such as CFDs and Forex, are complex and carry a high risk of rapid financial loss. Our software provides analytical outputs and visual markers based on predefined mathematical conditions and does not mitigate or reduce inherent market risks. You should carefully consider whether you understand how leveraged financial instruments work and whether you can afford the high risk of losing your capital.
CFTC Rule 4.41 — Hypothetical or simulated performance results have inherent limitations. Unlike actual performance records, simulated results do not represent real trading. Because trades have not actually been executed, these results may under- or over-compensate for the impact of market factors such as liquidity. Simulated results are also subject to the benefit of hindsight. No representation is being made that any account will achieve profits or losses similar to those shown.
Read the full Risk Disclosure →Trademark Notice — MetaTrader 5 and MT5 are trademarks of MetaQuotes Ltd. Nordman Algorithms is an independent software developer and is not affiliated with, sponsored by, or endorsed by MetaQuotes Ltd. References to MetaTrader 5 identify software compatibility.
Need a different setup?
We can customize this indicator to your specifications: add new functions, modify the logic, refine visuals, or integrate it with other MetaTrader 5 tools. We also convert indicators into Expert Advisors with trailing stops, position parameter controls, execution filters and rule-based automation built to your technical specifications.
Every project is delivered with full source code and post-delivery support. Fixed-price quote before development begins.