MT5 Currency Strength Meter Indicator
MT5 Currency Strength Meter Indicator scores eight currencies across 28 pairs on several timeframes and shows them in a colour-coded table with the strongest-against-weakest pair for each timeframe. For the pair on the chart, it draws the strength of both currencies and a histogram of the difference, with arrows and alerts when the balance changes.
Already a subscriber or have purchased a product?
Currency Strength Meter Explained
Every forex pair is two currencies, and a move in the pair can come from either of them. A currency strength meter splits the pairs back into currencies and shows which ones are strong and which are weak across the market, so you can see what is actually moving a pair.
The MT5 Currency Strength Meter Indicator takes eight currencies, by default EUR, USD, GBP, JPY, NZD, AUD, CHF and CAD, finds the 28 pairs between them at your broker and checks each pair on several timeframes. Every pair that is up adds a point to its first currency and takes one from the second. The result is a score for each currency on each timeframe and a total across all of them, shown in a colour-coded table in the indicator window.
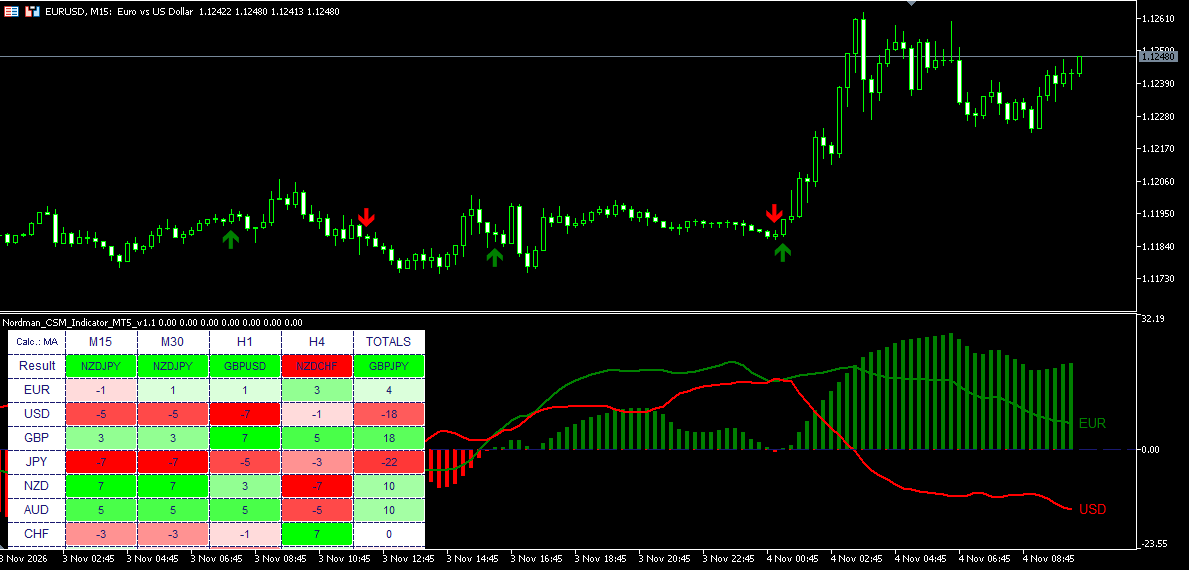
For the pair on the chart, the indicator also draws the strength of its two currencies as lines and the difference between them as a histogram: green when the smoothed strength difference is positive, red when it is negative. When the histogram changes sides, an arrow appears on the price chart, and an alert, email or push notification can be sent.
The table shows the strongest and the weakest currency on each timeframe and the pair made of the two. Clicking that pair opens it on the chart. Scores can be calculated from moving averages, RSI or MACD, and all values are based on closed bars.
Currency Strength Meter — Key Features
Currency Strength Table
Scores for every currency on every enabled timeframe, plus totals.
The table lists each currency in a row and each enabled timeframe in a column, M15, M30, H1 and H4 by default, with a TOTALS column at the end. A score of +7 means the currency is stronger than all seven others on that timeframe, −7 that it is weaker than all of them. TOTALS adds the timeframes together.
A Result row shows, for each column, the pair made of the strongest and the weakest currency. The Reading the Table tab explains every part of the table in detail.
Three Calculation Modes
Strength can be measured with a moving average, RSI or MACD.
- MA — a pair counts as up when it closes above its moving average, 20-period EMA by default.
- RSI — a pair counts as up when its RSI is at or above 50.
- MACD — a pair counts as up when the MACD main line is at or above zero.
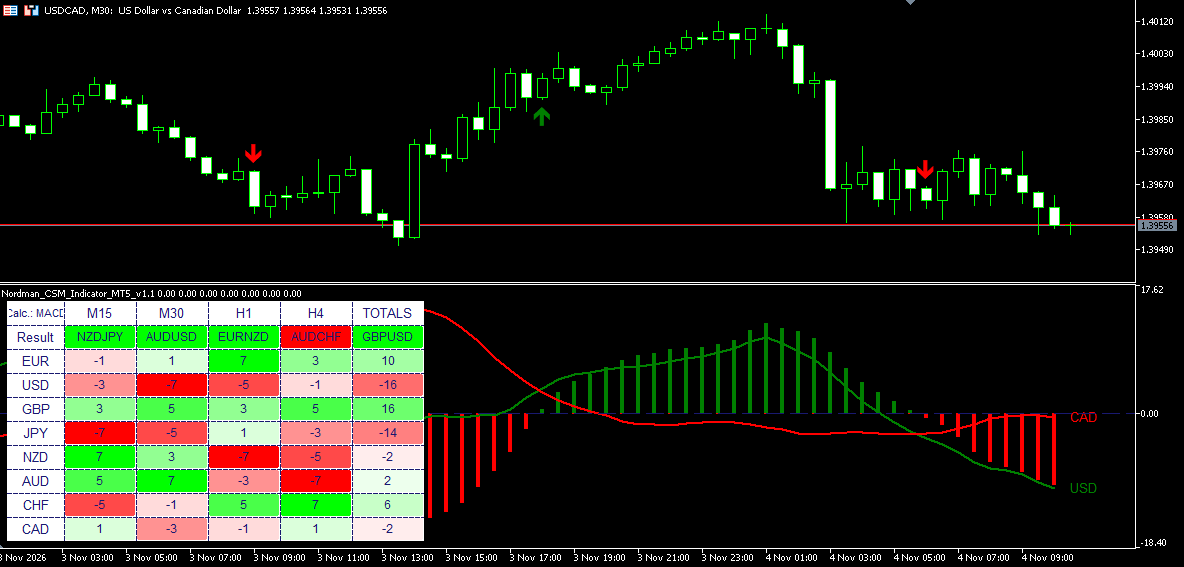
The mode is set in the inputs and can be switched on the chart by clicking the Calc. cell in the table. The indicator then recalculates and keeps the selected mode when you change symbols from the table.
Three Calculation Modes
Pair Histogram and Strength Lines
The two currencies of the chart’s pair, compared bar by bar.
For the pair on the chart, the indicator subtracts the total score of the second currency from the total score of the first and smooths the result, with a 14-period EMA by default. The histogram is green when the smoothed strength difference is positive and red when it is negative. Because the difference is smoothed, its sign can lag behind the current, unsmoothed difference.
Two lines show the smoothed scores of the two currencies, green for the first and red for the second, each labelled with its currency code. The lines show which of the two is changing when the histogram moves.
Zone-Change Arrows and Alerts
A marker and an optional notification when the histogram changes sides.
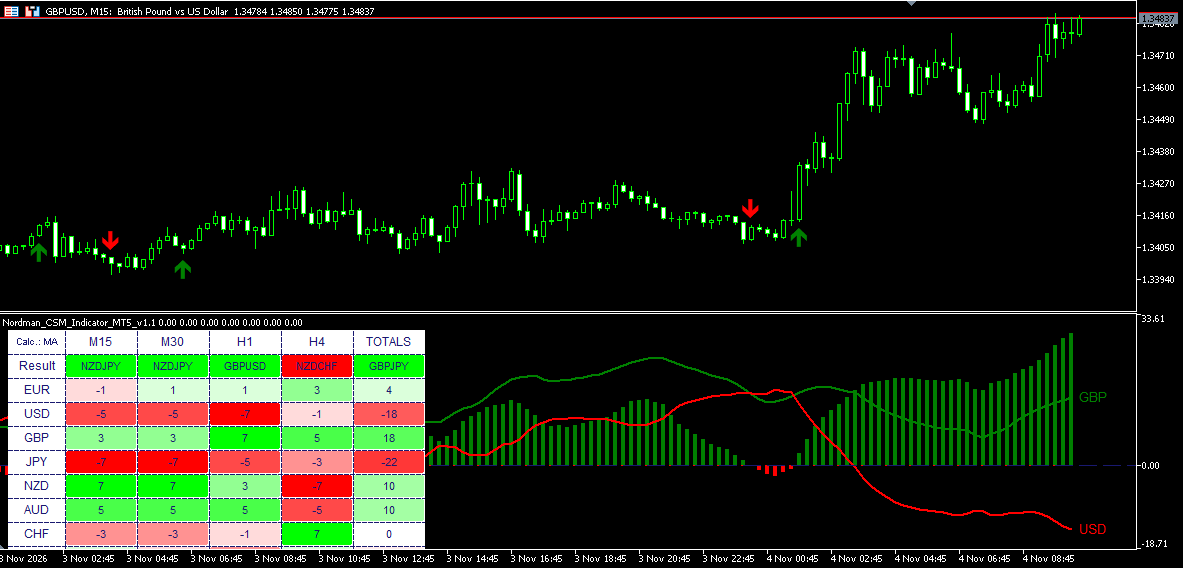
When the histogram turns from red to green, a buy arrow is drawn below the bar on the price chart; when it turns from green to red, a sell arrow is drawn above it. On a newly closed bar, the indicator can send a pop-up alert, an email and a push notification to the MetaTrader 5 mobile app, each switched on or off separately.
Zone-Change Arrows
One-Click Pair Switching
Open the strongest-against-weakest pair from the table.
Clicking a pair in the Result row opens it on the current chart, on the timeframe of that column. A click in the TOTALS column opens the pair on the chart’s current timeframe.
Custom Currencies and Broker Symbols
Choose the currencies; the indicator finds the pairs.
The currency list is an input. The indicator builds every pair between the listed currencies, finds them at your broker including symbol prefixes and suffixes such as EURUSD.m, and adds them to Market Watch. Any of the nine timeframes from M1 to MN can be included in the table.
Closed-Bar Calculation and History Loading
Values are calculated on closed bars, after the history of all pairs is loaded.
Scores, the histogram and the arrows are based on closed bars, and each table column shows the last closed bar of its own timeframe. On first start the indicator loads the history of every pair and timeframe and shows the progress under the table. If some history is still missing after the set waiting time, it calculates with the available data and recalculates once everything has arrived.
Signals Readable by Expert Advisors
Zones and scores are stored in indicator buffers.
For the pair on the chart, an Expert Advisor can read the indicator through iCustom() and CopyBuffer(): the green and red histogram zones in buffers 0–1, the smoothed scores of the two currencies in buffers 2–3, the raw difference in buffer 4 and the raw scores of the two currencies in buffers 5–6.
In the zone buffers, 0 means that the bar belongs to the other zone; EMPTY_VALUE means that no data is available for the bar. The buffers cover the chart’s pair, not the full table of currencies and timeframes.
How to Read the Currency Strength Table
The table turns 28 currency pairs into one score per currency and timeframe. Here is how the scores are built and what each part of the table and the indicator window shows.
Reading the Currency Strength Table
How the Scores Are Built
On each timeframe, the indicator checks every pair between the listed currencies. If a pair counts as up, its first currency gets +1 and its second currency −1. If it counts as down, the points go the other way. Whether a pair is up or down depends on the calculation mode: above or below its moving average, RSI above or below 50, or MACD above or below zero.
Example on one timeframe in MA mode:
| Pair | Close vs moving average | EUR | Other currency |
|---|---|---|---|
| EURUSD | Above | +1 | USD −1 |
| EURJPY | Above | +1 | JPY −1 |
| EURGBP | Below | −1 | GBP +1 |
With the default eight currencies and all 28 pairs available, each currency appears in seven pairs, so its score ranges from −7 to +7 per timeframe. Missing broker symbols or unavailable data may reduce the effective range. If EUR is up in six of its pairs and down in one, its score is 6 − 1 = +5. TOTALS adds the scores of all enabled timeframes: with four timeframes, from −28 to +28.
The score represents the net balance of positive and negative pair comparisons, not the size of price movements. For example, a score of +5 can result from six positive comparisons and one negative comparison.
What the Colours Mean
- Green — a positive score, the currency is stronger than most of the others.
- Red — a negative score, the currency is weaker than most of the others.
- Saturation — the closer a score is to the end of its range, the deeper the colour. Scores near zero are almost white.
The Result Row
For each column, the Result row shows the pair made of the strongest and the weakest currency, named as your broker lists it.
- Green Result — the strongest currency is the base currency of the displayed pair, indicating a positive relative-strength bias: for example, GBPJPY with GBP strongest and JPY weakest.
- Red Result — the strongest currency is the quote currency of the displayed pair, indicating a negative relative-strength bias: for example, NZDCHF with CHF strongest and NZD weakest.
If two currencies share the highest or the lowest score, the one in the chart’s pair is shown. Clicking a Result cell opens that pair on the chart, on the timeframe of its column.
Switching the Calculation
The top-left cell shows the current mode, for example Calc.: MA. Clicking it switches to RSI, then MACD, then back to MA. The indicator reloads and recalculates, and the table fills again once the data is ready.
The Status Line
While the history of the pairs is loading, a line under the table shows the progress, for example Loading history 17/112, where 112 is 28 pairs on four timeframes. If some history is still missing after the waiting time, the line says so, the indicator calculates with the data it has and recalculates once the rest has arrived.
The Indicator Window
Next to the table, the indicator window shows the pair on the chart. The histogram is the smoothed difference between the totals of its two currencies: green when the smoothed strength difference is positive, red when it is negative. The green and red lines are the smoothed scores of the two currencies, labelled on the right.
When the histogram moves, the lines show why: whether the first currency is gaining strength, the second is losing it, or both.
Histogram and Strength Lines
How to Use the Currency Strength Meter
Choosing a Pair
The most direct use of the table is to see which currencies are leading and which are lagging. A pair made of a strong and a weak currency combines two moves in the same direction; that is the pair the Result row shows.
Pairs of two strong or two weak currencies often move less, because both sides are pulled the same way. The table helps to spot them before spending time on their charts.
Choosing a Pair: Strongest Against Weakest
Reading Timeframe Agreement
- The same sign in every column — the currency is strong or weak on every timeframe, and its total is close to the end of the range.
- Higher and lower timeframes disagree — for example, strong on H4 and H1 but negative on M15. This is often a pullback within a larger move. Some traders take the direction from the higher timeframes and wait for the lower ones to turn back.
- Scores near zero everywhere — no currency is clearly leading.
Using the Indicator as a Filter
The histogram can be read next to any other method. If another tool points to buying GBPUSD, a green histogram shows that the smoothed strength difference currently favours GBP over USD; a red one shows that the idea goes against the relative strength of the two currencies.
Seeing Who Is Moving the Pair
When a pair moves, the strength lines and the table show whether the move comes from its first currency, its second one or both. In the example below, GBPCHF rises while the CHF line falls sharply and the GBP line rises only slightly: the move comes mainly from a weaker franc.
The same check helps after news. If EURUSD falls while USD is strong against everything and EUR is neutral elsewhere, the move is about the dollar, and a pair of USD against the weakest currency shows that strength more directly.
Who Is Moving the Pair
Watching Currency Exposure
Several open positions can depend on the same currency: buying EURJPY and GBPJPY are both a bet against the yen. The table shows that currency’s row, and a change in its scores affects all of those positions at once.
Alerts
Arrows and notifications mark the bar on which the histogram changed sides. They show that the balance between the two currencies has shifted and are a cue to look at the chart, not a complete trading rule.
Limitations
- Scores are the net balance of positive and negative pair comparisons, not the size of price movements.
- Scores are capped at the ends of the range: a currency at +7 on every timeframe cannot rise further in the table.
- The moving average, RSI and MACD in the calculation and the smoothing of the histogram react with a delay.
- In quiet markets, scores near zero change often and zone changes become more frequent.
- Closely related currencies, such as AUD and NZD, often score alike, and pairs made of them may move little.
- The indicator does not provide entry levels, stop-loss levels or targets.
Indicator Settings & Parameters
Inputs as they appear in the indicator’s Inputs tab, followed by the plots listed in the Colors tab.
| Parameter | Description |
|---|---|
| License | |
| License Email | The email used for your trial, subscription or purchase. The license is verified with this email. |
| General Settings | |
| Currencies | Comma-separated list of currencies. The indicator uses every pair between them that your broker offers. Default: EUR, USD, GBP, JPY, NZD, AUD, CHF, CAD. |
| Strength Smoothing Period | Smoothing period of the histogram and the two strength lines. Default: 14. |
| Strength Smoothing Method | Smoothing method: Simple, Exponential, Smoothed or Linear Weighted. Default: Exponential. |
| Calculation Type | How each pair is scored: MA, RSI or MACD. Can also be switched on the chart from the table. Default: MA. |
| Enable M1 … Enable MN | Timeframes included in the table and the totals, from M1 to MN. Default: M15, M30, H1 and H4. |
| Max Bars | Number of historical bars calculated on the chart. Default: 500. |
| Enable Alert | Pop-up alert when the histogram changes sides on a closed bar. Default: true. |
| Enable Email | Email notification for the same event. Requires email settings in MetaTrader 5. Default: true. |
| Enable Mobile | Push notification to the MetaTrader 5 mobile app. Requires notification settings in MetaTrader 5. Default: true. |
| MA Settings | |
| MA Period | Moving average period for MA mode. Default: 20. |
| MA Method | Moving average method. Default: Exponential. |
| MA Applied Price | Price used by the moving average. Default: Close. |
| RSI Settings | |
| RSI Period | RSI period for RSI mode. Default: 14. |
| RSI Applied Price | Price used by the RSI. Default: Close. |
| MACD Settings | |
| Fast | Fast EMA period for MACD mode. Default: 12. |
| Slow | Slow EMA period. Default: 16. |
| Signal | Signal line period. Default: 9. The score uses the MACD main line. |
| Applied Price | Price used by the MACD. Default: Close. |
| Dashboard Settings | |
| Background Color | Background colour of the table. Default: white. |
| Line Color | Colour of the table grid. Default: midnight blue. |
| Text Color | Colour of the table text. Default: midnight blue. |
| Font Name | Font of the table. Default: Arial. |
| Font Size | Font size of the table, from 7 to 12. Default: 9. |
| History Loading | |
| Max wait for history, sec (live only) | How long to wait for the history of all pairs before calculating with the available data. Default: 120. |
| Debug log | Writes details of history loading and calculation to the Experts log. Default: false. |
| Plots (Colors tab) | |
| CSM Buy Zone / CSM Sell Zone | The green and red histogram. |
| Base Score MA / Quote Score MA | The strength lines of the first and the second currency of the chart’s pair. |
Frequently Asked Questions
Currency Strength Basics
An indicator that splits currency pairs back into individual currencies and shows which are strong and which are weak across the market. This one scores eight currencies on several timeframes from the 28 pairs between them.
With eight currencies, each one is in seven pairs. A score of +7 on a timeframe means the currency is stronger than all seven others; −7 means it is weaker than all of them. TOTALS adds the timeframes together, from −28 to +28 with four timeframes.
The pair made of the strongest and the weakest currency in each column. A green Result means the strongest currency comes first in the pair, a red Result that it comes second.
MA scores pairs by their position relative to a moving average, RSI by whether RSI is above 50 and MACD by the sign of the MACD main line. When all three point to the same strongest and weakest currencies, the picture is consistent across methods.
Under normal operation, the indicator calculates scores and zone-change markers from closed bars, leaving the forming bar empty. Historical values may be recalculated if missing price history becomes available or MetaTrader 5 requests a full history refresh.
Setup & Use
On first start the indicator loads the history of every pair on every enabled timeframe, 112 data sets with the default settings. The progress is shown under the table, and the calculation starts when the data is ready.
Yes. The indicator finds the pairs at your broker including prefixes and suffixes and adds them to Market Watch.
Yes. On a chart such as gold or an index, the table works as usual, and the histogram and strength lines are not drawn, because they compare the two currencies of the chart’s pair.
Yes. Change the Currencies input. The score range on each timeframe is the number of currencies minus one.
Yes, for the pair on the chart. The histogram zones are in buffers 0–1, the smoothed scores of the two currencies in buffers 2–3, the raw difference in buffer 4 and the raw scores in buffers 5–6. In the zone buffers, 0 means the bar belongs to the other zone; EMPTY_VALUE means no data is available for the bar.
Yes. Use 1 minute OHLC or Every tick modelling when the indicator requires data from timeframes below the test chart’s timeframe. Open prices only may not provide those lower-timeframe series.
System Requirements & Installation
What you need to run the indicator, how to download and install it in MetaTrader 5, and how the license works.
System Requirements
- Platform
- MetaTrader 5 (Desktop)
- Operating system
- Windows 10 or Windows 11
- Instruments
- Forex currency pairs. The table also works on other charts; the histogram needs a currency pair from the list
- Data
- Your broker’s price feed for the pairs of the selected currencies. The indicator adds them to Market Watch and loads their history
Not available on MetaTrader 5 Web or Mobile. Custom indicators run in the MetaTrader 5 desktop terminal only.
License Terms
- Lifetime License
- This indicator only, 1 live and 1 demo account, one-time payment, free updates included.
- All-Access Subscription
- All indicators and trade copiers, billed monthly, cancel anytime, updates included while the subscription is active.
- Free trial
- 5 days on the subscription plan. If not cancelled, the subscription starts automatically.
- License binding
- Linked to your email and to your MetaTrader 5 trading accounts: one live account and one demo account.
- Computers
- Not restricted. The license is linked to your trading accounts, not to a specific computer.
Installation
- Get access
Start the free trial, subscribe, or buy a lifetime license on this page.
- Download
The indicator is not sent by email. Open (top right of this page) and enter the email you used for your trial, subscription or purchase. The indicator file (.ex5) downloads to your computer.
- Copy to the MetaTrader 5 data folder
In MetaTrader 5, go to
File → Open Data Folder, openMQL5 → Indicatorsand copy the downloaded .ex5 file there. - Add to a chart
Restart MetaTrader 5 or right-click Indicators in the Navigator window and select Refresh. Then drag the indicator from the Navigator onto a chart.
- Activate the license
In the indicator inputs, enter the same email. On first activation, the license is linked to that email and to the trading account the terminal is logged into.
The license check needs DLL imports. Allow them in the indicator’s Common tab or under
Tools → Options → Expert Advisors. Without them, or without a valid email, the indicator shows a message and does not load.
Updating: When a new version is released, download it again through and replace the existing .ex5 file in the same folder.
Installation questions? Contact support, Monday to Friday.
Related Products
"Best Seller" and "Trending" reflect Nordman Algorithms sales and usage data, January–September 2026.
Disclaimer — Software Use & Risk Disclosure
Nordman Algorithms is a trade name of Nordman Algorithms OÜ (Reg. No. 14435535), registered in Tallinn, Estonia.
Software Use
Software Nature & User Responsibility — Nordman Algorithms provides algorithmic software tools for technical analysis. Nordman Algorithms is not a financial advisor and is not liable for any losses. All trades conducted based on the software’s output are executed at the user’s sole discretion and risk.
Visual Markers & Signal Disclosure — This software may display visual markers (such as arrows, dots, or alerts) when predefined mathematical conditions are met. These markers are provided for educational and analytical purposes only, must not be interpreted as financial guidance, and do not constitute a recommendation to buy, sell, or hold any financial instrument. Users must independently validate all visual cues within their own trading methodology.
No Financial Advice — Nordman Algorithms does not provide discretionary trading signals, investment advice, or managed signal services. Our software represents a mathematical visualization of historical and real-time data. The appearance of a visual marker does not guarantee a profitable trade or predict future market behavior.
Read the full Terms of Service →Risk Disclosure
Trading Risk Warning — Futures, Forex, and options trading involve significant risk. Risk capital is money that can be lost without jeopardizing financial security. Only risk capital should be used for trading. Past performance is not indicative of future results. An investor could potentially lose all or more than the initial amount committed.
ESMA Risk Warning — Financial instruments, especially those involving leverage such as CFDs and Forex, are complex and carry a high risk of rapid financial loss. Our software provides analytical outputs and visual markers based on predefined mathematical conditions and does not mitigate or reduce inherent market risks. You should carefully consider whether you understand how leveraged financial instruments work and whether you can afford the high risk of losing your capital.
CFTC Rule 4.41 — Hypothetical or simulated performance results have inherent limitations. Unlike actual performance records, simulated results do not represent real trading. Because trades have not actually been executed, these results may under- or over-compensate for the impact of market factors such as liquidity. Simulated results are also subject to the benefit of hindsight. No representation is being made that any account will achieve profits or losses similar to those shown.
Read the full Risk Disclosure →Trademark Notice — MetaTrader 5 and MT5 are trademarks of MetaQuotes Ltd. Nordman Algorithms is an independent software developer and is not affiliated with, sponsored by, or endorsed by MetaQuotes Ltd. References to MetaTrader 5 identify software compatibility.
Need a different setup?
We can customize this indicator to your specifications: add new functions, modify the logic, refine visuals, or integrate it with other MetaTrader 5 tools. We also convert indicators into Expert Advisors with trailing stops, position parameter controls, execution filters and rule-based automation built to your technical specifications.
Every project is delivered with full source code and post-delivery support. Fixed-price quote before development begins.