You put your stop two ticks above the swing high. Price traded three ticks through it, filled you out, and reversed inside the next two bars. Without you.
A trader on the NinjaTrader forum wrote down the reaction everyone has at that moment. “The market is rigged; it stopped me out by one tick and then went my way!” He wrote it to argue against it. His answer, in the same post, is the idea this whole article is built on. “Price doesn’t hunt your stop to hurt you; it hunts your stop because you are providing the liquidity it needs to refuel” (Maverick, NinjaTrader forum, Dec 2025).
Not everyone in the thread bought it. The first reply was “someone spending to much time on chatgpt” [sic] (ValentineOnTheFloor, Dec 2025). That’s fair. A tidy explanation should come with evidence, and for this one the evidence exists. It comes from central bank research on where stop orders actually sit.
Below, I’ll walk you through what a liquidity sweep is and what that research found about stop clustering. You’ll see how to tell a sweep from a real breakout, and the five settings that decide whether your chart calls something a sweep at all. By the end you’ll know why your chart probably marks too many of them.
A liquidity sweep is price moving past a clear swing high or swing low, triggering the orders resting there, and then failing to hold beyond that level.
Smart Money Concepts traders split it into two sides. CrossTrade’s price action guide defines buy-side liquidity as “stops above swing highs (would trigger as buy orders if hit)”. Sell-side liquidity is “stops below swing lows (sell orders if hit)”.
The naming confuses people at first, so here it is in plain words. Buy-side liquidity sits above the highs because the orders there are buy orders. They are the stops of short sellers and the entries of breakout buyers. When price reaches them, they fire as market buys. And that’s exactly what a large seller needs: someone to sell to.
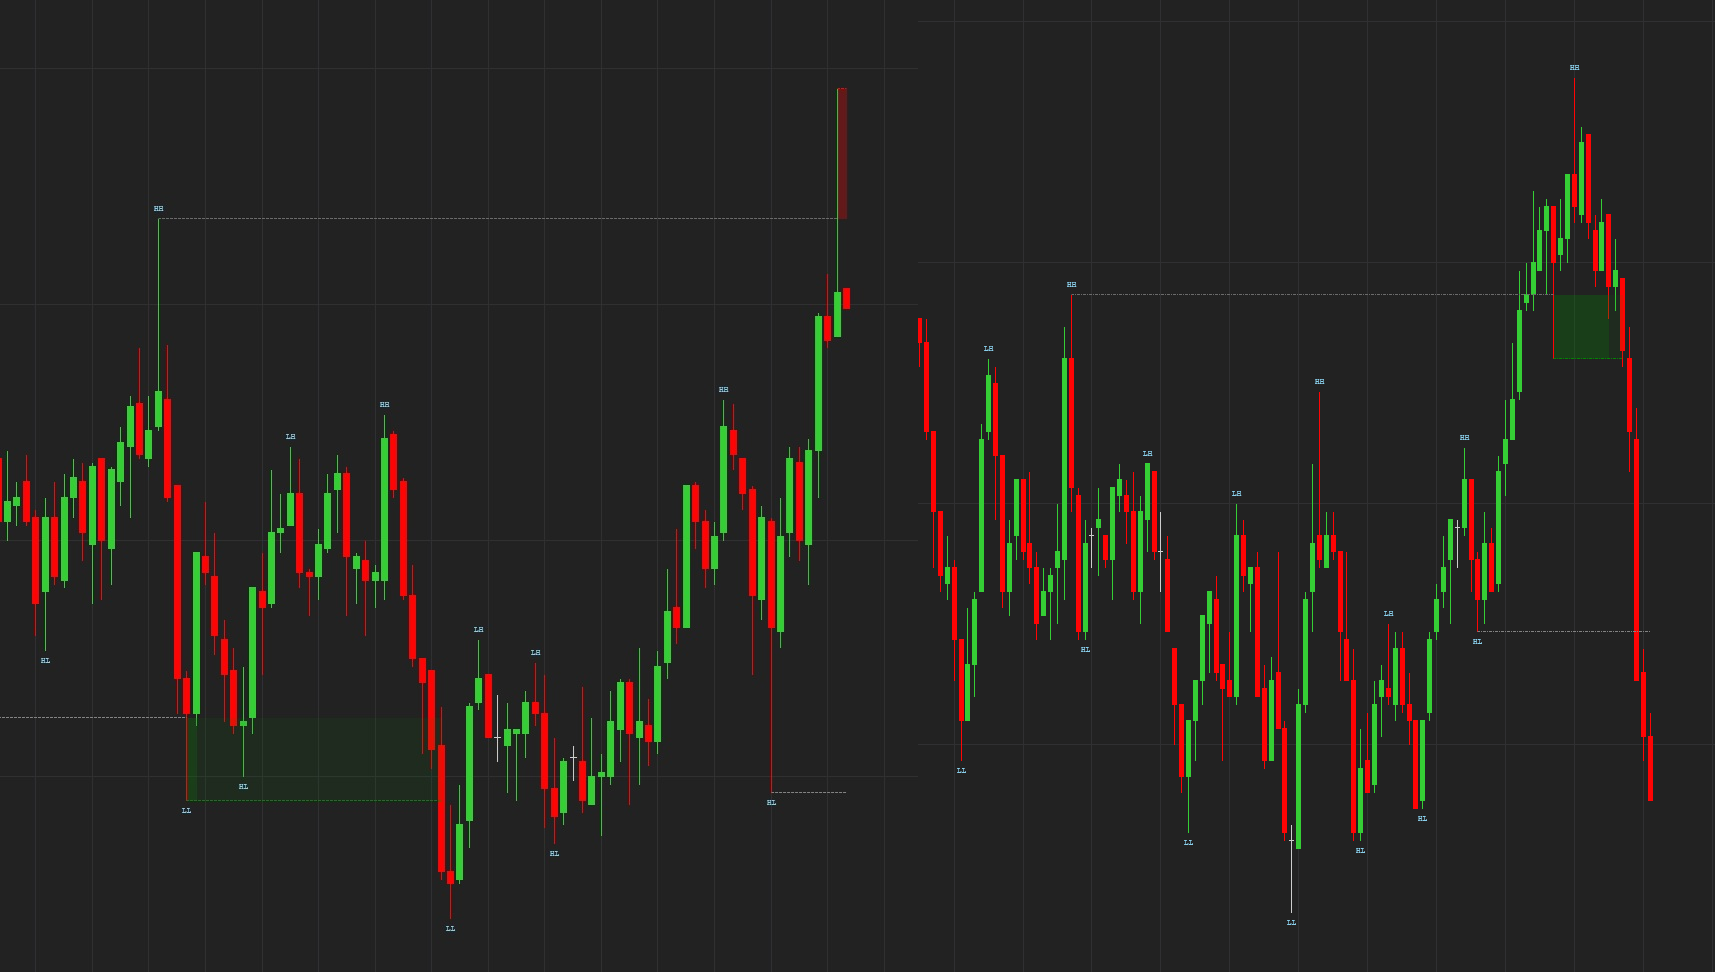
The same guide describes the shape you see on a chart. A sweep leaves “a long wick in the swept direction and a small body” that “closes back below (above) the swept level”, usually within one to three bars. A genuine breakout keeps going instead.
That’s the pattern you’ll see on your chart. The more useful question for you is why the orders are there in the first place.
If you want evidence rather than opinion, this is where the topic stops being folklore. Carol Osler studied a large sample of real currency orders for the Federal Reserve Bank of New York. The clustering she found is not subtle, and you can see it in one table.
Staff Report No. 125 looked at stop-loss buy orders near round numbers. It found that “a total of 7.4 percent of all stop-loss buy orders are placed at rates ending between 90 and 99, inclusive”. Just past the round number, the count doubles: “almost twice as many stop-loss buy orders, 14.4 percent, are placed at rates ending between 01 and 10, inclusive.”
Almost twice as many stops sit just past the round number as just short of it. For stop-loss sells the picture is mirrored. Take-profit orders behave differently again: “9.3 percent of take-profit orders are executed exactly at 00, while the corresponding percent for stop-loss orders is only 4.4.”
Take-profits sit on the level. Stops sit just past it. That one difference explains every sweep you’ll see on your chart.
The follow-up, Staff Report No. 150, measured what happens when price reaches those clusters. It confirms that “executed stop-loss sell orders cluster just below round numbers”. The buy side mirrors it: “stop-loss buy orders cluster just above round numbers”. And it measures the effect on price: “dollar-mark moves an average 0.061 percent during the 15 minutes after crossing a round number, but only 0.054 percent after crossing an arbitrary number.”
The gap is small, so you won’t feel it on a single trade, but it’s statistically solid. It also lasts longer than you might expect. The report finds the move “remains statistically significant for at least two hours.”
Market participants told the researchers that “large, noticeable cascades happen at most once per week, on average.” Not four times per session. Keep that number in mind for later.
Osler’s data is interbank currency orders. Our indicator runs on NinjaTrader 8, where most of you trade futures. It’s a different market with different participants and different order handling. So please don’t carry her percentages over to ES or NQ.
On the futures side, what we have is a 2017 CFTC study of stop orders in selected futures markets. Two findings matter for you here. On timing, “stop orders tend to cluster at the beginning and end of the day”. On volatility, “as daily price volatility increases, so does the percentage of trades executed by stop order.”
That is a weaker claim than the currency research makes, and it’s the honest one. Stops cluster in the futures you trade too. They get executed most in exactly the conditions where sweeps are said to happen. Anything beyond that is our inference, not a measured fact.
You open the depth of market ladder, see thin size at a level, and decide there’s no liquidity there. Most traders read it the same way.
CME Group argues against reading it that way. Its 2025 piece on liquidity calls a drop in book depth “an expected response to increased risk during volatile episodes”. Then it warns that “relying solely on it can lead to an incomplete assessment.” Its example is early April 2025. Book depth in E-mini S&P 500 futures fell 68 percent while volume ran more than 99 percent above average. The book was thin and the market was trading enormous size at the same time.
For sweeps, the point is simpler still. A stop order doesn’t show in your book at all, because it isn’t a live order until it triggers. That’s exactly why stops are useful to someone who needs size filled. And it’s why watching the ladder won’t tell you where a sweep is likely to form.
Every step below is a decision you make once and then keep. I’ll name the setting in our NinjaTrader indicator for each one, but the decisions apply whatever tool you use.
A sweep only exists relative to a swing high or low. Change how many bars confirm a swing, and you change every sweep on your chart.
Our NinjaTrader Liquidity Sweeps Indicator calls this Swing Strength: how many bars on each side must confirm a swing. Set it low and you get dozens of swings and dozens of meaningless pokes through them. Set it high and you get three swings a session and miss most of what happened. It’s the first setting, and it’s the one most traders skip.
Price ticking one tick past a swing high is not a sweep. It’s the spread.
So the threshold has to be a number. In our tool it’s Minimum Sweep Distance, set in ticks or as a percentage. It’s the minimum distance price must travel beyond the swing before the move counts, and it filters out small spikes. Pick the value once and write it down.
Two different behaviours both get called a sweep, and they need different rules.
Wick-based: price briefly trades past the swing, triggers the resting orders, and comes back inside the range in the same bar or the next one. It’s a sharp rejection.
Break-and-retest: price moves past the level and holds there for a few bars. Then it fails to stay and comes back through the level. It’s slower and uglier on the chart, and you’ll miss it if you only look for long wicks.
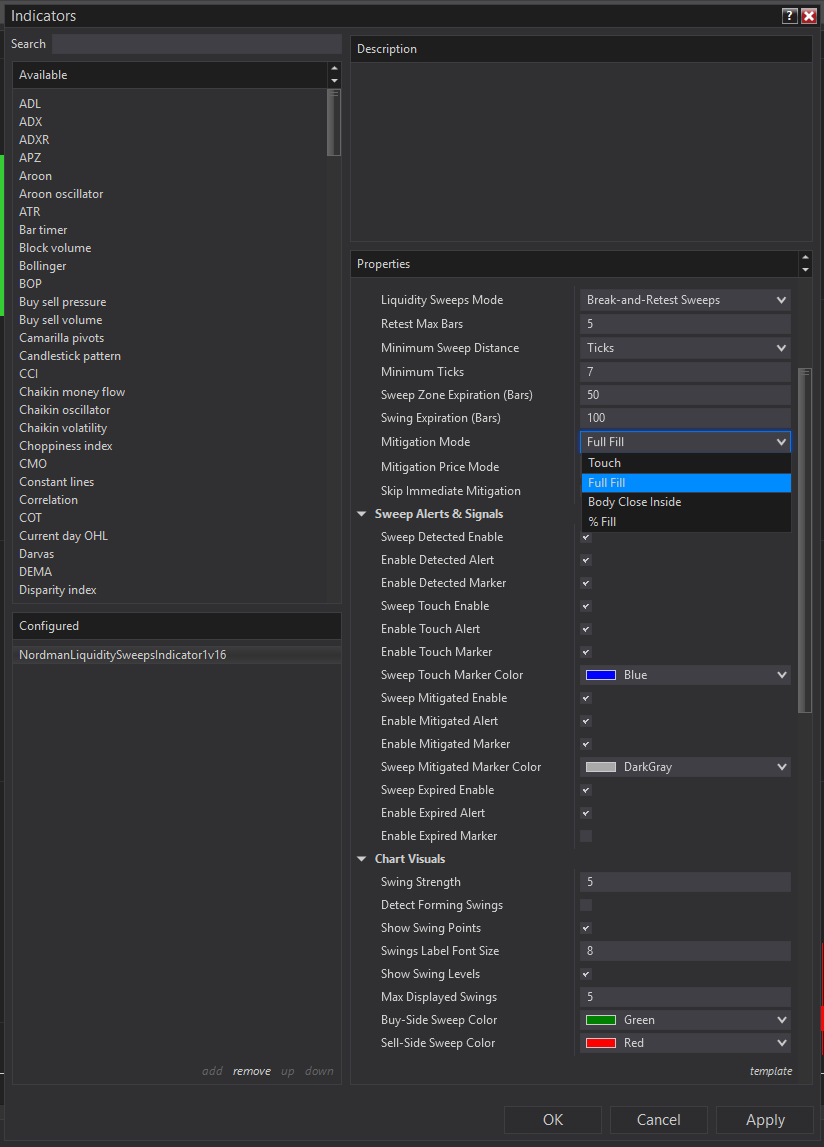
Combined mode detects both. The setting that governs the second type is Retest Max Bars: how long the tool waits for the return before it stops calling it a sweep. Without that limit, everything becomes a sweep eventually, because price comes back to almost every level given enough time.
A sweep leaves a zone behind. The next question is what counts as price coming back to it. There’s no universal answer, so it has to be a setting too. Our indicator offers four:
Body Close Inside is the strictest and Touch is the loosest. If you run Touch and find the zones unreliable, you’ve picked the loosest definition there is. It will trigger often, and that’s what it’s designed to do.
There’s also Skip Immediate Mitigation (Bars), which ignores the first few bars after the sweep. It exists because the very next bar often pokes back into its own zone. Counting that as mitigation ruins the read.
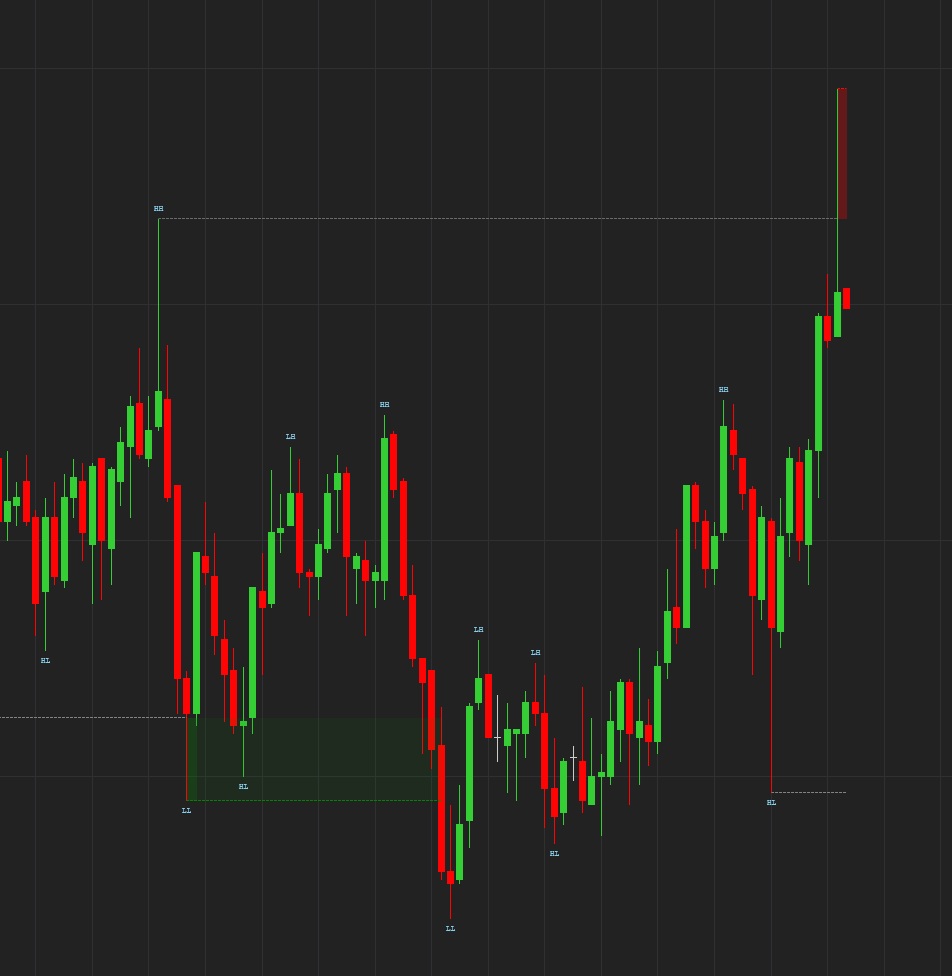
A sweep on its own is a detected event. It tells you the orders beyond a level were taken and the move didn’t hold. It doesn’t tell you direction, and you shouldn’t ask it to.
The meaning comes from two places. The first is market structure. A sweep followed by a break of structure the other way is a different situation from a sweep followed by continuation. Our NinjaTrader Market Structure (BOS & CHOCH) Indicator marks that side.
The second is order flow at the level. Was the push into the swept level absorbed by someone, or did it simply run out of buyers? That’s a question about volume at each price, not about the wick. The NinjaTrader FootPrint OrderFlow Indicator is where you check it.
One more setting belongs here. Swing Expiration limits how many bars can pass between a swing forming and the sweep. A swing high from 400 bars ago being taken today is not the same event for you as one from 20 bars ago. Treating them the same is a common source of bad zones.
The five steps above are rules. Here is what they look like on a chart you could have traded, with two of our indicators running on it together.
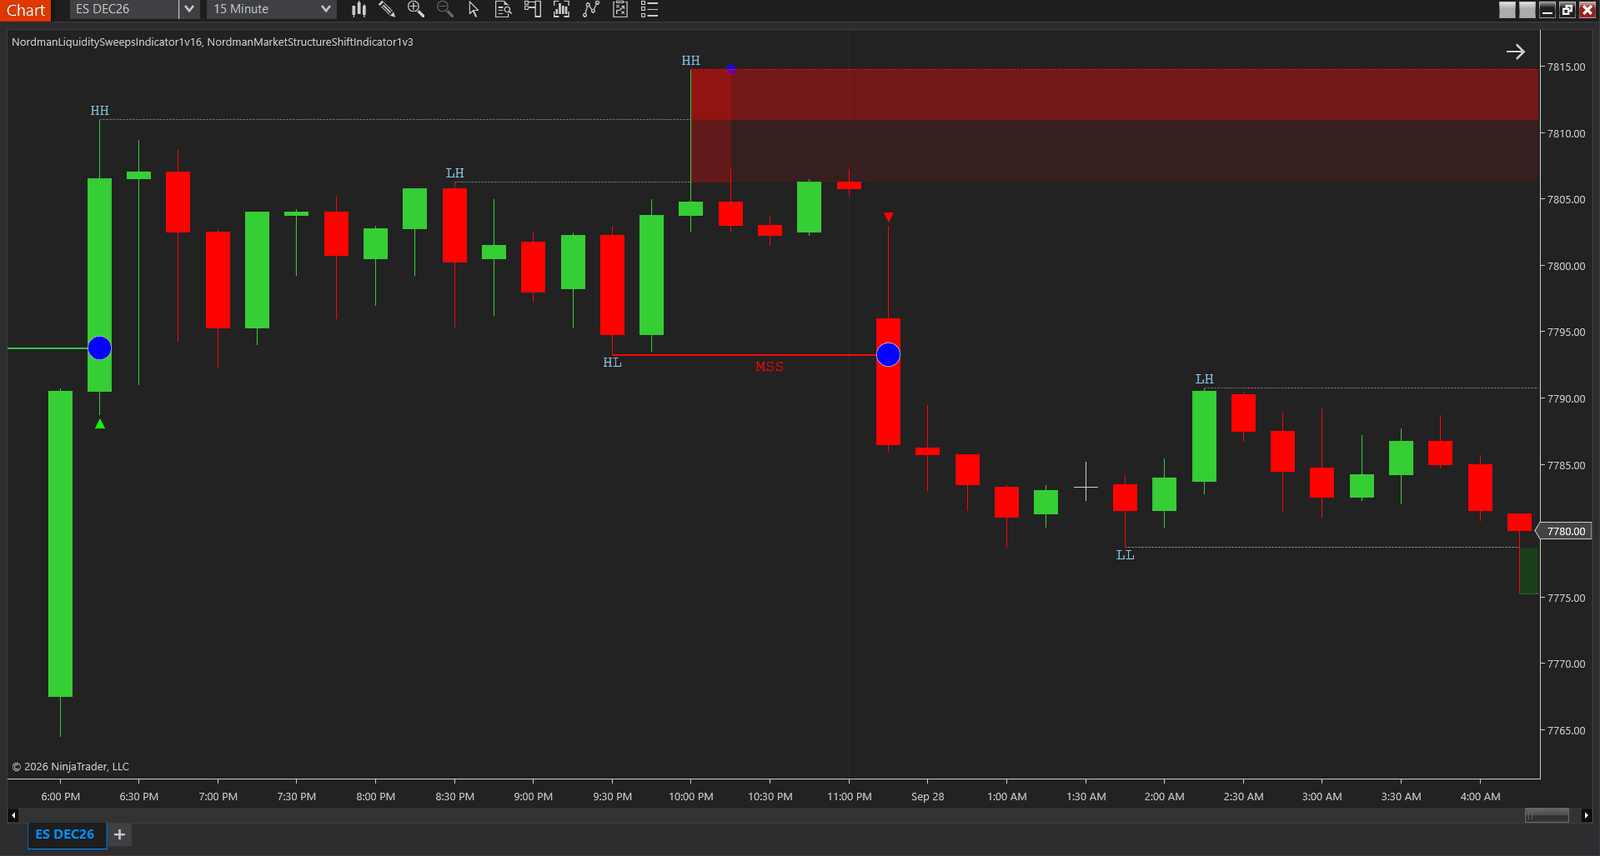
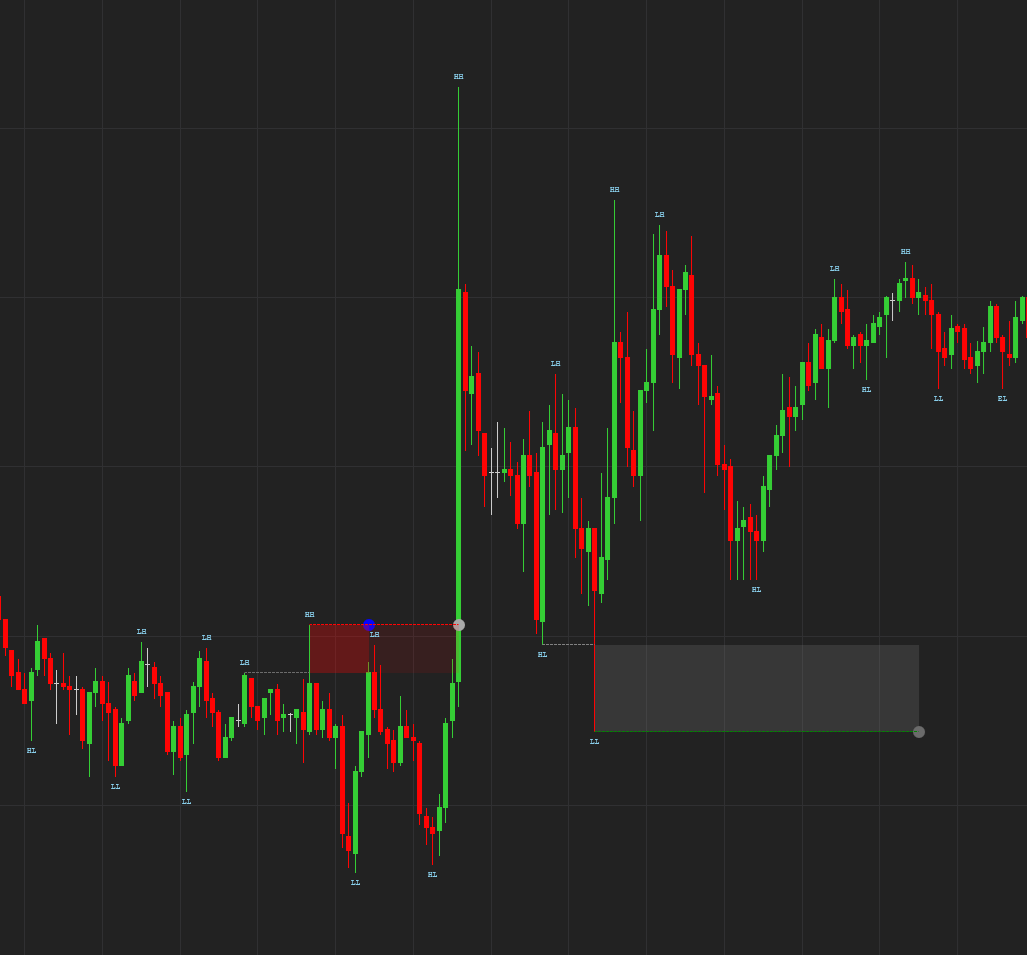
This is ES on a 15-minute chart, through the night session into 28 September. The prices below are read off the chart’s own axis, so you can check every one of them against the image. Follow it left to right.
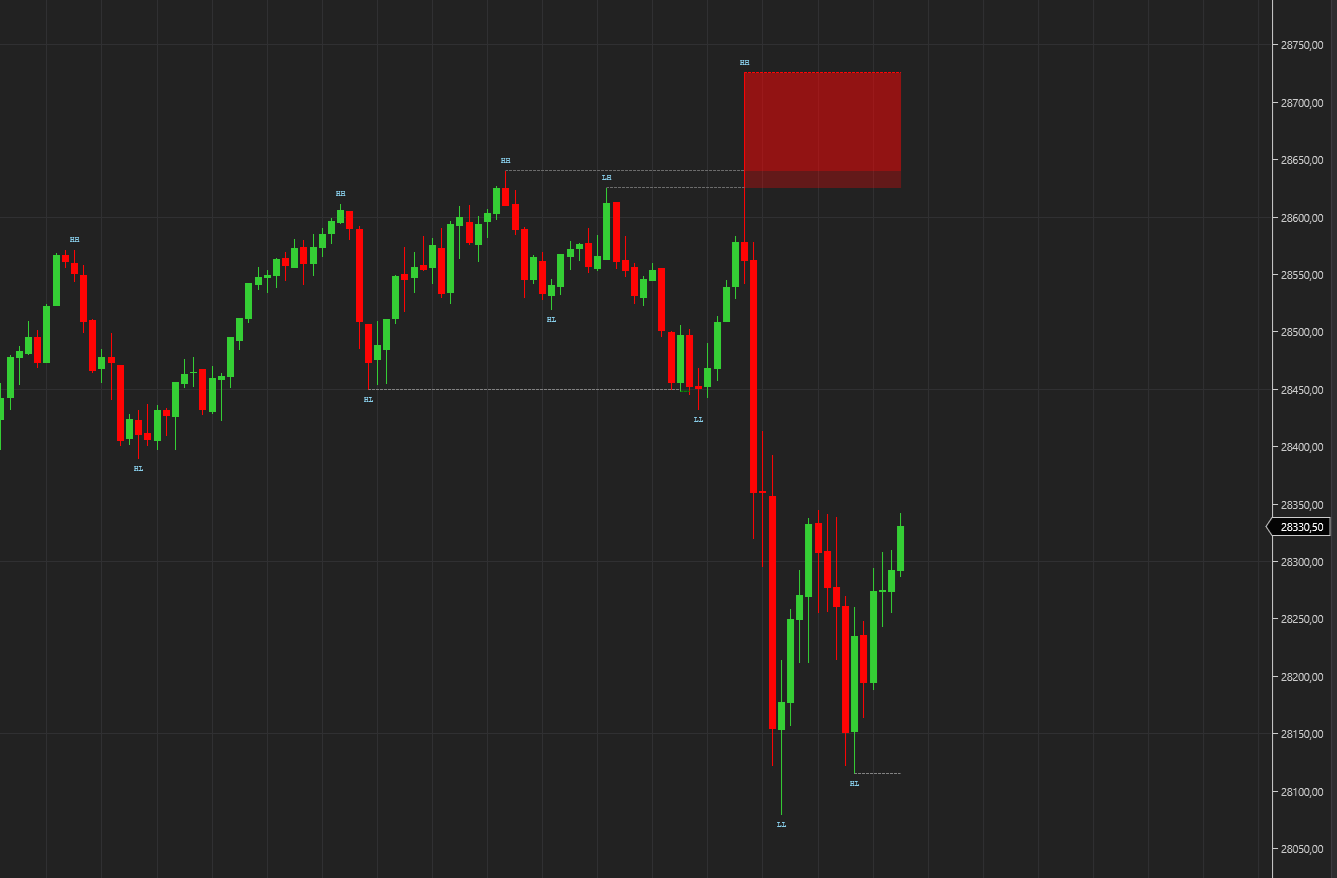
Late in the evening price builds a swing high just under 7815, marked HH. That high is now buy-side liquidity. Your stop, if you were short, sits up there with everyone else’s, next to the entries of breakout buyers. The sweep detector draws the range above that high as a zone, the red box on the right of the chart.
Then comes the part that decides everything for you. Price does not hold up there. It falls back into the range, and the next large bar cuts straight through the swing low near 7795, the one marked HL. That break is the second indicator’s job. The red line labelled MSS is a Market Structure Shift: the moment the run of higher lows stops holding. From there price works down to around 7775 and stays there for the rest of your session.
Now look at what each tool did and didn’t tell you, because that is where most of the value is.
The sweep told you where the orders were and that the push above them failed. On its own that was not a direction. Sitting at the right edge of the box, you still didn’t know whether price would drift sideways, take the zone properly on the second try, or roll over. Every swept high looks obvious once the fall has happened.
The structure shift is what turned the observation into a condition you can act on. Buyers had defended 7795 all evening. When that low went, everyone who bought the failed push above 7815 was offside, and the level they were defending sat behind them.
That is the sequence worth waiting for: liquidity taken, then structure broken against the side that took it. A sweep with no structure break after it is a wick and a story, and you can leave it alone. On this chart your two events sit about an hour apart, and the second one is where your own entry rules, stop and target start.
One naming note, because you will see the two mixed up constantly. A break of structure confirms the move that is already running: higher highs keep printing in an uptrend. A market structure shift is the first break against it. After a sweep you are watching for the second kind, and on this chart there was no break of structure to find, only the shift.
Try it on your own instrument. Take last week’s sharpest reversal and check the order of events: did a swing low break before the move ran, or only after you’d have entered?
| What you see | Likely reading | What it doesn’t mean | What cancels it |
|---|---|---|---|
| Long wick past the swing, small body, close back inside within 1 to 3 bars | Wick-based sweep | That the move reverses from here | The next bars hold above the level |
| Break past the level, a few bars of holding, then a return through it | Break-and-retest sweep | That the breakout was fake from the start | The return comes after your retest bar limit |
| Penetration smaller than your distance filter | Noise or spread | A sweep with a small reaction | Nothing, because it was never a sweep |
| Price closes and holds beyond the level on rising volume | Genuine breakout | That the liquidity wasn’t taken | A fast return through the level |
| Sweep, then a break of structure the other way | Sweep followed by a structural shift | A direction signal on its own | The structure break fails and the old structure resumes |
| Zone touched one bar after the sweep | Premature touch | That the zone is mitigated | Nothing. This is what Skip Immediate Mitigation is for |
| Four sweeps marked in one session | Your settings are too loose | Four institutional events | Compare with the research: the dramatic version is rare |
Put everything above together and the uncomfortable conclusion is this. Nobody needs to hunt you. The clustering does the work.
Your stop ends up just past the obvious level because you place it by the same rule as everyone else. Put it past the high and give it a little room. The rule isn’t secret, and it doesn’t need to be. A trader who needs to fill large size has to find someone on the other side. The only place that someone reliably exists in size is where the resting orders are. It isn’t a conspiracy. It’s the only way that order gets filled.
So a liquidity sweep isn’t evidence that someone came for you. It’s evidence that a level held enough resting orders to be worth reaching, and that the move didn’t survive past them.
Then there’s the frequency problem, and it’s the one you can check yourself. The research puts the dramatic cascades at about once a week. Most charts running default sweep detection mark several per session. Both can’t be describing the same thing.
The difference is in the definition, not in the market. What one trader calls a sweep, another calls the spread. What one tool marks as mitigated, another calls a premature touch. Change the swing strength, the minimum distance, the retest window or the mitigation rule, and the same chart gives you a completely different set of events.
Here’s a quick check you can do today. Open yesterday’s session on your main instrument and count the sweeps your chart marked. Is it more than two? Then your settings are finding spread, not liquidity. Fix the definition and keep it fixed long enough that last month’s sweeps are comparable to today’s.
The NinjaTrader Liquidity Sweeps Indicator detects confirmed sweeps around swing highs and lows, where price moves past a key level and fails to hold there. It marks the sweep events and zones on your chart. Every judgement call from Steps 1 to 5 is a setting you can see and change, not something hidden in the code.
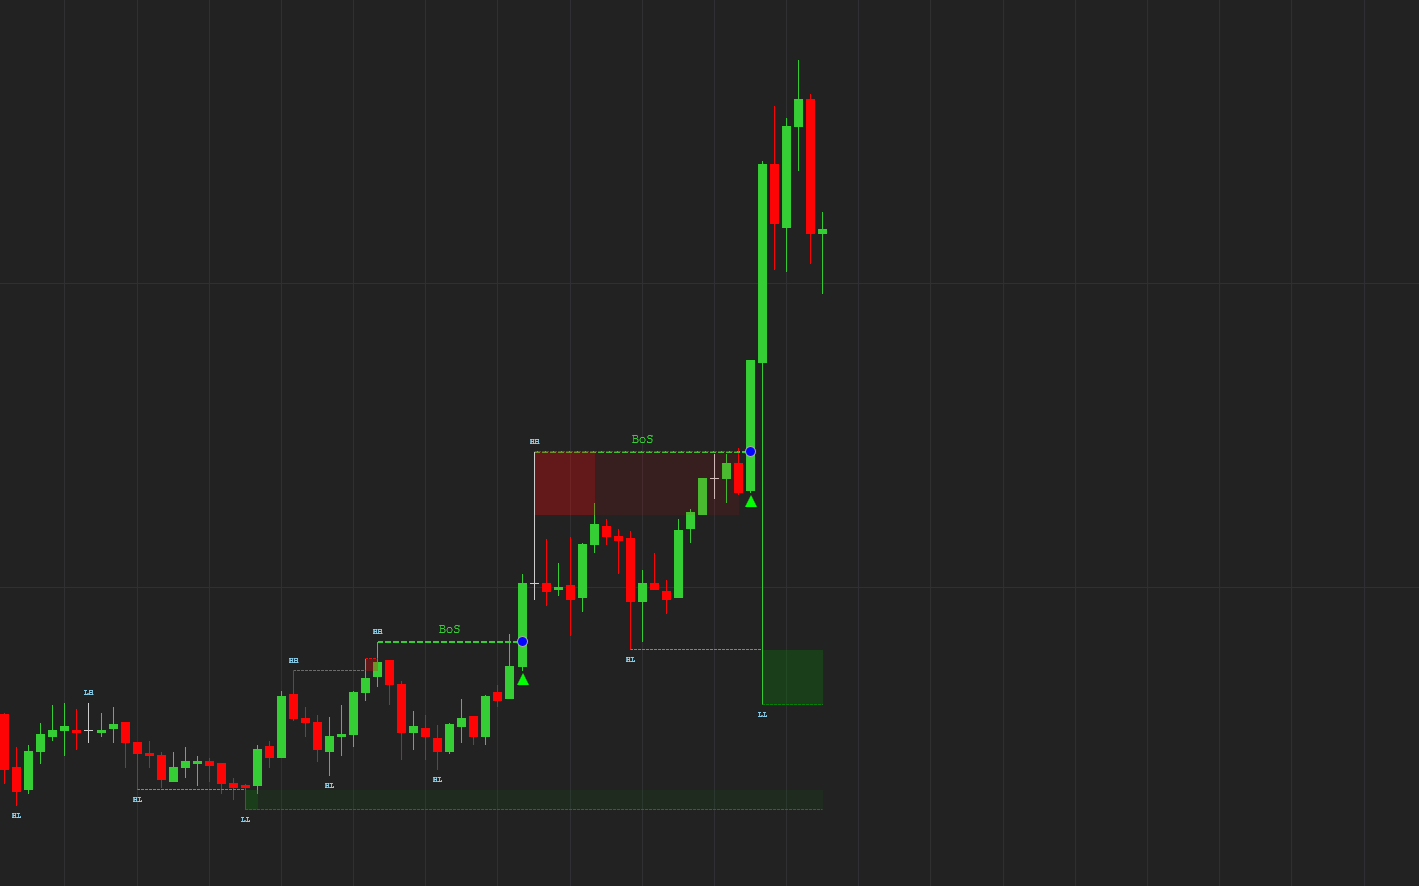
The plot names are technical identifiers for software integration. They are not trading advice or signals. If you’d like to see it running first, there’s an overview video and a short clip on sweep versus breakout. Trading MT5 instead? The MT5 Liquidity Sweeps Indicator is built on the same idea.
It’s included in the subscription that covers every Nordman indicator and copier, €25 a month with the first five days free. Or you can buy this one indicator outright: €175, one PC, no renewal.
This is for you if you trade futures or index instruments intraday and already read market structure. You want failed breakouts marked by a rule instead of spotted in hindsight. You want sweep zones tracked with a clear mitigation rule and an expiry, so old zones stop piling up on the chart. And if you build automated strategies, you get sweep and mitigation states as plots to read.
It isn’t for you if you want the marker to tell you which way price goes next. A sweep is an event about liquidity, not a forecast. It won’t help much on thin instruments where a swing high holds three contracts, because there was never meaningful size resting there to take. And it isn’t for you if you’ll retune swing strength after every losing session. That produces a chart that agrees with you and teaches you nothing.
Before you change any setting, count yesterday’s marked sweeps. That number tells you whether your problem is the market or the definition.
See the Liquidity Sweeps Indicator →
Need sweep detection wired into your own NinjaScript strategy? We build that to order → NinjaTrader developers
Nordman Algorithms provides software infrastructure for trade automation and does not offer financial advice, trading signals, or managed trading services. Visual markers are produced when predefined mathematical conditions are met and do not constitute a recommendation to buy, sell, or hold any instrument. This article is for informational and educational purposes only. Chart screenshots illustrate indicator behaviour on historical data and are not a record of trading results. Forum quotations are reproduced verbatim from public threads for illustration and do not constitute endorsement. Trading leveraged instruments such as Forex, CFDs and futures carries a high level of risk and may not be suitable for all investors. Only risk capital should be used. Full Risk Disclosure: https://www.nordman-algorithms.com/risk-disclosure/