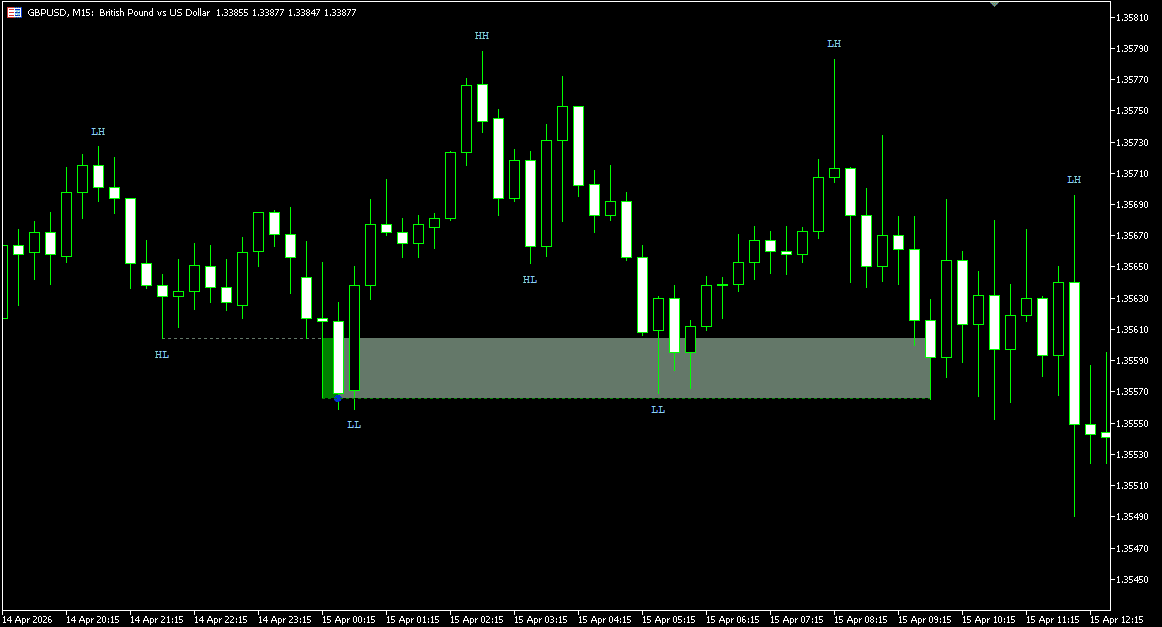
Liquidity Sweeps Concept Explained
Liquidity sweeps occur when price moves beyond previous swing highs or lows where stop orders and resting liquidity are commonly concentrated.
In ICT and Smart Money Concepts (SMC) methodologies, swing highs often represent buy-side liquidity, while swing lows represent sell-side liquidity. When price reaches these areas, it may briefly trade beyond the level before reversing — interacting with the resting orders concentrated there.
These events can appear in different market contexts: as part of a reversal, a continuation move, or a displacement phase. Rather than assigning fixed directional meaning to every sweep, the indicator focuses on identifying the structural behavior itself — where price went, how far it moved, and whether it returned.
Not every move beyond a swing high or low qualifies as a liquidity sweep. Sweep structure depends on how the swing was formed, how far price penetrated beyond the level, and how quickly it returned. A brief wick through a level and a sustained break that later retraces carry different structural characteristics — and the indicator treats them differently.
To keep the detection precise, the indicator includes configurable swing validation, minimum sweep distance filtering, mitigation logic, and sweep lifecycle tracking.
MT5 Liquidity Sweeps Indicator — Key Features
Liquidity Sweep Detection Modes
The indicator supports three sweep detection modes: Wick-Based Sweeps, Break-and-Retest Sweeps, and Combined Mode.
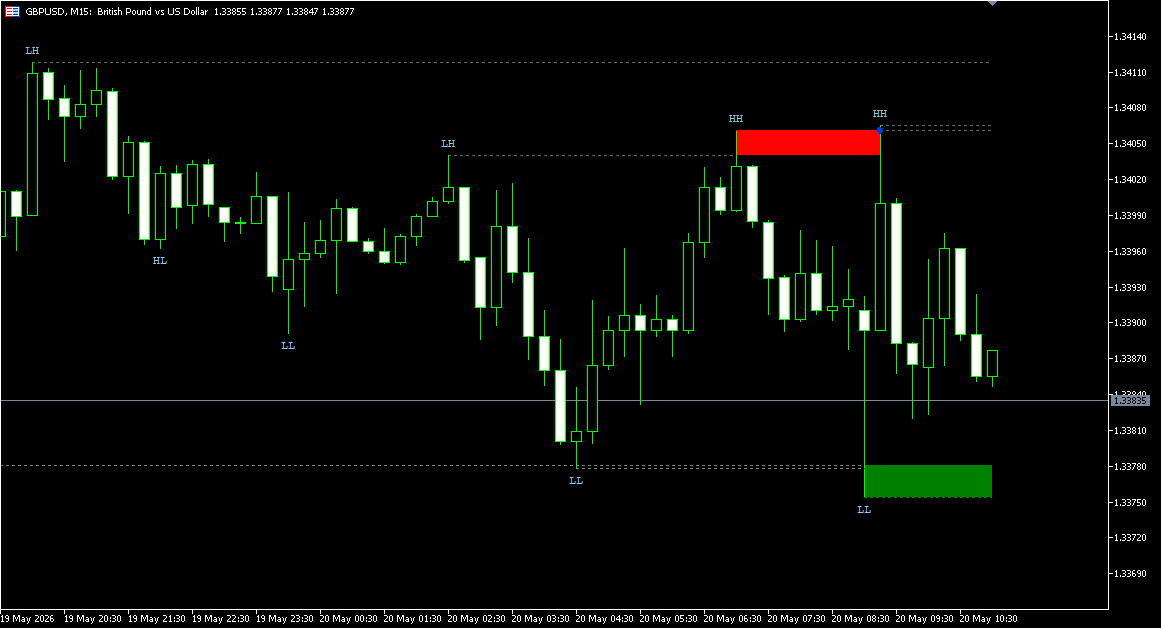
Wick-Based Sweeps focus on immediate rejection after price moves through a liquidity level. The sweep zone forms when price briefly pushes beyond a previous swing high or low and then returns back through the level.
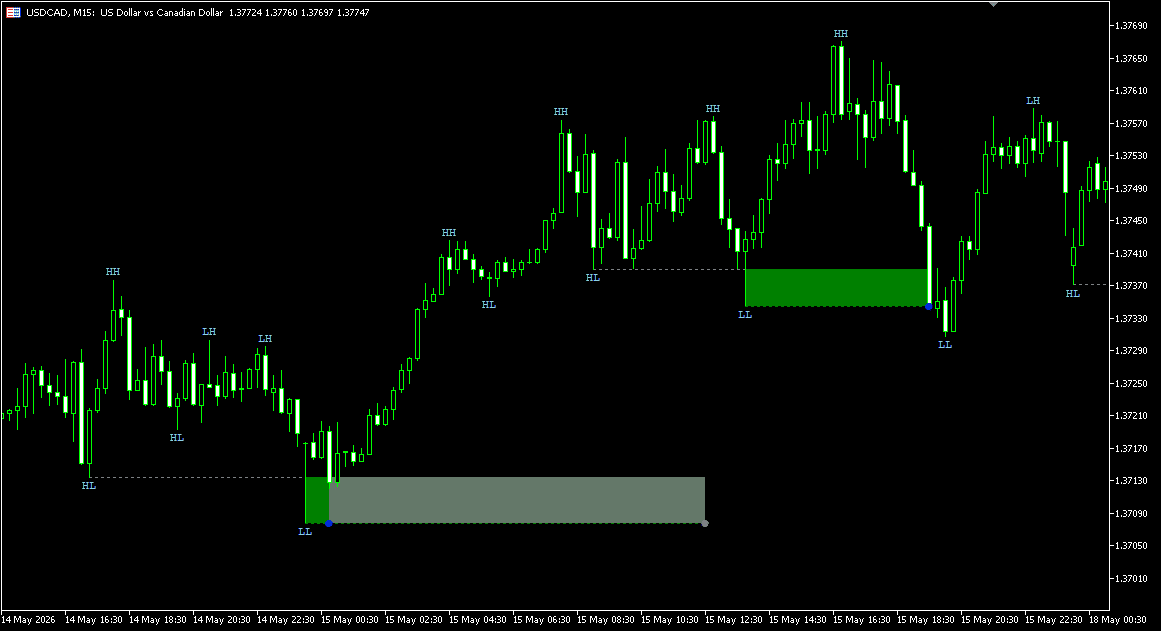
Break-and-Retest Sweeps use delayed directional sweep behavior. Price first breaks a liquidity level, returns back through it, and forms a sweep zone based on the displacement structure. If price later revisits that zone within the allowed retest window, the interaction is registered as a sweep event.
Combined Mode allows both detection models to operate simultaneously.
The detection engine also includes configurable minimum sweep distance filtering. Sweeps can be validated using tick-based or percentage-based displacement requirements, helping filter out low-displacement liquidity interactions.
|
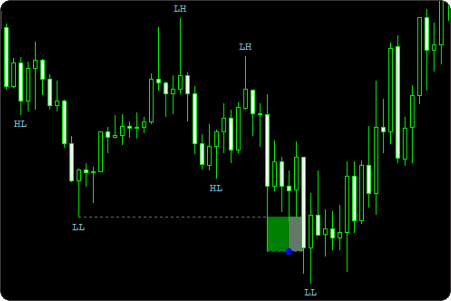
Wick-Based Sweeps
|
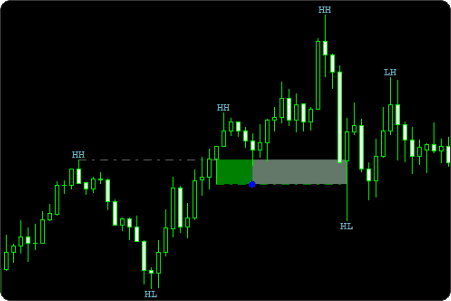
Break-and-Retest Sweeps
|
Swing-Based Liquidity Levels
Liquidity sweep detection is built around swing structure analysis rather than fixed candle patterns.
The indicator automatically identifies swing highs and swing lows that can act as potential liquidity levels. These levels are then monitored for sweep interactions and directional liquidity events.
Structural swing labels are also supported directly on the chart.
Horizontal swing levels can remain visible after formation, making it easier to track where liquidity may still be resting.
Swing sensitivity is controlled through the Swing Strength parameter. Higher values create stricter structural validation, while lower values react faster to developing market movement.
The indicator also includes Swing Expiration logic, limiting how far apart swing structures can be while still qualifying for sweep detection.
Sweep Zone Lifecycle Management
The indicator tracks the lifecycle state of every sweep zone after detection.
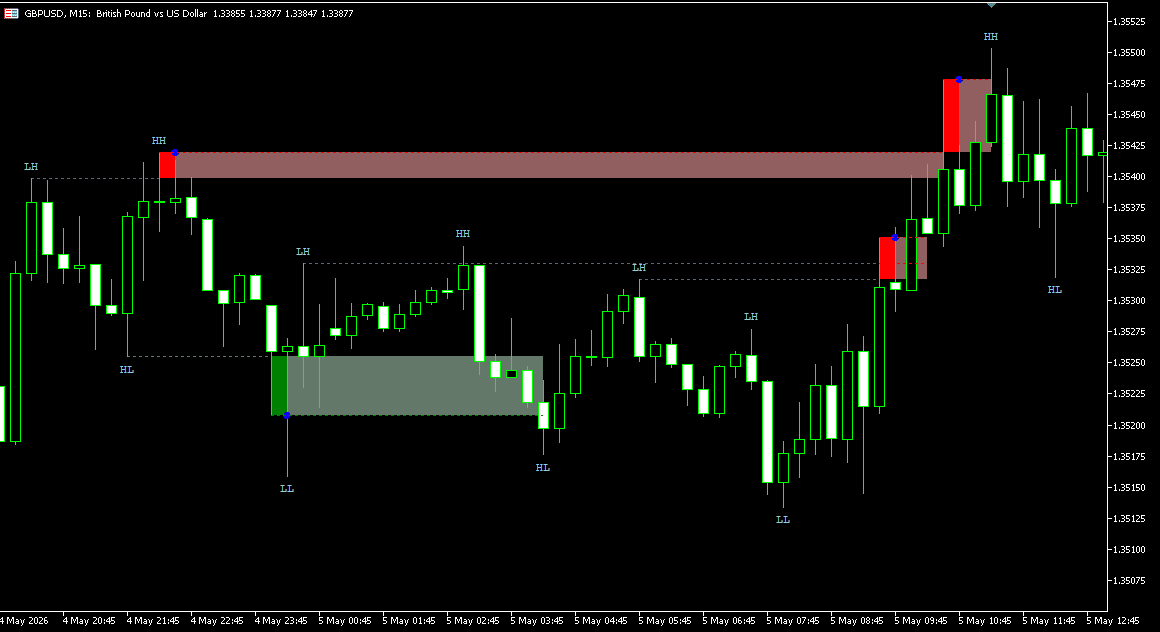
Sweep zones can transition through multiple states: Detected, Touched, Mitigated, and Expired.
A touch event occurs when price re-enters the sweep zone before mitigation conditions have been satisfied.
Mitigation and expiration are tracked independently, allowing active, mitigated, and expired sweep zones to be visually separated on the chart.
Expired and mitigated zones can remain visible as historical liquidity references rather than disappearing immediately after state transition.
The Sweep Zone Expiration setting controls how long sweep zones remain active before becoming expired.
Mitigation Mode & Reaction Control
The indicator supports multiple mitigation models for sweep zone interaction tracking: Touch (High/Low), Full Fill (High/Low), Body Close Inside (Close), and % Fill (High/Low or Close).
Touch mode considers the zone mitigated as soon as price interacts with the sweep area. Full Fill requires complete zone coverage before mitigation is registered.
Body Close Inside uses candle close confirmation instead of wick extremes.
% Fill mode requires price to mitigate a configurable percentage of the sweep zone depth.
The indicator also includes Skip Immediate Mitigation logic. This prevents newly created sweep zones from being mitigated too quickly during immediate post-sweep volatility. Mitigation Skip Bars controls how many bars are ignored before mitigation tracking becomes active.
|
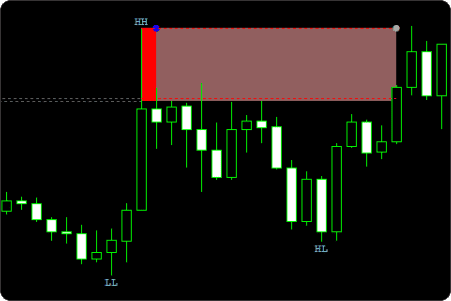
Body Close Inside (Close)
|
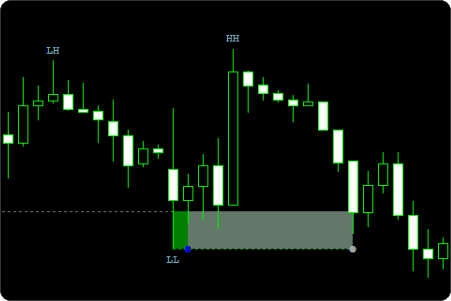
% Fill (High/Low or Close)
|
|
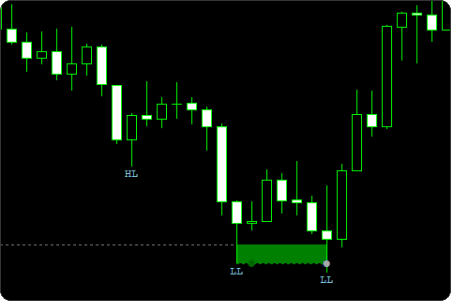
Touch (High/Low)
|
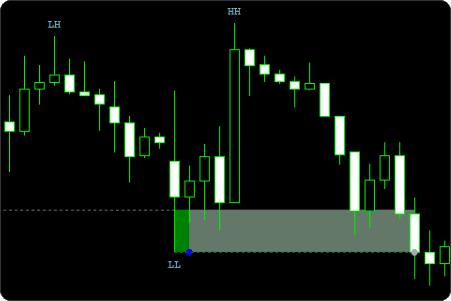
Full Fill (High/Low)
|
Alerts & Event Signals
The indicator supports alert and signal events for every major sweep lifecycle stage: Sweep Detected, Sweep Touch, Sweep Mitigated, and Sweep Expired.
Touch events are tracked independently from mitigation events, allowing sweep interaction and full mitigation to be monitored separately.
Available alert types include popup alerts, sound alerts, and email notifications.
Buy-side and sell-side sweep markers can also be displayed directly on the chart for visual event confirmation.
Active sweep zones, touched zones, mitigated zones, and expired zones remain visually distinguishable during market replay and live analysis.
Run it quietly, or use it as an active liquidity monitoring tool.
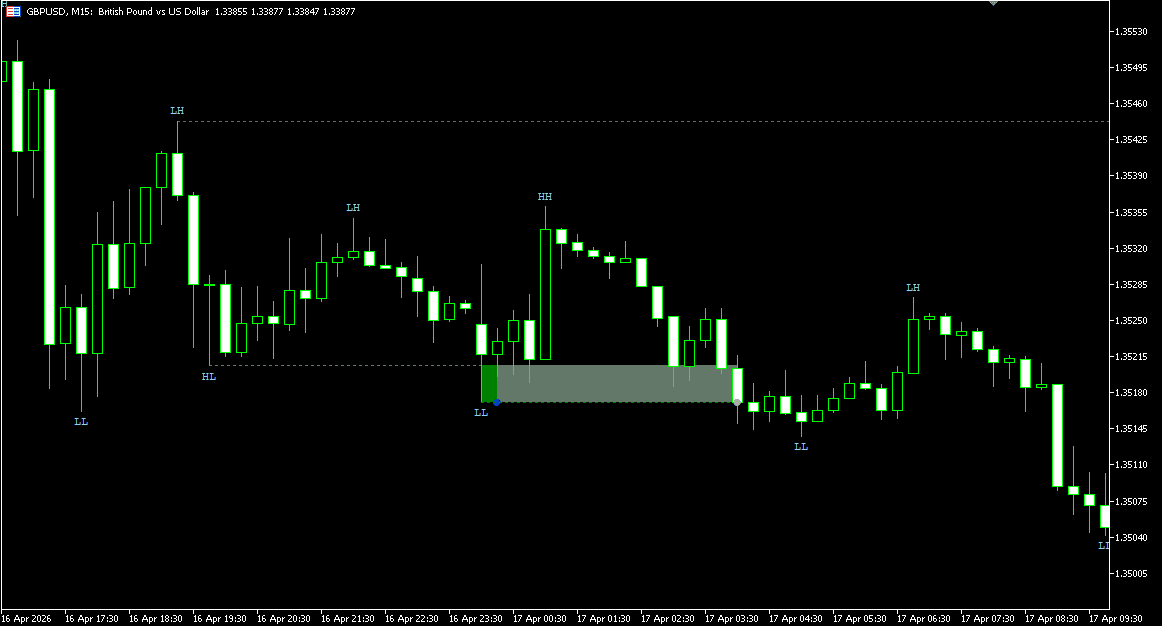
Chart Visualization & Sweep Levels
The indicator includes multiple visualization tools for monitoring liquidity structure directly on the chart.
Swing highs and lows can be extended as horizontal liquidity levels, allowing previous liquidity areas to remain visible after the original swing forms.
Sweep zones are displayed directly on the chart using separate bullish and bearish visual states.
Buy-side and sell-side sweep markers use independent color settings for faster visual recognition during live analysis.
Historical sweep zones can remain visible after mitigation or expiration, preserving previous liquidity reactions and structural context.
How to Interpret and Use the MT5 Liquidity Sweeps Indicator
Reading Wick-Based Sweeps
Wick-Based Sweeps focus on immediate rejection after liquidity interaction.
A bearish sweep forms when price moves above a previous swing high and quickly returns back below the level. A bullish sweep follows the same logic on swing lows.
These reactions often appear around short-term liquidity grabs where price briefly trades beyond resting liquidity before reversing back through the level.
Understanding Break-and-Retest Sweeps
Break-and-Retest Sweeps use delayed directional sweep behavior.
Price first breaks through a liquidity level, then returns back through it and forms a sweep zone based on the displacement structure. If price later revisits that zone within the configured retest window, the interaction is registered as a sweep event.
Unlike Wick-Based Sweeps, the reaction does not need to happen immediately after the initial liquidity break.
Using Combined Mode
Combined Mode allows Wick-Based and Break-and-Retest sweep detection to operate simultaneously.
This makes it possible to track both immediate liquidity rejection and delayed sweep structures within the same workflow.
Interpreting Sweep Lifecycle States
Each sweep zone can transition through multiple structural states: Detected, Touched, Mitigated, and Expired.
Touch events represent the first return into the sweep zone before mitigation conditions have been satisfied.
Mitigated zones represent completed interaction based on the selected mitigation model.
Expired zones indicate that price failed to revisit or mitigate the sweep within the configured expiration period.
Using Swing Levels as Liquidity References
Swing highs and lows are used as the primary liquidity reference points for sweep detection.
Previous swing levels can remain extended on the chart after formation, making it easier to monitor where liquidity may still be resting.
Higher swing sensitivity produces stricter structural validation, while lower sensitivity reacts faster to developing market movement.
Indicator Settings & Parameters
Alerts
- Enable Pop Up Alert — Displays an on-screen popup when a sweep event alert is triggered.
- Enable Sound Alert — Plays an audio notification for supported sweep events.
- Alert Sound File — Selects the sound file used for audio alerts.
- Enable Email Alert — Sends email notifications when supported sweep events occur. Requires MetaTrader email settings to be configured.
- Email To — Defines the recipient email address for alert notifications.
General
- History Bars To Process — Defines how many historical bars are used for sweep detection calculations.
- Liquidity Sweeps Mode — Selects the sweep detection model: Wick-Based Sweeps, Break-and-Retest Sweeps, or Combined Mode.
- Swing Strength — Controls how strictly swing highs and lows are validated before qualifying as liquidity levels. Higher values create stricter structure. Lower values react faster to developing price movement.
- Minimum Sweep Distance Mode — Defines how minimum sweep penetration is measured: Ticks or Percentage.
- Minimum Sweep Distance Ticks — Defines the minimum sweep penetration distance when tick-based validation is used.
- Minimum Sweep Distance Percentage — Defines the minimum sweep penetration distance when percentage-based validation is used.
- Retest Max Bars — Defines the maximum number of bars allowed for retest validation in Break-and-Retest sweep mode.
- Sweep Zone Expiration (Bars) — Defines how long sweep zones remain active before transitioning into expired states.
- Swing Expiration (Bars) — Defines the maximum allowed distance between swing structures used for sweep detection. Older swing levels outside this range are ignored.
Mitigation
Mitigation Mode
Defines how price must interact with a sweep zone for mitigation to be registered.
- Touch — zone is mitigated as soon as price High or Low interacts with the sweep area
- Full Fill — price High or Low must fully cover the entire zone before mitigation is registered
- Body Close Inside — mitigation requires a candle to close inside the zone rather than simply touching it with a wick
- % Fill — a configurable percentage of the zone depth must be filled, validated using either High/Low prices or candle Close depending on the selected Mitigation Price Mode
- Mitigation Price Mode — Defines whether mitigation validation uses High/Low or Close prices.
- Mitigation % — Defines the required percentage of zone fill when percentage-based mitigation mode is used.
- Skip Immediate Mitigation — Prevents newly created sweep zones from being mitigated too quickly immediately after detection.
- Mitigation Skip Bars — Defines how many bars are ignored before mitigation tracking becomes active.
Sweep Alerts & Signals
- Enable Sweep Detected Alert — Triggers an alert when a new sweep zone is detected.
- Enable Sweep Touch Alert — Triggers an alert when price re-enters a sweep zone before mitigation.
- Enable Sweep Mitigated Alert — Triggers an alert when a sweep zone becomes mitigated.
- Enable Sweep Expired Alert — Triggers an alert when a sweep zone expires.
- Enable Sweep Detected Marker — Displays chart markers for newly detected sweep zones.
- Enable Sweep Touch Marker — Displays chart markers when price touches a sweep zone.
- Enable Sweep Mitigated Marker — Displays chart markers when mitigation occurs.
- Enable Sweep Expired Marker — Displays chart markers when sweep zones expire.
Chart Visuals
- Buy-Side Sweep Color — Defines the color used for bullish sweep markers and sweep zones.
- Sell-Side Sweep Color — Defines the color used for bearish sweep markers and sweep zones.
- Mitigated Sweep Color — Defines the color used for mitigated sweep zones.
- Expired Sweep Color — Defines the color used for expired sweep zones.
- Sweep Zone Opacity — Controls transparency of sweep zone visualization.
- Show Swing Points — Displays swing structure labels directly on the chart.
- Show Swing Levels — Displays horizontal liquidity levels derived from swing highs and lows.
- Max Displayed Swings — Defines the maximum number of swing structures displayed simultaneously on the chart.
Custom Programming
Need changes to this indicator? We can customize it to your specifications — adding new functions, modifying logic, refining visuals, or integrating it with other trading tools.
We also convert indicators into Expert Advisors with advanced features such as trailing stops, position parameter controls, execution filters, and rule-based automation built to your technical specifications.
Request a free consultation to discuss the technical scope, timeline, and available development options.
We Value Your Feedback
We are committed to the ongoing development and refinement of our indicators. If you’ve spotted a bug, feel that something essential is missing, or have ideas that could make the indicator even better, just send us a message. Your feedback helps us improve and deliver tools that truly meet traders’ needs.
FAQ
1. What is a liquidity sweep in trading?
A liquidity sweep occurs when price moves beyond a previous swing high or low where stop orders and resting liquidity are commonly concentrated.
After interacting with that liquidity, price may react around the swept level depending on market conditions.
2. What is the difference between Wick-Based and Break-and-Retest sweeps?
Wick-Based Sweeps focus on immediate rejection after price moves through a liquidity level.
Break-and-Retest Sweeps use delayed sweep behavior. Price first breaks the level, returns back through it, forms a sweep zone, and later revisits that zone within the configured retest window.
The indicator also supports Combined Mode, allowing both sweep models to operate simultaneously.
3. Does the indicator support both bullish and bearish liquidity sweeps?
Yes. The indicator detects both buy-side and sell-side liquidity sweeps.
Bullish and bearish sweep zones, markers, alerts, and lifecycle states are tracked independently.
4. How are liquidity levels identified?
Liquidity levels are built from swing highs and swing lows detected through configurable swing structure analysis.
These swing levels can remain extended on the chart as active liquidity references.
5. What happens when a sweep zone becomes mitigated or expired?
Mitigated zones represent completed interaction based on the selected mitigation model.
Expired zones indicate that price failed to revisit or mitigate the sweep zone within the configured expiration period.
Historical zones can remain visible after mitigation or expiration for structural context and liquidity review.
6. Can historical sweep zones remain visible on the chart?
Yes. The indicator can keep mitigated and expired sweep zones visible instead of removing them immediately.
This helps preserve previous liquidity reactions and historical sweep structure directly on the chart.
7. How does the mitigation logic work?
The indicator supports multiple mitigation models, including:
- Touch (High/Low)
- Full Fill (High/Low)
- Body Close Inside (Close)
- % Fill
Mitigation can be validated using either High/Low prices or candle Close values depending on the selected configuration.
The indicator also supports Skip Immediate Mitigation logic for filtering early post-sweep interactions.
8. How is this Liquidity Sweeps Indicator different from other MT5 sweep indicators?
This indicator combines multiple sweep detection models, configurable mitigation logic, sweep lifecycle tracking, swing-based liquidity analysis, and historical zone management within a single framework.
Key features include:
- Wick-Based Sweeps
- Break-and-Retest Sweeps
- Combined Detection Mode
- Touch / Mitigated / Expired lifecycle states
- Multiple mitigation models
- Historical sweep zone tracking
- Swing-based liquidity levels
- Configurable sweep validation filters
The indicator focuses on structural liquidity sweep analysis rather than isolated sweep marking.
Disclaimer — Software Use & Risk Disclosure
Nordman Algorithms is a trade name of Nordman Algorithms OÜ (Reg. No. 14435535), registered in Tallinn, Estonia.
Software Nature & User Responsibility — Nordman Algorithms provides algorithmic software tools for technical analysis. Nordman Algorithms is not a financial advisor and is not liable for any losses. All trades conducted based on the software’s output are executed at the user’s sole discretion and risk.
Visual Markers & Signal Disclosure — This software may display visual markers (such as arrows, dots, or alerts) when predefined mathematical conditions are met. These markers are provided for educational and analytical purposes only, must not be interpreted as financial guidance, and do not constitute a recommendation to buy, sell, or hold any financial instrument. Users must independently validate all visual cues within their own trading methodology.
No Financial Advice — Nordman Algorithms does not provide discretionary trading signals, investment advice, or managed signal services. Our software represents a mathematical visualization of historical and real-time data. The appearance of a visual marker does not guarantee a profitable trade or predict future market behavior.
Trading Risk Warning — Forex, CFDs, futures, options, and other leveraged financial instruments involve significant risk. Risk capital is money that can be lost without jeopardizing financial security. Only risk capital should be used for trading. Past performance is not indicative of future results. View Full Risk Disclosure: https://www.nordman-algorithms.com/risk-disclosure/
ESMA Risk Warning — Financial instruments, especially those involving leverage such as CFDs and Forex, are complex and carry a high risk of rapid financial loss. Our software provides analytical outputs and visual markers based on predefined mathematical conditions and does not mitigate or reduce inherent market risks. You should carefully consider whether you understand how leveraged financial instruments work and whether you can afford the high risk of losing your capital.
CFTC Rule 4.41 — Hypothetical or simulated performance results have inherent limitations. Unlike actual performance records, simulated results do not represent real trading. Because trades have not actually been executed, these results may under- or over-compensate for the impact of market factors such as liquidity. No representation is being made that any account will achieve profits or losses similar to those shown.