The ICT Kill Zones methodology is one of the most effective approaches for identifying periods of heightened market activity. It is based on the observation that the largest price movements often occur around the opening of major trading sessions. During these times, liquidity flows into the market, the balance between participants shifts, and conditions for impulsive moves are created.
The NinjaTrader Kill Zones Indicator is an analytical tool designed for traders who apply the ICT Kill Zones concept and want to systematically identify the most active periods in the market. The indicator not only highlights standard trading sessions (Asian, London, and New York) but also allows you to create fully customizable time zones with minute-by-minute accuracy, personalized labels, and background colors.
A key feature of this tool is the integration of Kill Zones and Pivots. You can display session Pivot levels, the session midpoint, and the Day Open level. There is also an option to extend Pivot levels until the start of the next equivalent session, which is especially useful for analyzing price action between session periods.
The core purpose of the indicator is to help traders identify the most active and liquid phases of the market, which often coincide with increased volatility and major session openings. This provides a systematic framework for session-based analysis, helping traders monitor volatility shifts and align their observations with key market hours.
In ICT Kill Zones methodology, these active market phases are tied to the openings of the world’s key trading sessions:
The NinjaTrader Kill Zones Indicator automates the application of this methodology, removing the need for constant manual tracking. It highlights these time windows directly on the chart and combines them with price level analysis (Pivots, midpoints, Day Open), so you always know whether the market is in a quiet phase or in an active impulse.
By incorporating Kill Zones into your trading, you gain two main advantages:
The NinjaTrader Kill Zones Indicator stands out with several advanced features specifically designed to meet the most relevant and practical needs of traders using Kill Zones in their trading. These features include:
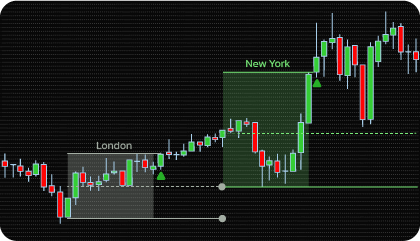
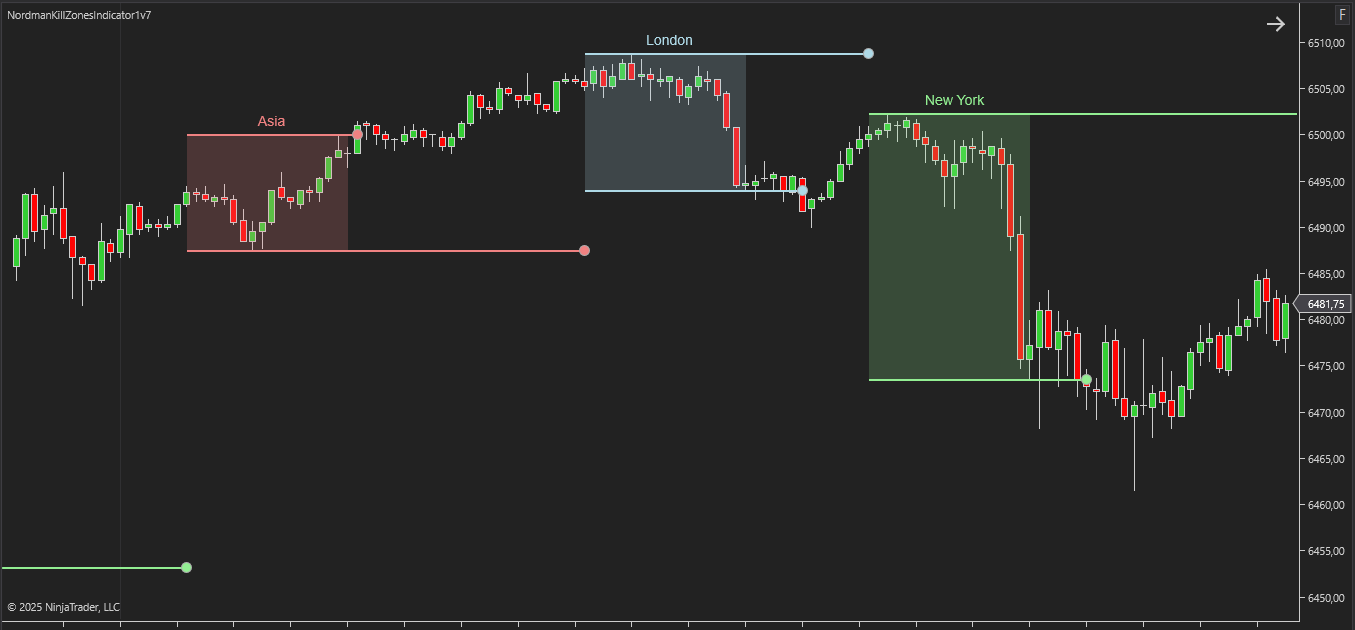
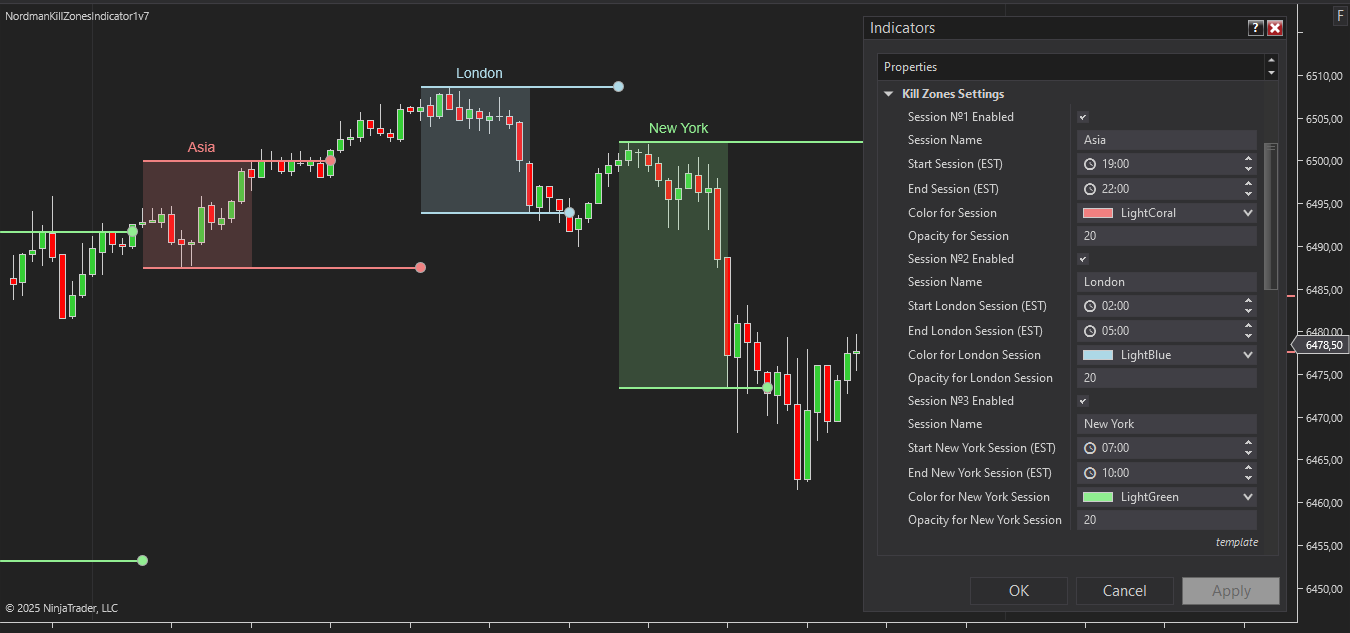
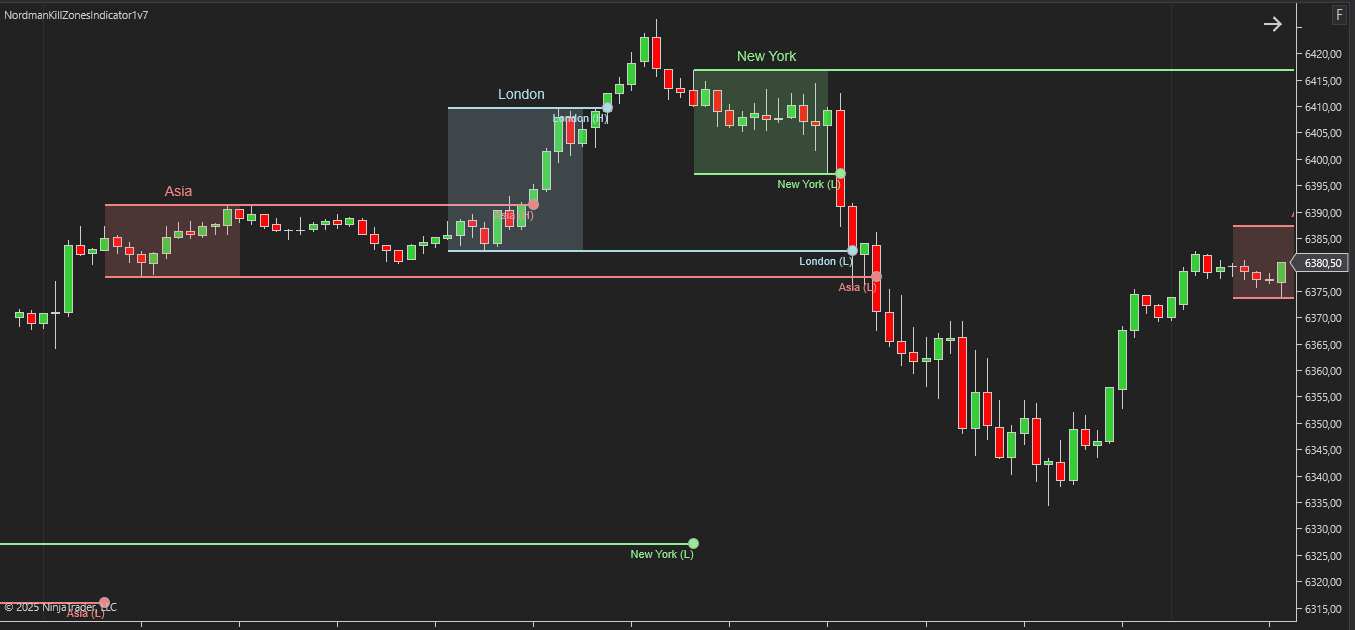
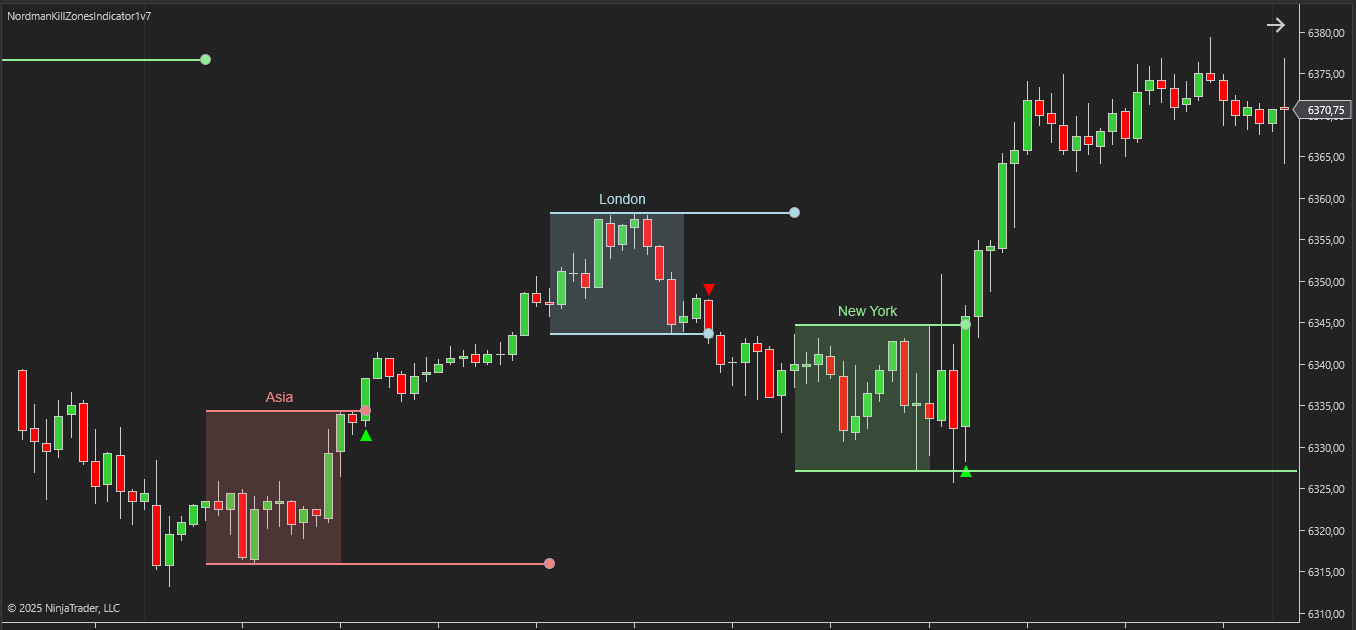
Predefined session mapping allows traders to highlight Asia, London, and New York trading periods directly on the chart, each with its own label, start/end time, and background color, providing clear visual segmentation for time-based strategies.
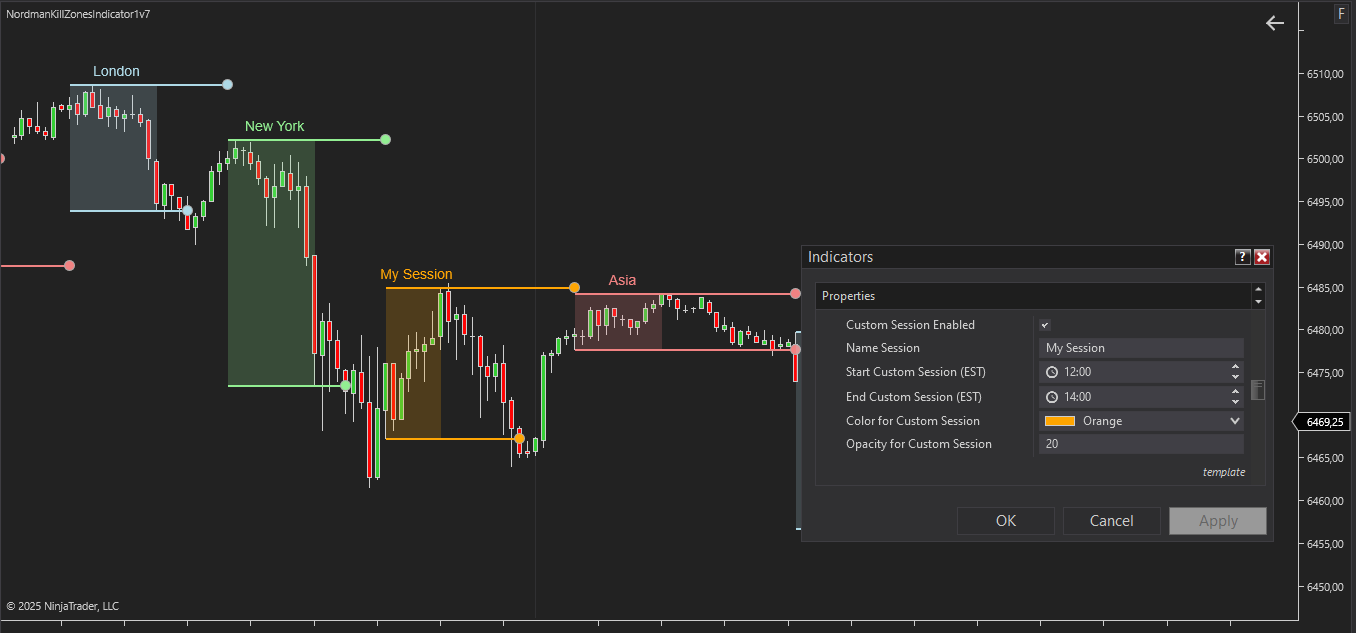
User-defined session blocks let traders create custom time intervals with unique labels, start/end times down to the minute, and personalized background colors. This enables precise focus on market segments beyond standard sessions and makes specialized strategies more accessible and manageable.
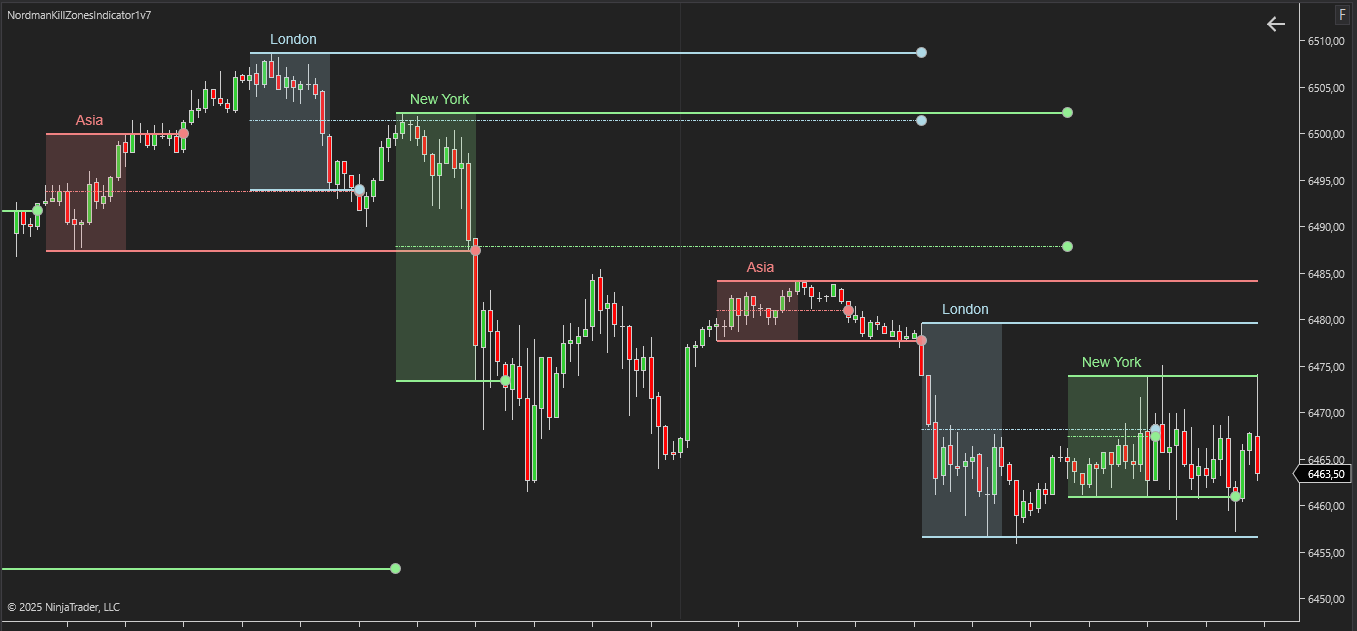
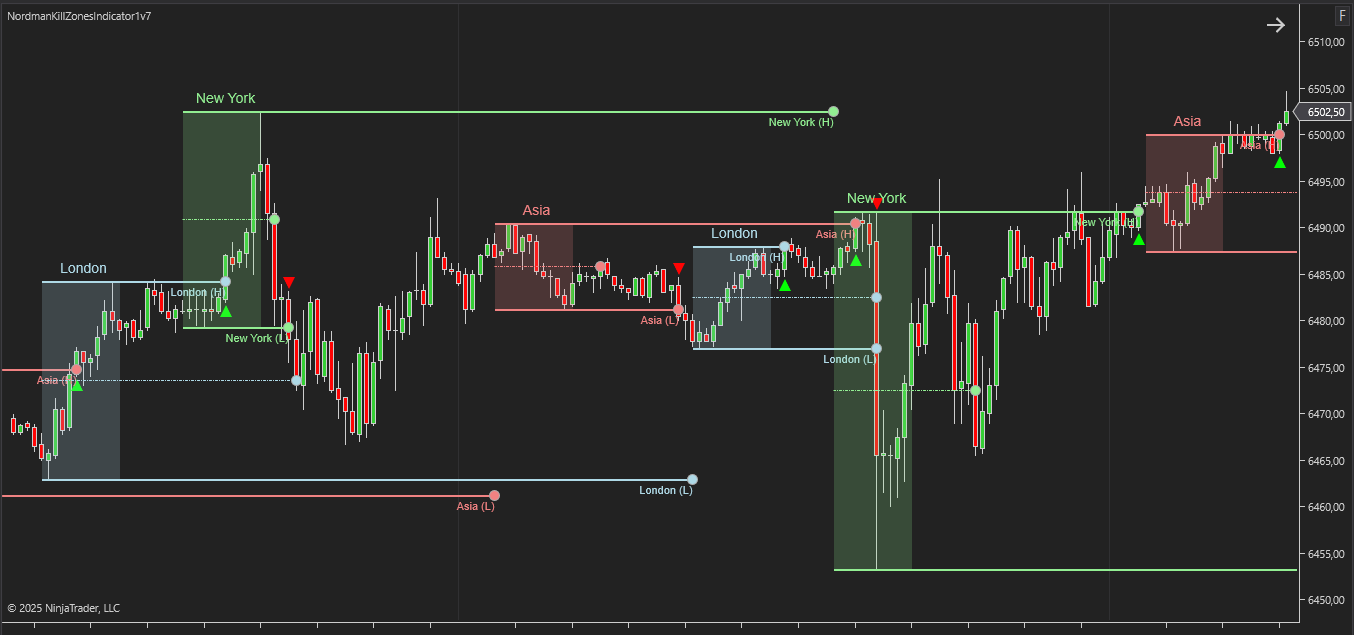
Intraday pivot analytics display horizontal price levels that reflect session highs, lows, and midpoints, along with the day’s opening price. These benchmarks help traders gauge market bias and potential price reaction or movement points.
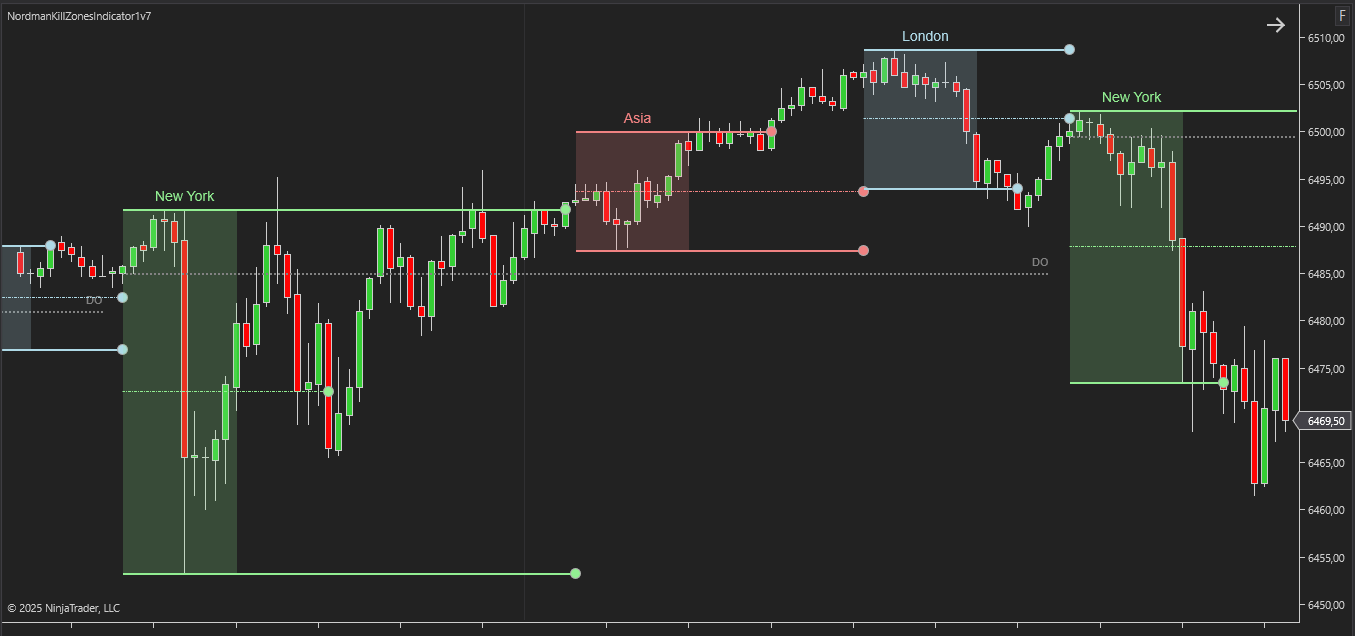
Extends session pivot levels into the next equivalent session, allowing traders to monitor and analyze inter-session price trends and key levels more effectively for improved trade planning and decision-making.
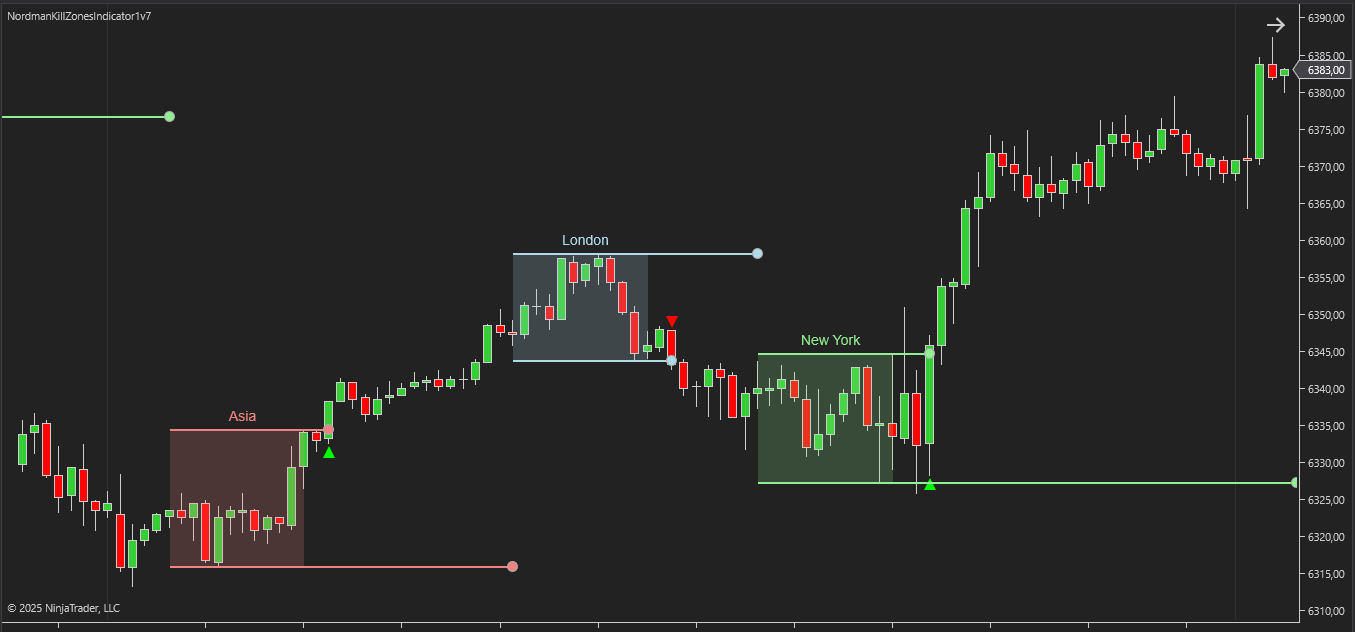
Enables flexible notification settings and the option to show or hide visual markers on the chart, ensuring traders can react promptly to significant activity within Kill Zones. These markers highlight session breakouts, identifying potential areas of structural interest based on time-specific volatility. Additionally, the indicator features exposed analytical plots, allowing session states and breakout events to be integrated directly into automated logic and third-party strategy builders.
The indicator has the following parameters:
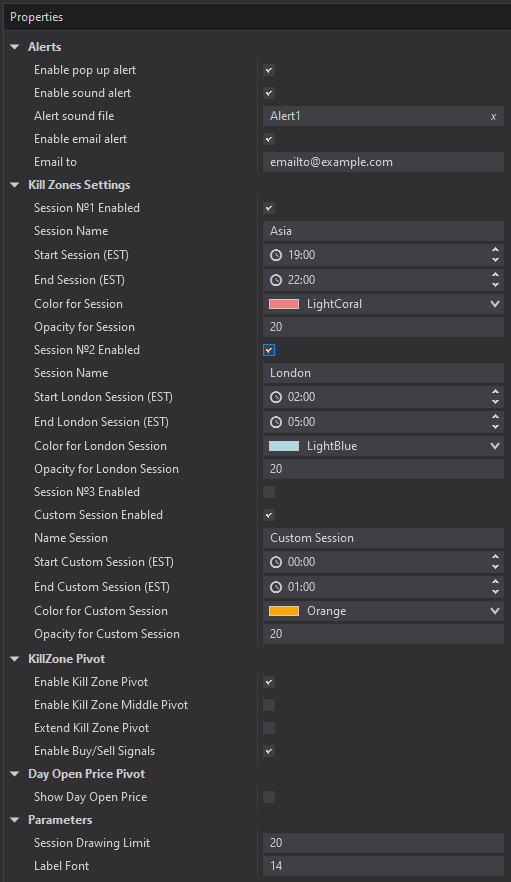
Alerts – Configure various types of alerts.
Session Enabled – toggle the display of the session on the chart on or off.
Name Session – assign a custom name to the session for easy identification.
Start and End Session (EST) – set the precise start and end time of the session down to the minute.
Color for Session – choose the background color for the session zone.
Opacity for Session – adjust the transparency of the session background in percent.
Enable Kill Zone Pivot – toggle the display of session pivots (High and Low) on or off.
Enable Kill Zone Middle Pivot – toggle the display of the midpoint line between the High and Low pivots.
Extend Kill Zone Pivot – extend session pivot lines to the next equivalent session.
Show Pivot Labels – display or hide pivot labels on the chart.
Day Open Price Pivot – show or hide the day’s opening price pivot, with options to customize name, start time, color, and line style.
Session Drawing Limit – define how many past consecutive sessions to display on the chart.
Label Font – adjust the font size for session names and pivot labels for clarity.

We can customize this indicator to your needs — adding functions, modifying logic, or integrating it with other tools for your workflow.
We also convert indicators into Automated Trading Strategies with advanced functions (trailing stops, risk management, filters) tailored to your trading style strictly according to your specifications.
Request a free consultation to discuss the technical scope and timeline of your project.
We are committed to the ongoing development and refinement of our indicators. If you’ve spotted a bug, feel that something essential is missing, or have ideas that could make the indicator even better, just send us a message. Your feedback helps us improve and deliver tools that truly meet traders’ needs.
The indicator provides a set of exposed analytical plot outputs designed for structured integration with third-party strategy builders and automation tools such as BloodHound and BlackBird (SharkIndicators), as well as other algorithmic trading environments.
| Analytical Plot Name | Output Values | Description |
| Zone Start Asia | Value | |
| Zone End Asia | Value | |
| Zone Upper Boundary Asia | Value | |
| Zone Middle Asia | Value | |
| Zone Lower Boundary Asia | Value | |
| Zone Upper Boundary Breakout Asia | Value | |
| Zone Lower Boundary Breakout Asia | Value | |
| Zone Start London | Value | |
| Zone End London | Value | |
| Zone Upper Boundary London | Value | |
| Zone Middle London | Value | |
| Zone Lower Boundary London | Value | |
| Zone Upper Boundary Breakout London | Value | |
| Zone Lower Boundary Breakout London | Value | |
| Zone Start New York | Value | |
| Zone End New York | Value | |
| Zone Upper Boundary New York | Value | |
| Zone Middle New York | Value | |
| Zone Lower Boundary New York | Value | |
| Zone Upper Boundary Breakout New York | Value | |
| Zone Lower Boundary Breakout New York | Value | |
| Zone Start Custom | Value | |
| Zone End Custom | Value | |
| Zone Upper Boundary Custom | Value | |
| Zone Middle Custom | Value | |
| Zone Lower Boundary Custom | Value | |
| Zone Upper Boundary Breakout Custom | Value | |
| Zone Lower Boundary Breakout Custom | Value | |
| Custom Pivot01 | Value | |
| Custom Pivot02 | Value | |
| Custom Pivot03 | Value | |
| Custom Pivot04 | Value | |
| Custom Pivot05 | Value | |
| Custom Pivot06 | Value | |
| Custom Pivot07 | Value | |
| Custom Pivot08 | Value | |
| Custom Pivot09 | Value | |
| Custom Pivot10 | Value |
Nordman Algorithms is a trade name of Nordman Algorithms OÜ (Reg. No. 14435535), registered in Tallinn, Estonia.
Software Nature & User Responsibility — Nordman Algorithms provides algorithmic software tools for technical analysis. Nordman Algorithms is not a financial advisor and is not liable for any losses. All trades conducted based on the software’s output are executed at the user’s sole discretion and risk.
Visual Markers & Signal Disclosure — This software may display visual markers (such as arrows, dots, or alerts) when predefined mathematical conditions are met. These markers are provided for educational and analytical purposes only, must not be interpreted as financial guidance, and do not constitute a recommendation to buy, sell, or hold any financial instrument. Users must independently validate all visual cues within their own trading methodology.
No Financial Advice — Nordman Algorithms does not provide discretionary trading signals, investment advice, or managed signal services. Our software represents a mathematical visualization of historical and real-time data. The appearance of a visual marker does not guarantee a profitable trade or predict future market behavior.
Trading Risk Warning — Futures, Forex, and options trading involve significant risk. Risk capital is money that can be lost without jeopardizing financial security. Only risk capital should be used for trading. Past performance is not indicative of future results. View Full Risk Disclosure: https://www.nordman-algorithms.com/risk-disclosure/
ESMA Risk Warning — Financial instruments, especially those involving leverage such as CFDs and Forex, are complex and carry a high risk of rapid financial loss. Our software provides analytical outputs and visual markers based on predefined mathematical conditions and does not mitigate or reduce inherent market risks. You should carefully consider whether you understand how leveraged financial instruments work and whether you can afford the high risk of losing your capital.
CFTC Rule 4.41 — Hypothetical or simulated performance results have inherent limitations. Unlike actual performance records, simulated results do not represent real trading. Because trades have not actually been executed, these results may under- or over-compensate for the impact of market factors such as liquidity. No representation is being made that any account will achieve profits or losses similar to those shown.
Trademark Notice — NinjaTrader® is a registered trademark of NinjaTrader Group, LLC. No NinjaTrader company has any affiliation with the owner, developer, or provider of the products or services described herein, or any interest, ownership or otherwise, in any such product or service, or endorses, recommends or approves any such product or service.