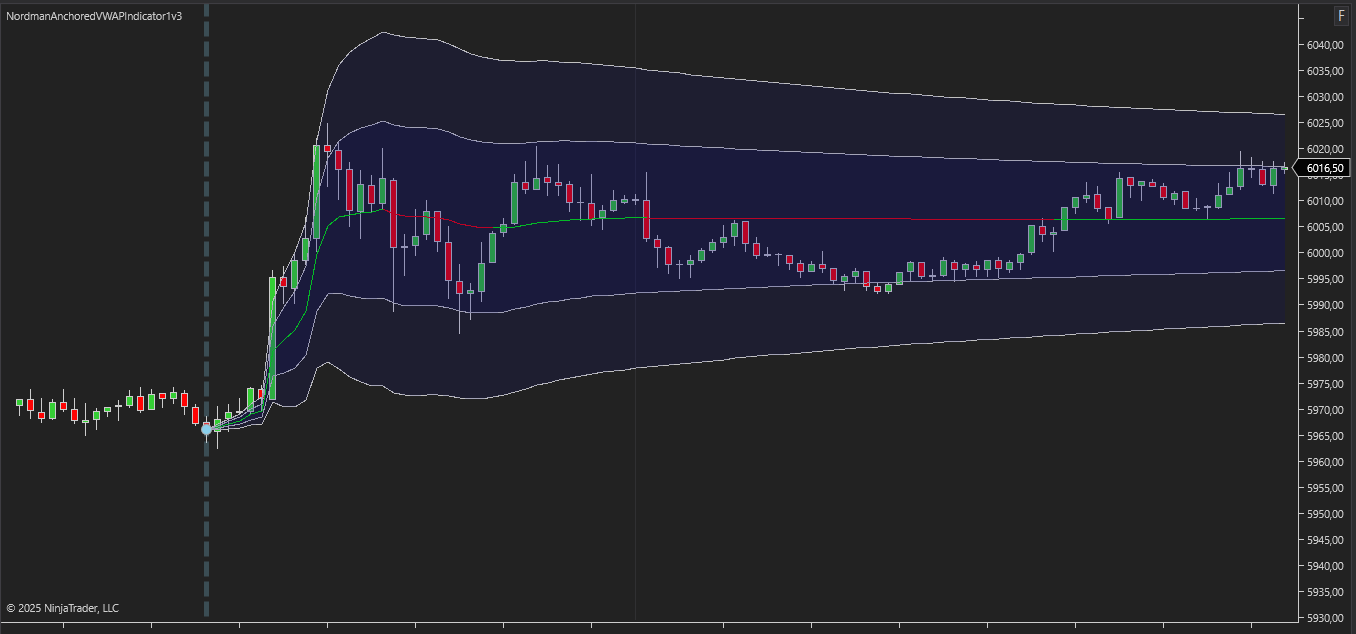
The Anchored VWAP Indicator for NinjaTrader is a flexible analytical tool that enhances the traditional VWAP concept by allowing traders to start the volume-weighted average price calculation from any specific point on the chart. Unlike standard VWAP, which resets based on a fixed period (such as a session, day, or week), Anchored VWAP continues to update from the anchor point, offering a more event-focused and continuous view of market structure.
This tool is especially useful for identifying volume-adjusted price dynamics, support and resistance zones, and potential areas of momentum shift after significant market events. Traders can anchor VWAP to earnings releases, news spikes, market highs/lows, or any relevant price level to monitor how price behaves from that moment forward.
In practice, the Anchored VWAP serves as a dynamic reference point, allowing traders to assess in real time how price behaves relative to the volume-weighted average since a key event. When the price is above the Anchored VWAP line, it indicates that buyers have been in control since the anchor point; when the price is below, it suggests that sellers are dominating. This makes the indicator especially useful for both trend-following strategies and mean-reversion setups.
Anchored VWAP can be used in a variety of ways:
Contextual Analysis
By anchoring VWAP to specific events on the chart—such as major economic data releases, news announcements, or significant highs and lows—traders can analyze how the market reacts to key developments or ongoing trends based on volume-weighted data.
Volume-Weighted Support and Resistance
The anchored VWAP line frequently functions as a focal point for price action, serving as support or resistance based on cumulative volume. These levels represent significant price-volume benchmarks often monitored by institutional participants.
Trend Assessment
When price consistently holds above the anchored VWAP, it indicates sustained bullish momentum. Conversely, when price remains below, it reflects ongoing bearish pressure. This assists in the systematic observation of price-volume relationships and identifying potential shifts in market direction.
Market Reaction Analysis
Traders can use Anchored VWAP to evaluate how the market has responded to macroeconomic data, breakout points, or other significant events by analyzing post-event price behavior.
Advantages of Using Anchored VWAP:
Adaptability: Traders have the ability to set the anchor point anywhere on the chart, which makes this tool highly adaptable for analyzing different market conditions and timeframes.
Event-Based Insight: Anchoring VWAP to a specific market event gives traders clearer insight into how price has behaved in response to that event over time.
Strategy Compatibility: Anchored VWAP can be tailored to match a wide range of analytical methodologies and individual preferences.
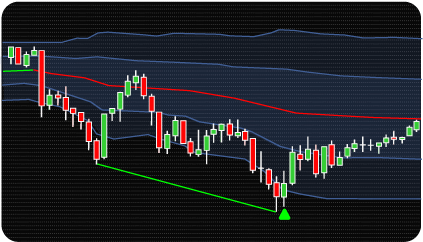
Practical Example: A trader might anchor the VWAP at a major swing high to see how price behaves as it revisits that level, helping to identify key areas of interest like reversion zones or potential support formation.
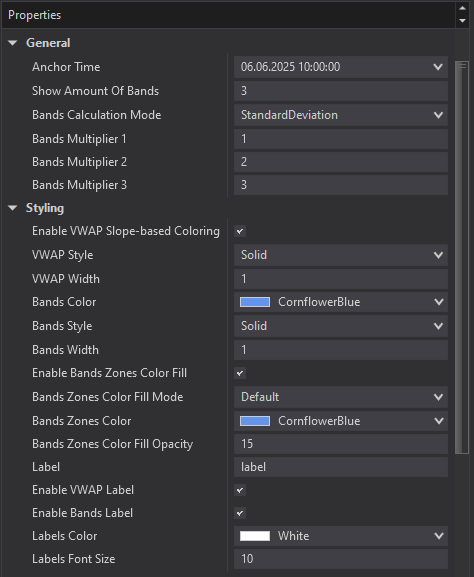
The indicator has the following parameters:
Alerts – Configure various types of alerts.
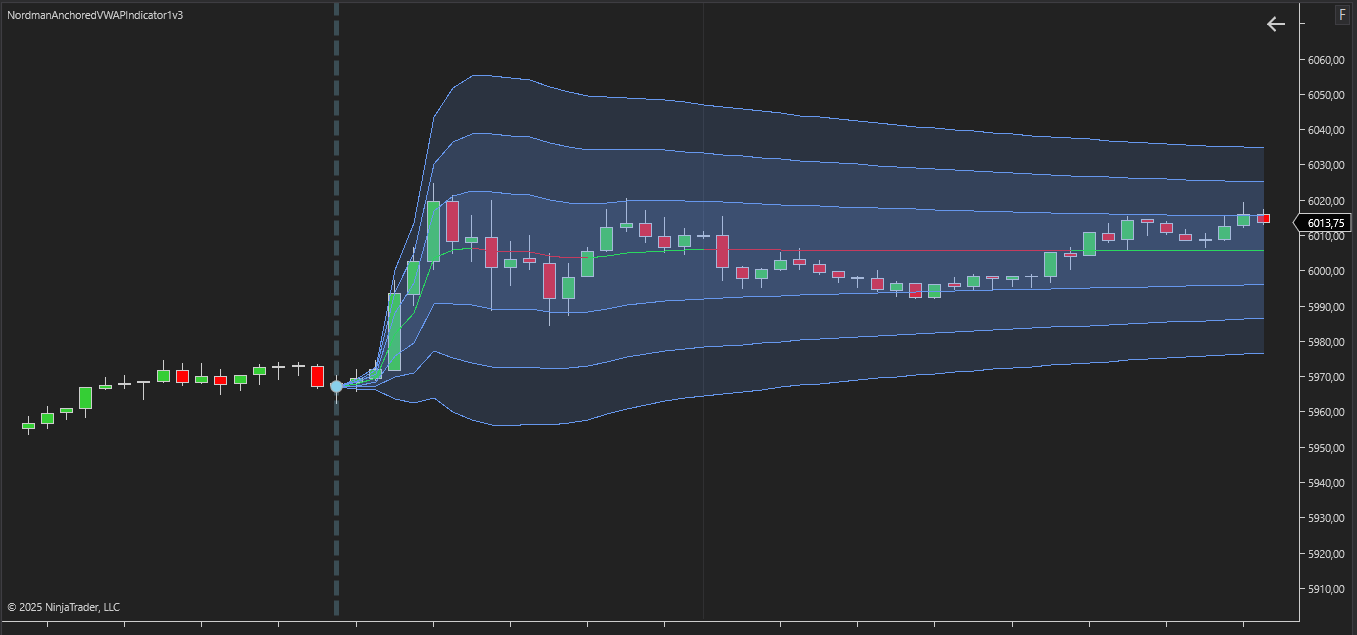
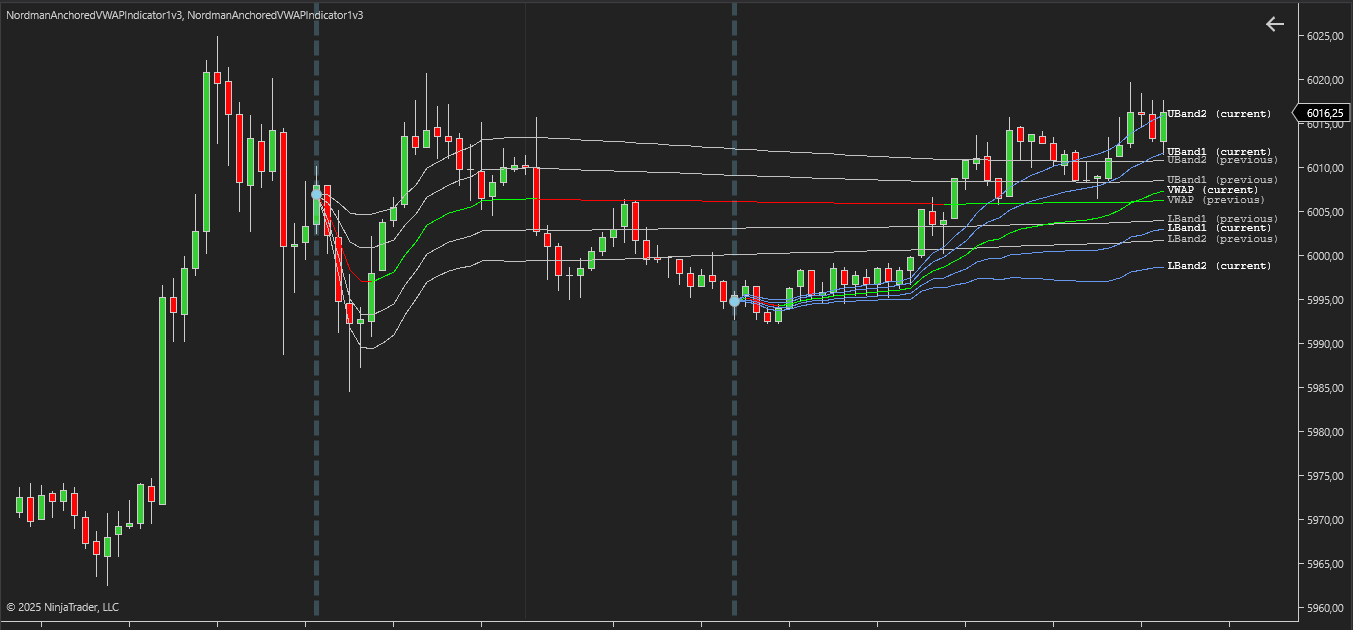
Anchor Time – Specifies the initial anchor point from which the Anchored VWAP calculation begins when the indicator is first loaded onto the chart. This serves as the starting reference for the VWAP line. After loading, the anchor can be freely moved on the chart to any desired point for further analysis.
Show Amount of Bands – specifies how many standard deviation bands will be displayed around the VWAP line.
Bands Calculation Mode – determines the method used to calculate the deviation bands. Traders can either use standard deviation multipliers or specify these multipliers as percentages instead of traditional coefficient values.
Bands Multiplier 1 / 2 / 3 – these fields set the multiplier values for the deviation bands. For example, a value of “1” for Multiplier 1 plots a band one standard deviation away from the VWAP line.
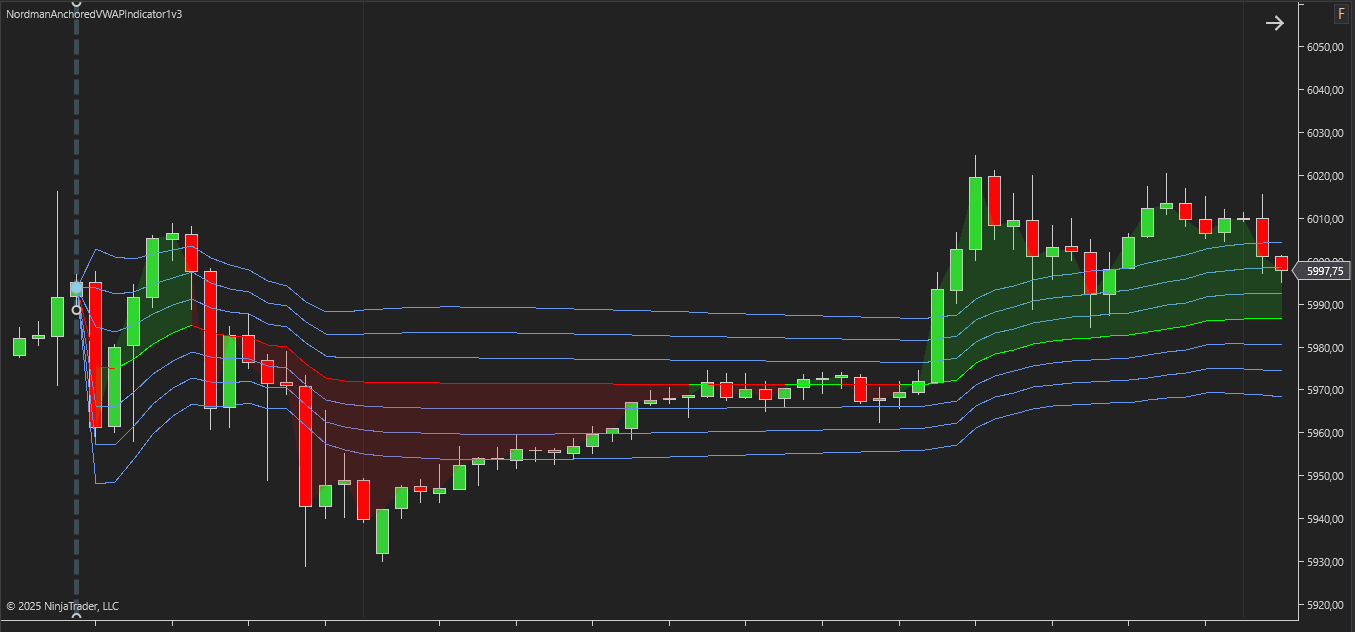
Enable VWAP Slope-based Coloring – activates dynamic color changes for the VWAP line based on its relationship to price action: green when the price is above VWAP, and red when below. This visual cue highlights the current price-VWAP relationship for enhanced market observation.
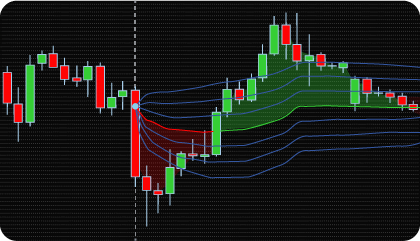
Enable Bands Zones Color Fill – Enables color filling for enhanced visual context. This feature supports two modes: Standard fill, which consistently colors the area between the VWAP line and its deviation bands, and Bullish/Bearish fill, which dynamically fills the area between the price and VWAP—green when the price is above VWAP and red when it is below—highlighting prevailing market sentiment.

We can customize this indicator to your needs — adding functions, modifying logic, or integrating it with other tools for your workflow.
We also convert indicators into Automated Trading Strategies with advanced functions (trailing stops, risk management, filters) tailored to your trading style strictly according to your specifications.
Request a free consultation to discuss the technical scope and timeline of your project.
We are committed to the ongoing development and refinement of our indicators. If you’ve spotted a bug, feel that something essential is missing, or have ideas that could make the indicator even better, just send us a message. Your feedback helps us improve and deliver tools that truly meet traders’ needs.
Nordman Algorithms is a trade name of Nordman Algorithms OÜ (Reg. No. 14435535), registered in Tallinn, Estonia.
Software Nature & User Responsibility — Nordman Algorithms provides algorithmic software tools for technical analysis. Nordman Algorithms is not a financial advisor and is not liable for any losses. All trades conducted based on the software’s output are executed at the user’s sole discretion and risk.
Visual Markers & Signal Disclosure — This software may display visual markers (such as arrows, dots, or alerts) when predefined mathematical conditions are met. These markers are provided for educational and analytical purposes only, must not be interpreted as financial guidance, and do not constitute a recommendation to buy, sell, or hold any financial instrument. Users must independently validate all visual cues within their own trading methodology.
No Financial Advice — Nordman Algorithms does not provide discretionary trading signals, investment advice, or managed signal services. Our software represents a mathematical visualization of historical and real-time data. The appearance of a visual marker does not guarantee a profitable trade or predict future market behavior.
Trading Risk Warning — Futures, Forex, and options trading involve significant risk. Risk capital is money that can be lost without jeopardizing financial security. Only risk capital should be used for trading. Past performance is not indicative of future results. View Full Risk Disclosure: https://www.nordman-algorithms.com/risk-disclosure/
ESMA Risk Warning — Financial instruments, especially those involving leverage such as CFDs and Forex, are complex and carry a high risk of rapid financial loss. Our software provides analytical outputs and visual markers based on predefined mathematical conditions and does not mitigate or reduce inherent market risks. You should carefully consider whether you understand how leveraged financial instruments work and whether you can afford the high risk of losing your capital.
CFTC Rule 4.41 — Hypothetical or simulated performance results have inherent limitations. Unlike actual performance records, simulated results do not represent real trading. Because trades have not actually been executed, these results may under- or over-compensate for the impact of market factors such as liquidity. No representation is being made that any account will achieve profits or losses similar to those shown.
Trademark Notice — NinjaTrader® is a registered trademark of NinjaTrader Group, LLC. No NinjaTrader company has any affiliation with the owner, developer, or provider of the products or services described herein, or any interest, ownership or otherwise, in any such product or service, or endorses, recommends or approves any such product or service.