The Turtle Trading Channel Indicator visualizes the price channel structure underlying the classic Turtle breakout strategy. The strategy is built on a single structural principle: when price breaks beyond the highest high or lowest low of the previous N bars, a directional condition is registered. The indicator makes this structure visible by drawing the channel boundaries directly on the chart — the main channel for entry conditions and a faster secondary channel for exit conditions.
The indicator uses two price channels simultaneously, each serving a distinct analytical function.
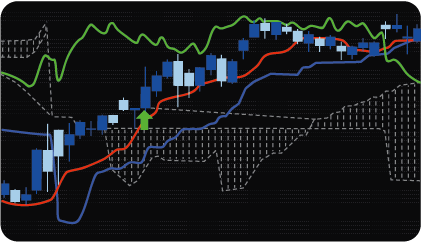
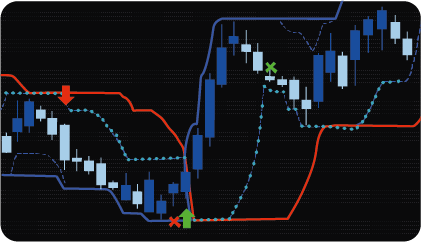
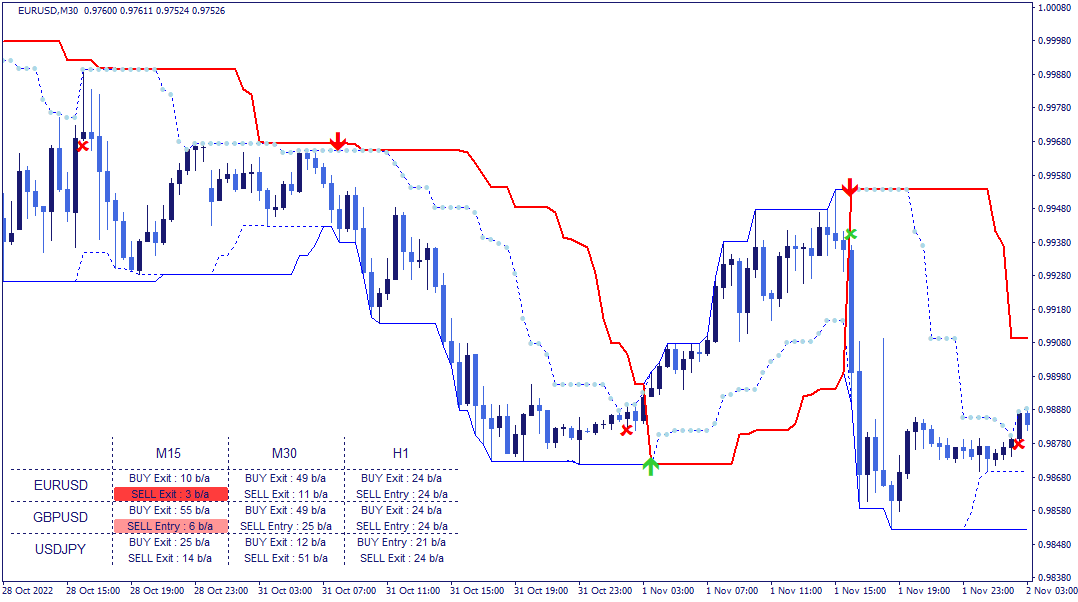
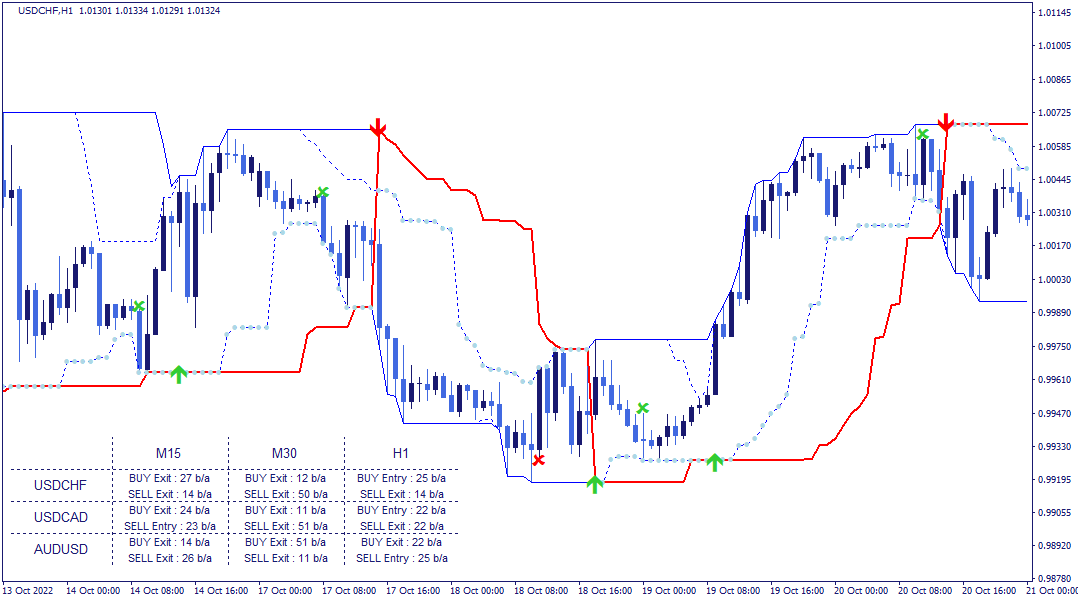
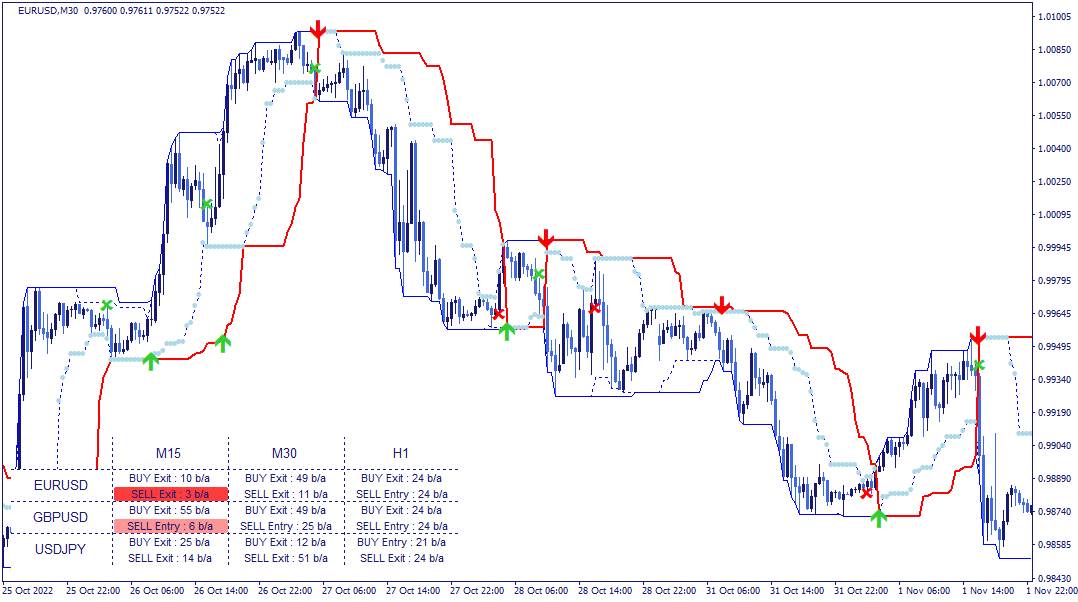
Main channel (entry) — drawn as a solid thin line, it represents the N-bar high and low over the configured entry period. When price breaks above the upper boundary, the upper line turns upward and a bullish condition is registered. When price breaks below the lower boundary, the lower line turns downward and a bearish condition is registered. The trend line — displayed as a thick red line — follows the breakout direction: it tracks the lower boundary of the main channel during a bullish condition and the upper boundary during a bearish condition. The distance between current price and the trend line reflects how far price has moved from the breakout level.
Closing channel (exit) — drawn as a dotted line, it uses a shorter period than the main channel and responds faster to price changes. One boundary of this channel is additionally marked with dots — this is the closing line. In a bullish condition, the closing line tracks the lower boundary of the exit channel. In a bearish condition, it tracks the upper boundary. When the closing line reverses direction — turning down during a bullish condition or turning up during a bearish one — a cross marker appears on the chart, indicating that an exit condition has been registered.
The two-channel structure allows you to see both the current directional condition and its potential exit level simultaneously. The gap between the main channel boundary and the closing line represents the structural space within which the current condition remains active.
The Turtle Trading strategy was developed by American trader Richard Dennis in the early 1980s. Dennis argued that successful trading was based on defined rules and consistent execution rather than intuition — and that these rules could be taught to anyone. He recruited a group of people with no prior trading experience, trained them in his methodology, and the group went on to generate significant returns. The strategy became known as the Turtle Trading system.
In the classic Turtle strategy, entry conditions were based on breakouts of 20-bar highs and lows — a long position was opened when the 20-bar high was broken, and a short position when the 20-bar low was broken. Exit conditions used a 10-bar channel: a break of the upper boundary closed a short position, and a break of the lower boundary closed a long position.
The indicator allows the entry and exit channel periods to be configured independently — making the breakout and exit logic adaptable to different instruments and timeframes while preserving the structural logic of the original strategy.
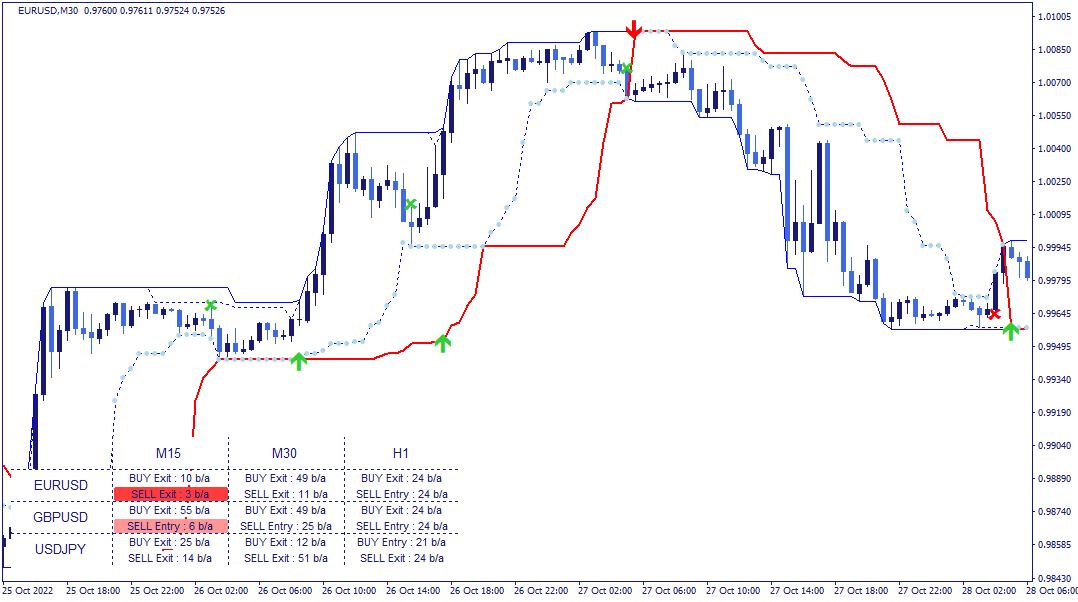
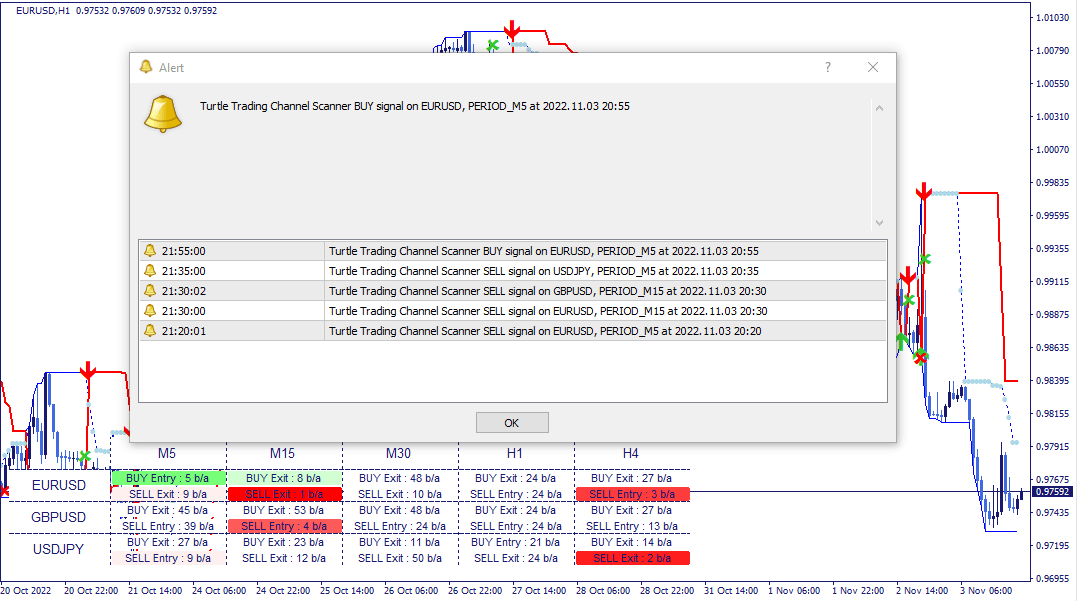
The dashboard displays the current condition status across all monitored assets and timeframes in a single structured view.
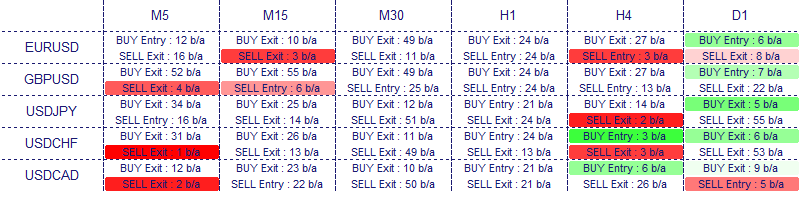
Each cell shows the directional context of the most recently registered condition — bullish or bearish — the condition type (entry or exit), and the number of bars back at which it was registered. Clicking any cell updates the chart to the corresponding asset and timeframe directly.
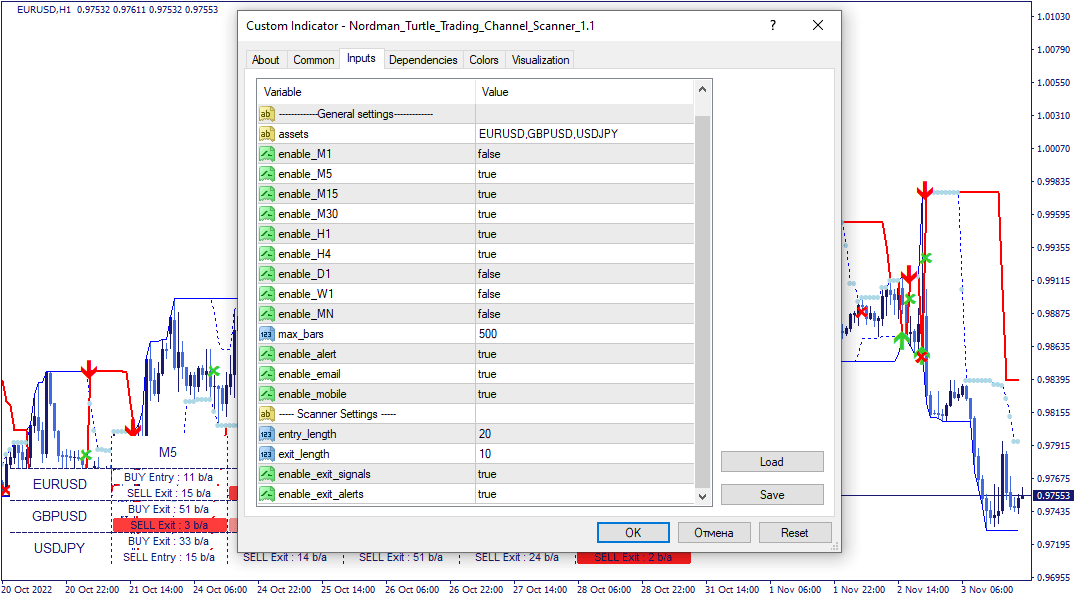
The indicator has the following parameters: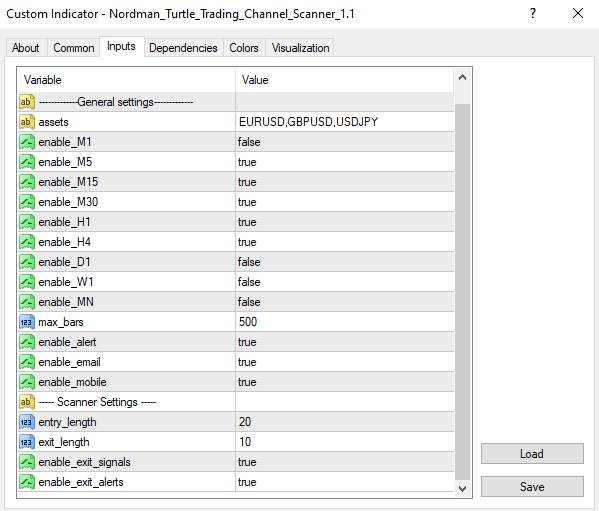
Assets — instruments to include in the scanner.
Enable_M1–MN — include or exclude individual timeframes from the scanner scope.
Max_bars — limits how far back the scanner evaluates conditions. Reducing this value improves calculation speed.
Enable alert / Enable email / Enable mobile — alert delivery: platform notifications, email, or mobile — each configurable independently.
Entry_length — the number of bars used to calculate the main channel boundaries for entry condition detection.
Exit_length — the number of bars used to calculate the secondary channel boundaries for exit condition detection.
Enable_exit_signals — enables or disables display of exit condition markers on the chart and dashboard.
Enable_exit_alerts — enables or disables alerts specifically for exit conditions.
Indicator Limitations
The Turtle Trading Channel Indicator reflects price channel calculations based on historical bar data. A registered condition indicates that price has broken beyond the defined channel boundary on a completed bar — it does not predict the magnitude or duration of the subsequent move. Channel breakouts can reverse quickly, particularly on lower timeframes or in ranging market conditions. All registered conditions should be evaluated within a broader analytical framework.

We can customize this indicator to your requirements by adding new features, modifying calculation logic, or combining multiple tools into a unified solution.
We also develop automated trading strategies (Expert Advisors) based on custom logic. The system can include configurable management modules such as dynamic risk parameters, multi-stage trailing stops, additional confirmation filters, and other custom functionality based on your specifications.
The final solution is delivered with full source code and post-delivery support. Contact us for a free consultation to discuss the scope and timeline of your project.
We are committed to the ongoing development and refinement of our indicators. If you’ve spotted a bug, feel that something essential is missing, or have ideas that could make the indicator even better, just send us a message. Your feedback helps us improve and deliver tools that truly meet traders’ needs.
Nordman Algorithms is a trade name of Nordman Algorithms OÜ (Reg. No. 14435535), registered in Tallinn, Estonia.
Software Nature & User Responsibility — Nordman Algorithms provides algorithmic software tools for technical analysis. Nordman Algorithms is not a financial advisor and is not liable for any losses. All trades conducted based on the software’s output are executed at the user’s sole discretion and risk.
Visual Markers & Signal Disclosure — This software may display visual markers (such as arrows, dots, or alerts) when predefined mathematical conditions are met. These markers are provided for educational and analytical purposes only, must not be interpreted as financial guidance, and do not constitute a recommendation to buy, sell, or hold any financial instrument. Users must independently validate all visual cues within their own trading methodology.
No Financial Advice — Nordman Algorithms does not provide discretionary trading signals, investment advice, or managed signal services. Our software represents a mathematical visualization of historical and real-time data. The appearance of a visual marker does not guarantee a profitable trade or predict future market behavior.
Trading Risk Warning — Futures, Forex, and options trading involve significant risk. Risk capital is money that can be lost without jeopardizing financial security. Only risk capital should be used for trading. Past performance is not indicative of future results. View Full Risk Disclosure: https://www.nordman-algorithms.com/risk-disclosure/
ESMA Risk Warning — Financial instruments, especially those involving leverage such as CFDs and Forex, are complex and carry a high risk of rapid financial loss. Our software provides analytical outputs and visual markers based on predefined mathematical conditions and does not mitigate or reduce inherent market risks. You should carefully consider whether you understand how leveraged financial instruments work and whether you can afford the high risk of losing your capital.
CFTC Rule 4.41 — Hypothetical or simulated performance results have inherent limitations. Unlike actual performance records, simulated results do not represent real trading. Because trades have not actually been executed, these results may under- or over-compensate for the impact of market factors such as liquidity. No representation is being made that any account will achieve profits or losses similar to those shown.