The TTM Squeeze Indicator is built around a specific market dynamic: before a significant directional move, price typically compresses into a tight range. The indicator identifies this compression phase and registers when price begins to exit it — providing a structural reference point for evaluating potential momentum expansion.
The indicator combines three components: Bollinger Bands, the Keltner Channel, and a Momentum Oscillator. Each measures a different aspect of price behavior, and their combined output drives both the squeeze detection and the directional reading.
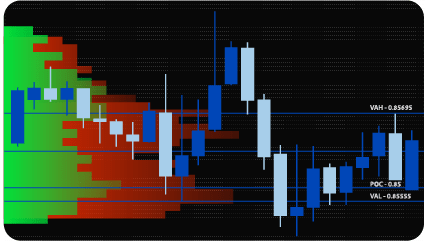
The core of the indicator is the relationship between Bollinger Bands and the Keltner Channel.
Bollinger Bands measure price deviation from a moving average. When the bands narrow, volatility has contracted and price is in compression. When they widen, volatility is expanding.
Keltner Channel measures the Average True Range — the average price range over a defined period. It provides a volatility envelope based on ATR rather than standard deviation.
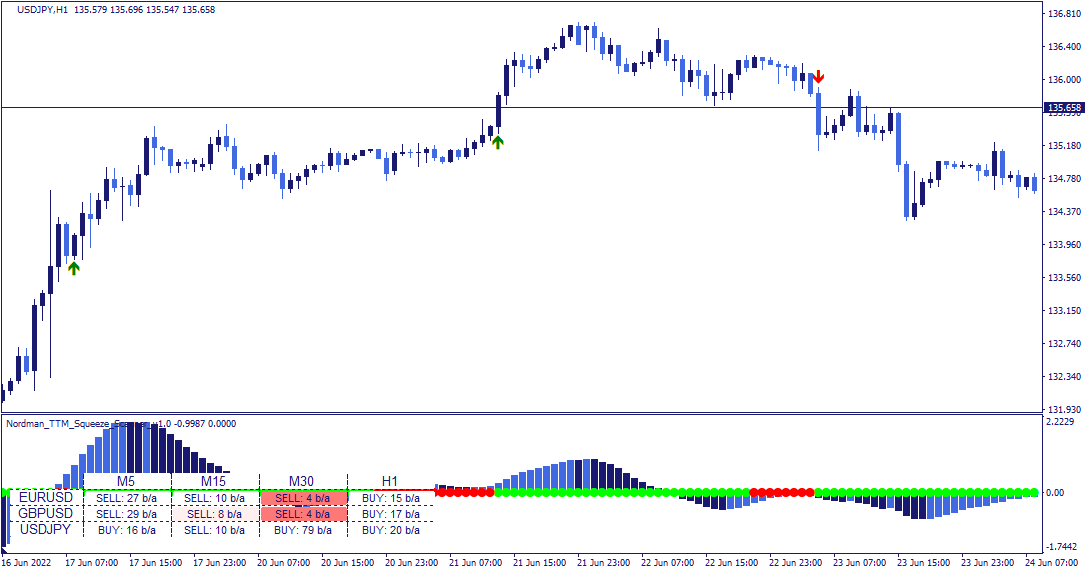
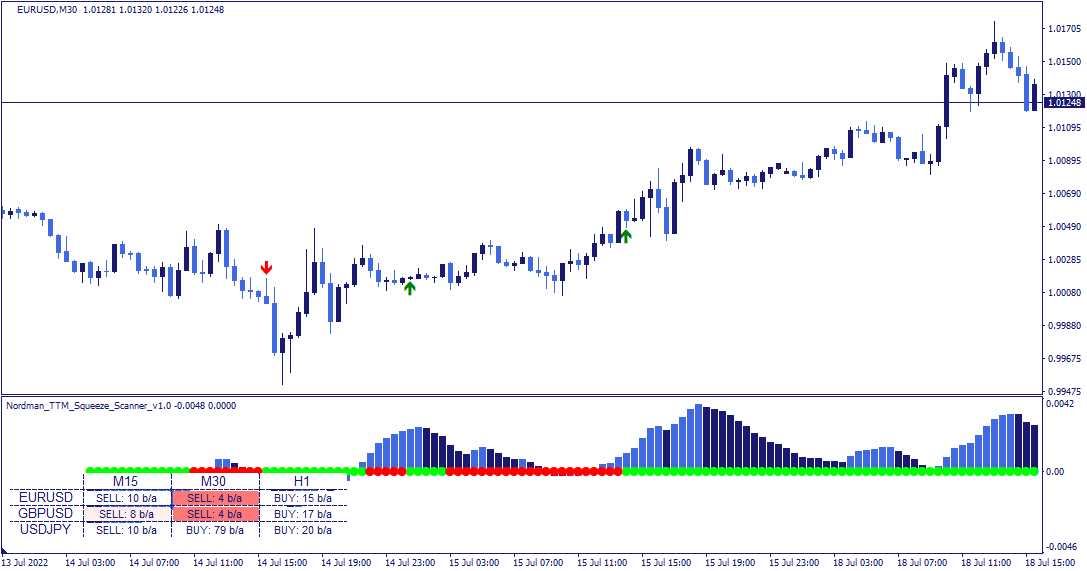
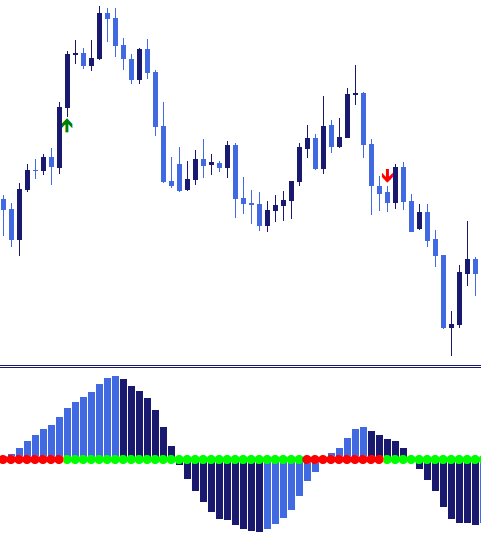
The squeeze condition is defined by the relative position of these two envelopes: when Bollinger Bands are inside the Keltner Channel, price is in compression — represented by red dots on the indicator. When Bollinger Bands expand beyond the Keltner Channel, the compression has ended and price is entering an expansion phase — the dots turn green.
The Momentum Oscillator tracks the rate of price change over a defined period. Its position and direction relative to the zero line indicates which way momentum is developing as price exits compression.
The combination works as a two-step reading: the dots indicate when compression ends, and the histogram indicates which direction the momentum is developing.
A condition is registered when two things happen together: the dots transition from red to green — indicating the end of a squeeze — and the histogram crosses or develops momentum in a defined direction.
The indicator supports two detection modes, selectable in the settings:
Standard mode — a bullish condition is registered when the dots turn green and the histogram is above zero. A bearish condition is registered when the dots turn green and the histogram is below zero.
Ascent/Descent mode — a bullish condition is registered when the histogram is rising, regardless of its position relative to zero. A bearish condition is registered when the histogram is falling. This mode focuses on the direction of momentum change rather than its absolute position.
One additional parameter — ttm_squeeze_length — sets the minimum number of consecutive red dots required before a condition can be registered. This ensures that only squeezes of sufficient duration are considered, filtering out brief compressions that may not carry the same structural significance.
The indicator does not redraw registered conditions — a condition that appears on a formed bar remains on that bar.
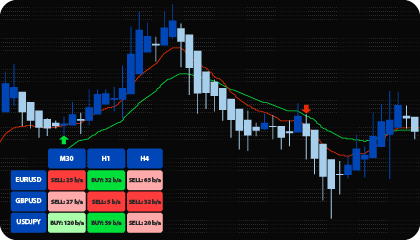
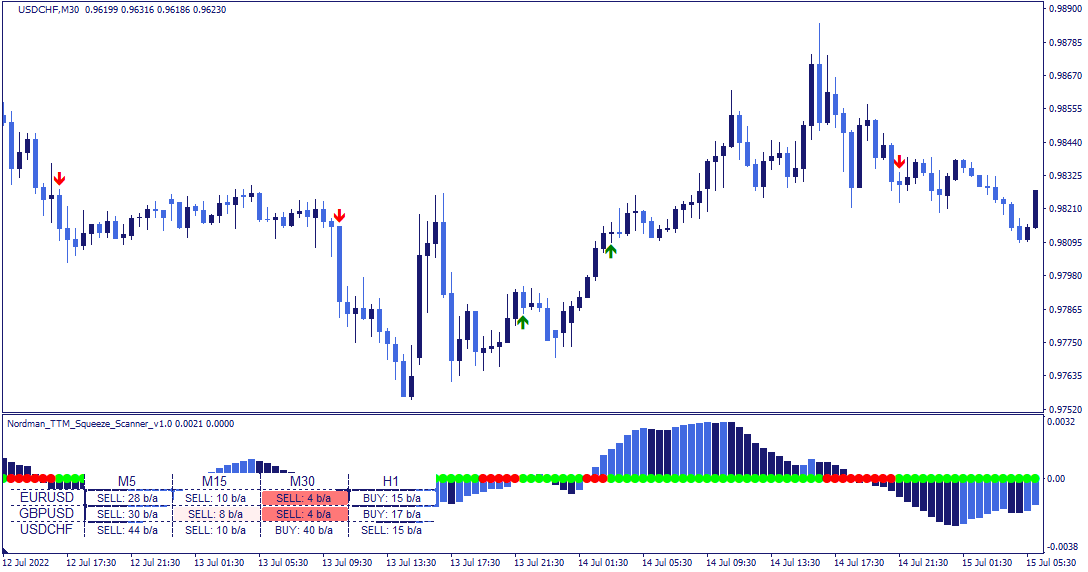
The dashboard displays the current squeeze and momentum status across all monitored assets and timeframes in a single structured view.
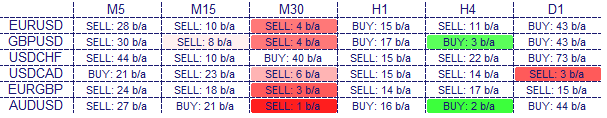
Each cell shows the directional context of the most recently registered condition — bullish or bearish — and the number of bars back at which it was registered. Green cells indicate a bullish condition, red cells a bearish one. Color saturation decreases as the condition becomes less recent. Clicking any cell updates the chart to the corresponding asset and timeframe directly.
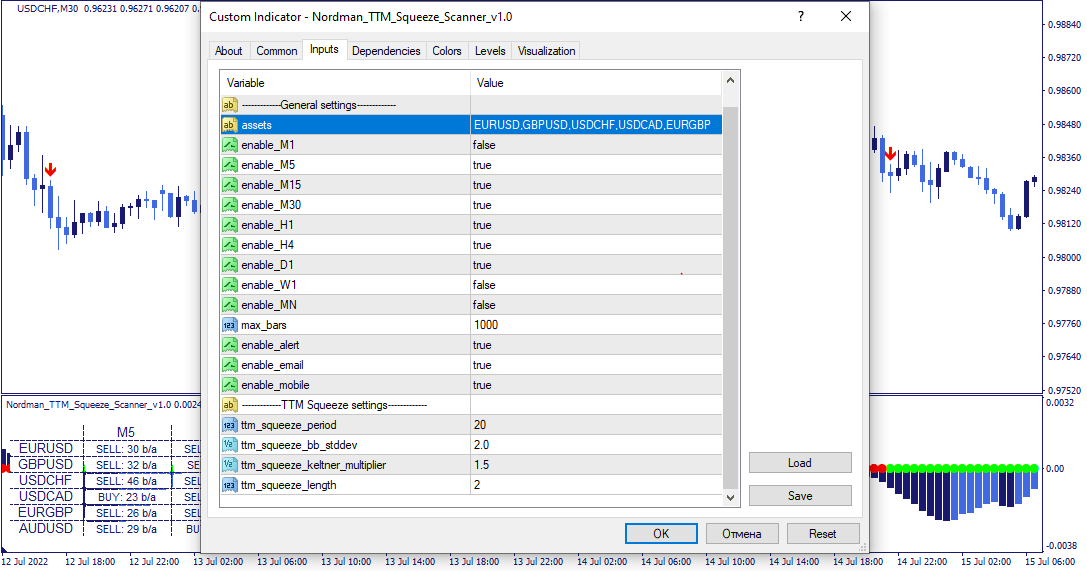
The indicator has the following parameters:
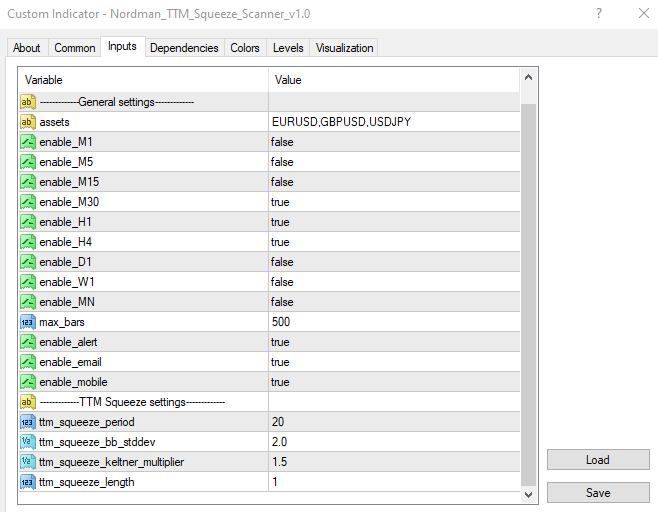
Assets — instruments to include in the scanner.
Enable_M1–MN — include or exclude individual timeframes from the scanner scope.
Max_bars — limits how far back the scanner evaluates conditions. Reducing this value improves calculation speed.
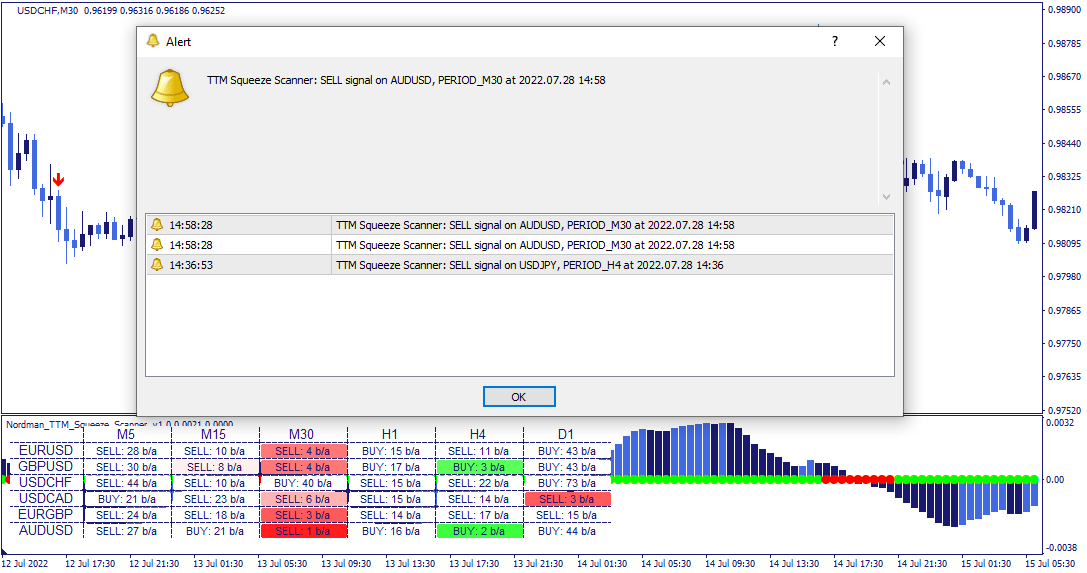
Enable alert / Enable email / Enable mobile — alert delivery: platform notifications, email, or mobile — each configurable independently.
Signal_mode — selects the detection mode: Standard or Ascent/Descent.
TTM Squeeze settings — configures the core parameters: period, Bollinger Bands standard deviation, and Keltner Channel multiplier.
ttm_squeeze_length — sets the minimum number of consecutive red dots required for a condition to be registered.
Indicator Limitations
The TTM Squeeze Indicator reflects calculations based on historical price and volatility data. A registered condition indicates that compression has ended and momentum is developing in a defined direction — it does not predict the magnitude or duration of the subsequent move. Price can exit a squeeze and immediately re-enter compression, or develop momentum in the opposite direction to the registered condition. All readings should be evaluated within a broader analytical framework.

We can customize this indicator to your requirements by adding new features, modifying calculation logic, or combining multiple tools into a unified solution.
We also develop automated trading strategies (Expert Advisors) based on custom logic. The system can include configurable management modules such as dynamic risk parameters, multi-stage trailing stops, additional confirmation filters, and other custom functionality based on your specifications.
The final solution is delivered with full source code and post-delivery support. Contact us for a free consultation to discuss the scope and timeline of your project.
We are committed to the ongoing development and refinement of our indicators. If you’ve spotted a bug, feel that something essential is missing, or have ideas that could make the indicator even better, just send us a message. Your feedback helps us improve and deliver tools that truly meet traders’ needs.
Nordman Algorithms is a trade name of Nordman Algorithms OÜ (Reg. No. 14435535), registered in Tallinn, Estonia.
Software Nature & User Responsibility — Nordman Algorithms provides algorithmic software tools for technical analysis. Nordman Algorithms is not a financial advisor and is not liable for any losses. All trades conducted based on the software’s output are executed at the user’s sole discretion and risk.
Visual Markers & Signal Disclosure — This software may display visual markers (such as arrows, dots, or alerts) when predefined mathematical conditions are met. These markers are provided for educational and analytical purposes only, must not be interpreted as financial guidance, and do not constitute a recommendation to buy, sell, or hold any financial instrument. Users must independently validate all visual cues within their own trading methodology.
No Financial Advice — Nordman Algorithms does not provide discretionary trading signals, investment advice, or managed signal services. Our software represents a mathematical visualization of historical and real-time data. The appearance of a visual marker does not guarantee a profitable trade or predict future market behavior.
Trading Risk Warning — Futures, Forex, and options trading involve significant risk. Risk capital is money that can be lost without jeopardizing financial security. Only risk capital should be used for trading. Past performance is not indicative of future results. View Full Risk Disclosure: https://www.nordman-algorithms.com/risk-disclosure/
ESMA Risk Warning — Financial instruments, especially those involving leverage such as CFDs and Forex, are complex and carry a high risk of rapid financial loss. Our software provides analytical outputs and visual markers based on predefined mathematical conditions and does not mitigate or reduce inherent market risks. You should carefully consider whether you understand how leveraged financial instruments work and whether you can afford the high risk of losing your capital.
CFTC Rule 4.41 — Hypothetical or simulated performance results have inherent limitations. Unlike actual performance records, simulated results do not represent real trading. Because trades have not actually been executed, these results may under- or over-compensate for the impact of market factors such as liquidity. No representation is being made that any account will achieve profits or losses similar to those shown.