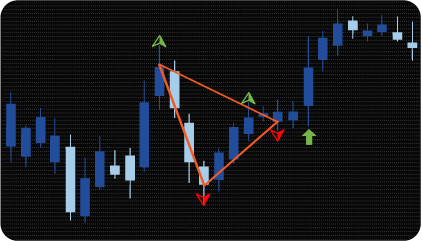
MT4 Triangle & Wedge Breakout Indicator is a technical analysis tool designed to automatically detect price patterns on a chart. It helps traders identify key formations such as symmetrical triangles, ascending and descending triangles, and wedges (rising and falling).
The main function of the indicator is to automatically recognize triangle and wedge formations on the price chart. These patterns are traditionally considered reliable trend continuation signals, and the indicator helps traders detect them in time and use them in trading.
The basis for pattern recognition is a customizable fractal indicator with separate parameters that determine the number of bars to the left and right of the fractal peak/trough. This approach, with a large value for the parameter determining the number of bars to the left, allows you to detect only significant, clearly defined fractals. Using a small value for the parameter determining the number of bars to the right of the peak enables the detection of fractals with minimal lag.
Patterns are recognized by analyzing the location of fractals relative to each other. A symmetrical triangle is formed by two upper and two lower fractals, and the slope of the upper edge of the triangle approximately corresponds to the growth of the lower edge. The direction of the pattern, that is, the direction of the trading signal, is determined by the sequence of alternating fractals. A buy trading signal always follows a lower fractal, while a sell signal follows an upper fractal.
Ascending and descending triangles have one horizontal edge, with a slight slope allowed within the adjustable tolerance. In an ascending triangle, the upper edge is horizontal; in a descending triangle, the lower edge is horizontal.
In a wedge, both edges are inclined in the same direction. In a falling wedge, the edges are inclined downward, with the upper edge steeper, causing them to converge and form a trapezoidal (wedge-like) shape. In a rising wedge, the edges are inclined upward, but the lower edge is steeper.
Since all patterns detected by this indicator are continuation patterns, it is important to ensure that the trading signal aligns with the prior price movement. To achieve this, an additional check of the direction of the previous price movement is applied.
The additional use of the MACD indicator ensures that patterns are detected only in the direction of the current trend. If the MACD histogram is above the signal line, the indicator identifies patterns suggesting the price will continue moving upward. Conversely, when the histogram is below the signal line, it identifies patterns indicating downward movement.
The scanner function allows traders to track multiple symbols and timeframes. The indicator dashboard provides easy visual control of all monitored symbols and enables quick chart switching to the desired symbol/timeframe.
The detected pattern can be represented using graphical objects in one of three ways:
The dashboard shows information about the current status of detecting signals.
The dashboard allows you to see at a glance the patterns that have formed in the market for the selected symbols and timeframes.
In the table cells, the following information is displayed:
To switch the chart to the desired symbol/timeframe, simply click on the corresponding cell in the table.
The indicator has the following parameters:
assets – selection of assets to search for signals. Separate symbols with commas.
max_bars – maximum number of bars back by which the scanner will search for signals. This parameter limits the number of calculations to speed up the indicator.
enable_alert – option to enable or disable alerts.
enable_email – allows sending email alerts.
enable_mobile – allows sending alerts to your mobile device.
Check Previous Movement – check the previous movement to ensure the pattern is valid.
Triangularity (from 0 to 1) – determines the triangularity of the pattern (0 = rectangle, 1 = perfect triangle, intermediate values = trapezoidal shape).
Use Uniform Filter – Enable the shape filter to refine pattern detection.
Deviation from Straight Line – acceptable deviation from a straight line for ascending and descending triangles.
X Bars to the left of the Top/Bottom – number of bars to the left of the top/bottom for fractal identification.
X Bars to the right of the Top/Bottom – number of bars to the right of the top/bottom for fractal identification.
Triangular Object – Trend Lines – display patterns as trend lines;
Triangular Object – Last Fractal – display patterns as trend lines that extend to the last fractal of the pattern;
Triangular Object – Signal Arrow – display patterns as trend lines that extend to the signal bar (arrow).

We can also turn the indicator into an Expert Advisor (trading robot) with an extended set of custom functions (stop loss, take profit, trailing stop, risk management parameters, trading time limit, and others).
Request a free consultation from our team of professional programmers and find out the cost and timing of your project development.
Nordman Algorithms is not liable for any risk that you face using the software. Please, use the software on your own responsibility. The software is coded in accordance with a common known concept and Nordman Algorithms does not guarantee accuracy or trading performance of the software signals.
Futures, foreign currency and options trading contains substantial risk and is not for every investor. An investor could potentially lose all or more than the initial investment. Risk capital is money that can be lost without jeopardizing one’s financial security or lifestyle. Only risk capital should be used for trading and only those with sufficient risk capital should consider trading. Past performance is not necessarily indicative of future results. View Full Risk Disclosure.
CFTC Rules 4.41 – Hypothetical or Simulated performance results that have certain inherent limitations. Unlike the results shown in an actual performance record, these results do not represent actual trading. Also, because these trades have not actually been executed, these results may have under-or over-compensated for the impact, if any, of certain market factors, such as lack of liquidity. Simulated or hypothetical trading programs in general are also subject to the fact that they are designed with the benefit of hindsight. No representation is being made that any account will or is likely to achieve profits or losses similar to these being shown.