The TDI (Traders Dynamic Index) is a composite indicator that integrates three analytical components — RSI, Moving Average, and Bollinger Bands — into a single framework. Each component contributes a different layer of market information, and their combination allows the indicator to reflect trend direction, momentum strength, and volatility within a single visual output.
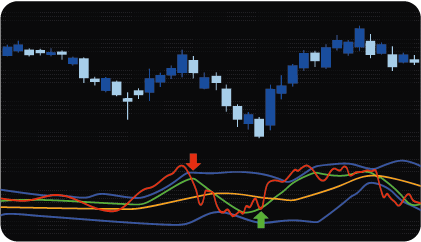
The indicator displays five lines, each derived from a specific calculation:
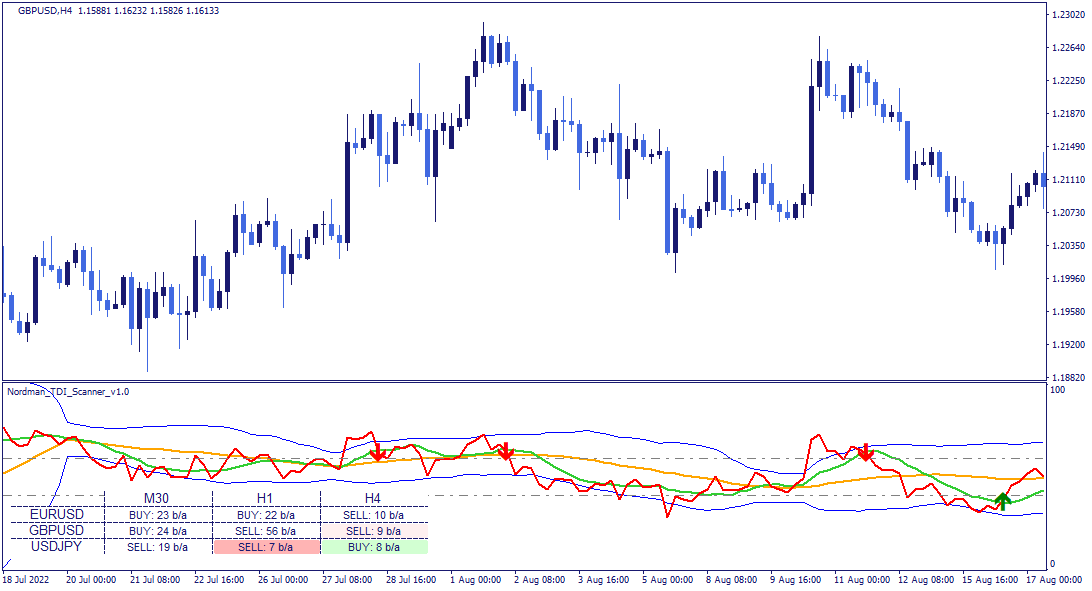
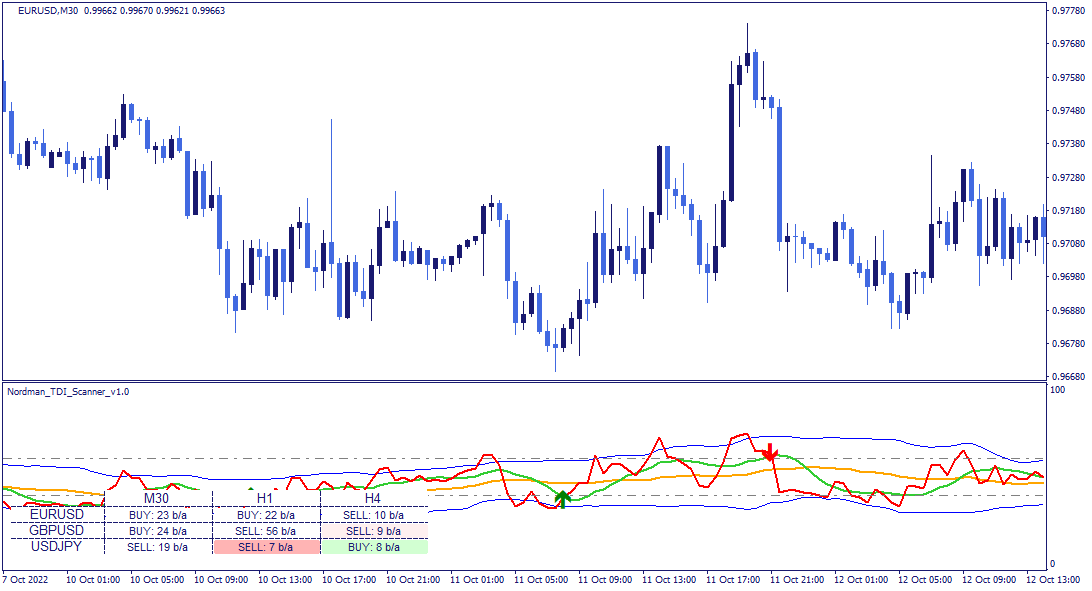
Green line (Price Line / Fast Line) — a smoothed RSI value with a shorter period. It reflects the current momentum of price movement and is the faster-responding of the two RSI-derived lines.
Red line (Signal Line) — a smoothed RSI value with a longer period. Because it uses a longer smoothing window, it responds more slowly to price changes — making the relationship between the green and red lines a measure of momentum shift.
Orange line (Moving Average / Channel Middle) — the central line of the Bollinger Band envelope. It represents the medium-term directional context and functions as the midpoint reference for the channel.
Blue lines (upper and lower channel borders) — Bollinger Band boundaries, shifted by a configurable number of standard deviations from the orange line. The distance between these lines reflects current volatility: expanding bands indicate increasing volatility, narrowing bands indicate decreasing volatility and reduced directional pressure.
Gray dashed lines — configurable overbought and oversold zone boundaries.
The combined reading works on three levels simultaneously: the position of the green line relative to orange reflects trend direction; the slope of the green line reflects momentum strength; and the width of the blue channel reflects market volatility. When the red signal line moves beyond the blue channel boundaries, this reflects an extended momentum condition relative to recent volatility.
The indicator supports two detection modes, selectable in the settings.
PRICE_LINE_CROSS mode — a bullish condition is registered when the red signal line crosses the green price line from below, provided both lines are in the oversold zone at the moment of the crossover and the red line had previously extended beyond the Bollinger Band boundaries. A bearish condition is registered when the red line crosses the green line from above under the same conditions in the overbought zone.
BAND_LINE_CROSS mode — a bullish condition is registered when the red signal line crosses the orange channel middle line from below, with the same additional conditions applied: the crossover occurs in the overbought/oversold zone and the red line had previously extended beyond the Bollinger Band boundaries. A bearish condition is registered when the red line crosses the orange line from above.
The overbought and oversold zone boundaries are configurable. Raising the overbought threshold or lowering the oversold threshold produces fewer but more structurally selective conditions — the additional filter criteria are harder to meet. Lowering the overbought threshold or raising the oversold threshold produces more frequent conditions with less structural selectivity.
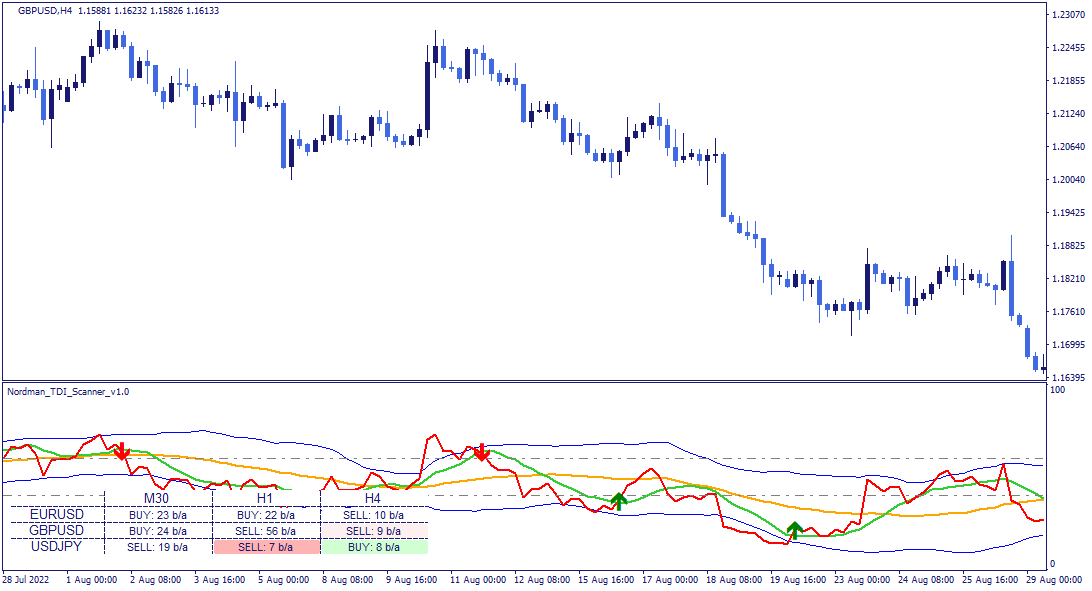
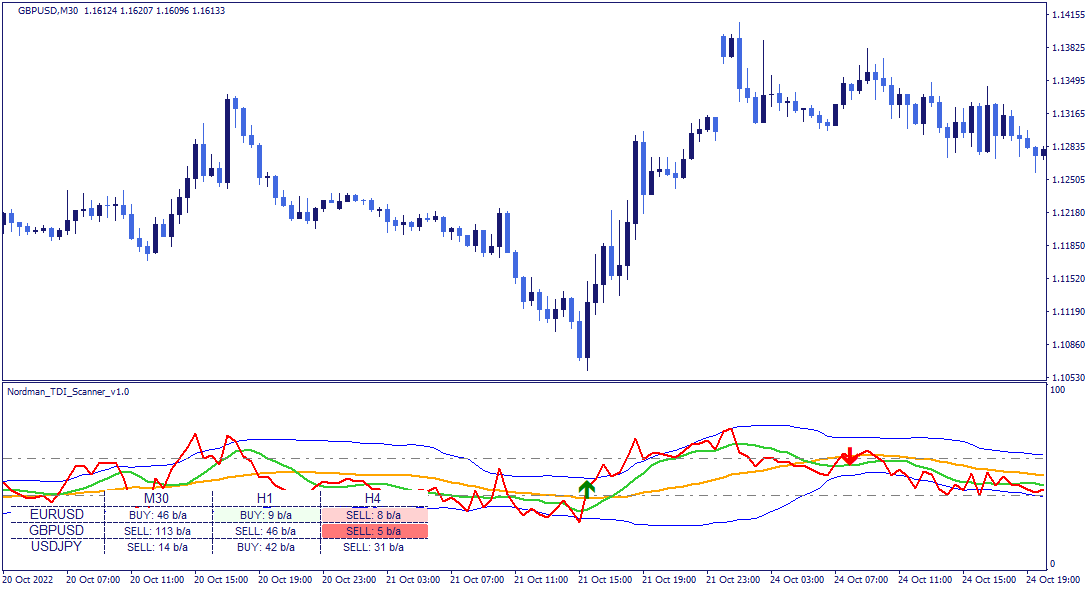
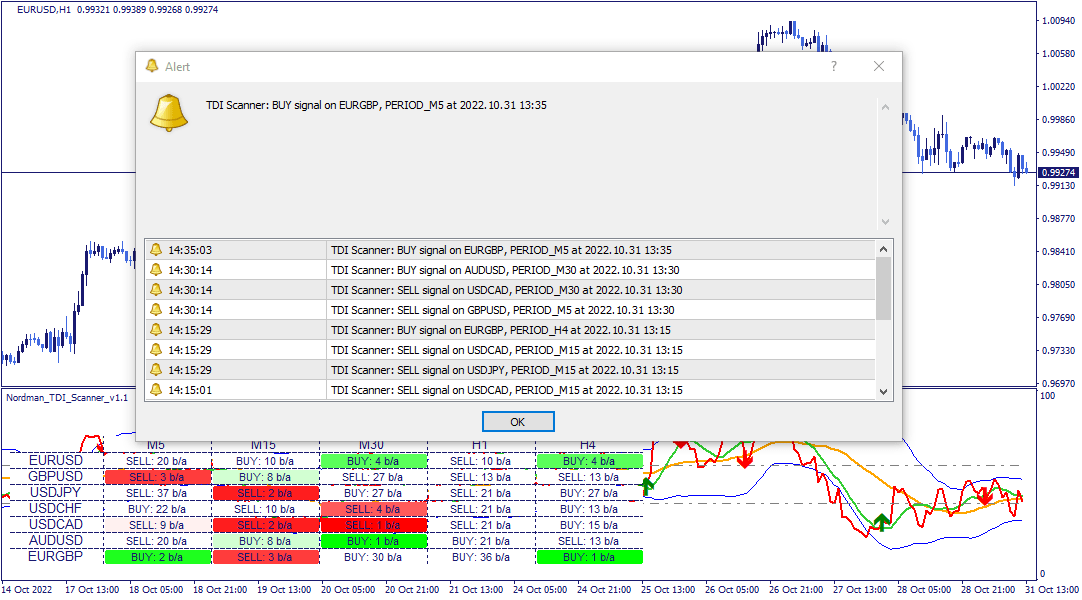
The dashboard displays the current condition status across all monitored assets and timeframes in a single structured view.
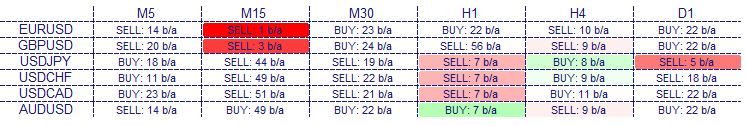
Each cell shows the directional context of the most recently registered condition — bullish or bearish — and the number of bars back at which it was registered. Green cells indicate a bullish condition, red cells a bearish one. Color saturation decreases as the condition becomes less recent. Clicking any cell updates the chart to the corresponding asset and timeframe directly.
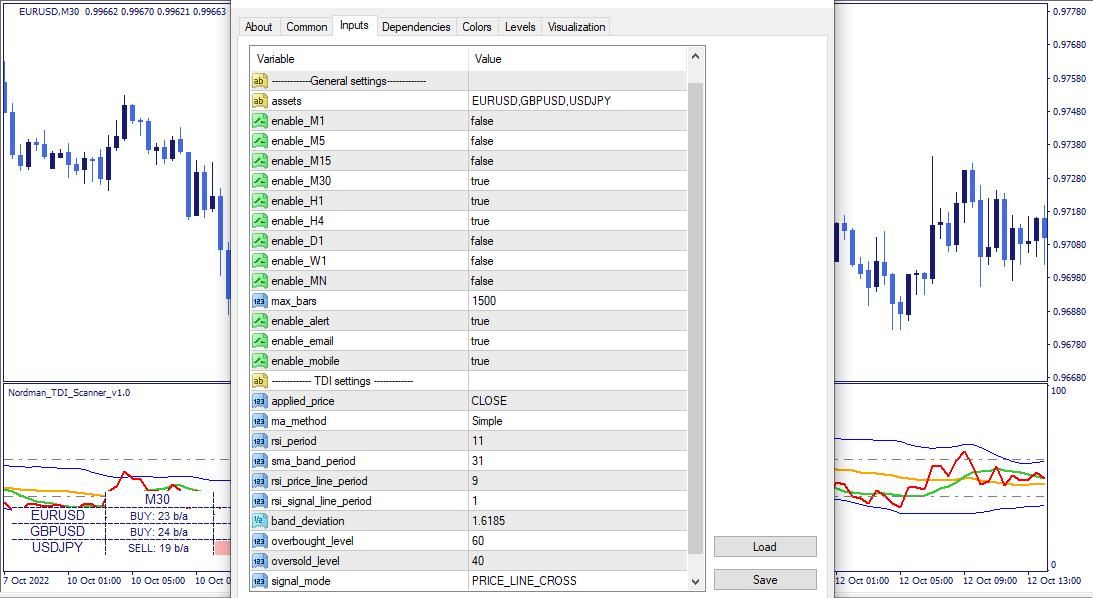
The indicator has the following parameters:
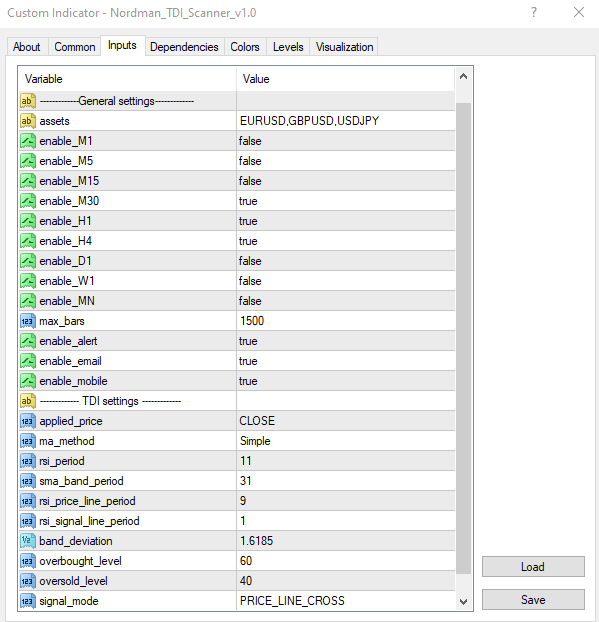
Assets — instruments to include in the scanner.
Enable_M1–MN — include or exclude individual timeframes from the scanner scope.
Max_bars — limits how far back the scanner evaluates conditions. Reducing this value improves calculation speed.
Enable alert / Enable email / Enable mobile — alert delivery: platform notifications, email, or mobile — each configurable independently.
Applied_price — price type used for RSI calculation: OPEN, HIGH, LOW, CLOSE, HL2, HLC3, or OHLC4.
MA_method — Moving Average method applied to the RSI smoothing.
RSI_price_line_period — period for the green price line (fast RSI).
RSI_signal_line_period — period for the red signal line (slow RSI).
Band_deviation — standard deviation multiplier for the Bollinger Band channel width.
Overbought_level / Oversold_level — configures the zone boundaries that define where crossover conditions are considered valid.
Signal_mode — selects the detection mode: PRICE_LINE_CROSS or BAND_LINE_CROSS.
Indicator Limitations
The TDI Indicator reflects calculations based on historical price data. Registered conditions indicate that the defined crossover and zone criteria have been met simultaneously — they do not predict future price movement or guarantee any particular market outcome. The indicator’s multi-component structure means that condition frequency is affected by both the crossover parameters and the zone boundary settings — adjusting either will change the structural selectivity of the output. All readings should be evaluated within a broader analytical framework.

We can customize this indicator to your requirements by adding new features, modifying calculation logic, or combining multiple tools into a unified solution.
We also develop automated trading strategies (Expert Advisors) based on custom logic. The system can include configurable management modules such as dynamic risk parameters, multi-stage trailing stops, additional confirmation filters, and other custom functionality based on your specifications.
The final solution is delivered with full source code and post-delivery support. Contact us for a free consultation to discuss the scope and timeline of your project.
We are committed to the ongoing development and refinement of our indicators. If you’ve spotted a bug, feel that something essential is missing, or have ideas that could make the indicator even better, just send us a message. Your feedback helps us improve and deliver tools that truly meet traders’ needs.
Nordman Algorithms is a trade name of Nordman Algorithms OÜ (Reg. No. 14435535), registered in Tallinn, Estonia.
Software Nature & User Responsibility — Nordman Algorithms provides algorithmic software tools for technical analysis. Nordman Algorithms is not a financial advisor and is not liable for any losses. All trades conducted based on the software’s output are executed at the user’s sole discretion and risk.
Visual Markers & Signal Disclosure — This software may display visual markers (such as arrows, dots, or alerts) when predefined mathematical conditions are met. These markers are provided for educational and analytical purposes only, must not be interpreted as financial guidance, and do not constitute a recommendation to buy, sell, or hold any financial instrument. Users must independently validate all visual cues within their own trading methodology.
No Financial Advice — Nordman Algorithms does not provide discretionary trading signals, investment advice, or managed signal services. Our software represents a mathematical visualization of historical and real-time data. The appearance of a visual marker does not guarantee a profitable trade or predict future market behavior.
Trading Risk Warning — Futures, Forex, and options trading involve significant risk. Risk capital is money that can be lost without jeopardizing financial security. Only risk capital should be used for trading. Past performance is not indicative of future results. View Full Risk Disclosure: https://www.nordman-algorithms.com/risk-disclosure/
ESMA Risk Warning — Financial instruments, especially those involving leverage such as CFDs and Forex, are complex and carry a high risk of rapid financial loss. Our software provides analytical outputs and visual markers based on predefined mathematical conditions and does not mitigate or reduce inherent market risks. You should carefully consider whether you understand how leveraged financial instruments work and whether you can afford the high risk of losing your capital.
CFTC Rule 4.41 — Hypothetical or simulated performance results have inherent limitations. Unlike actual performance records, simulated results do not represent real trading. Because trades have not actually been executed, these results may under- or over-compensate for the impact of market factors such as liquidity. No representation is being made that any account will achieve profits or losses similar to those shown.