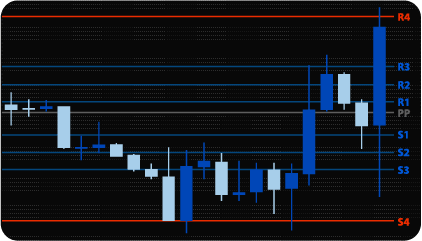
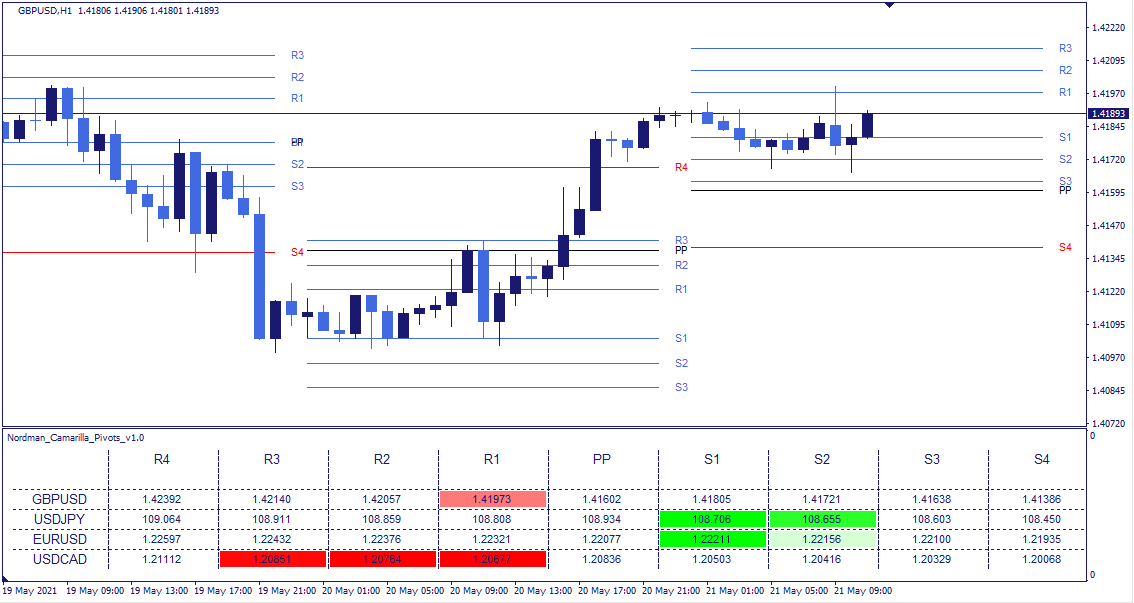
The Camarilla Pivot Points indicator calculates intraday support and resistance levels using a formula derived from the previous session’s price range. Unlike standard Pivot Points, the Camarilla method applies a fixed multiplier (1.1) to the previous session’s high-low spread, distributing the resulting levels symmetrically around the closing price. The result is nine levels: four resistance levels (R1–R4), four support levels (S1–S4), and a central Pivot Point (PP).
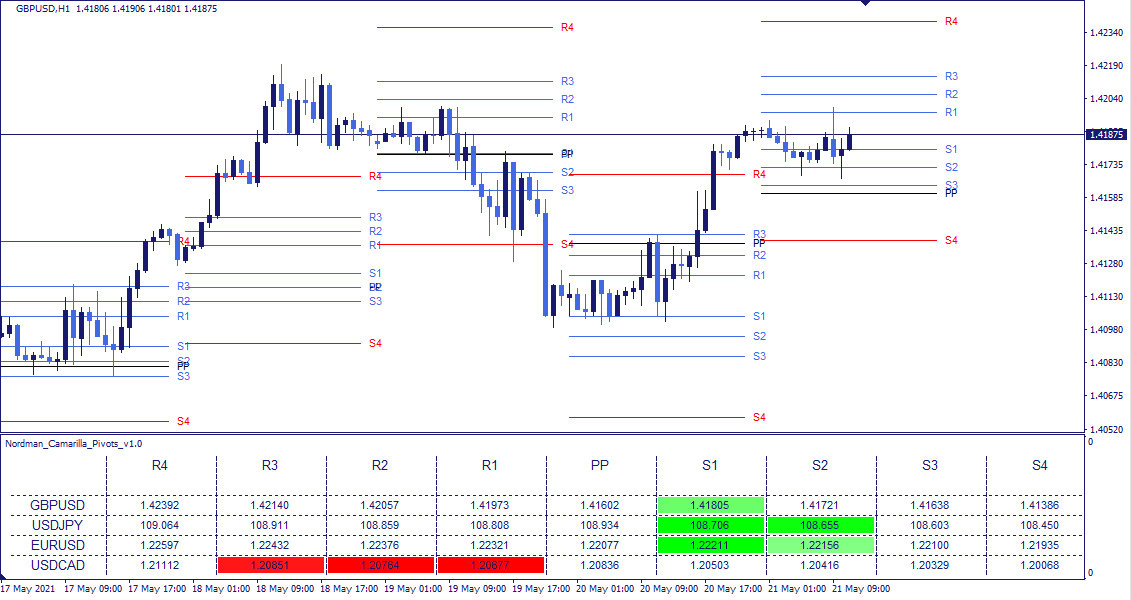
The indicator includes a multi-asset dashboard, configurable alerts, and one-click chart switching — allowing analysts to monitor Camarilla levels across multiple instruments and timeframes from a single view.
All nine levels are derived from the previous session’s high, low, and close:
R4 = CLOSE + (( HIGH – LOW ) × 1.1 / 2 )
R3 = CLOSE + (( HIGH – LOW ) × 1.1 / 4 )
R2 = CLOSE + (( HIGH – LOW ) × 1.1 / 6 )
R1 = CLOSE + (( HIGH – LOW ) × 1.1 / 12 )
PP = ( HIGH + LOW + CLOSE ) / 3
S1 = CLOSE – (( HIGH – LOW ) × 1.1 / 12 )
S2 = CLOSE – (( HIGH – LOW ) × 1.1 / 6 )
S3 = CLOSE – (( HIGH – LOW ) × 1.1 / 4 )
S4 = CLOSE – (( HIGH – LOW ) × 1.1 / 2 )
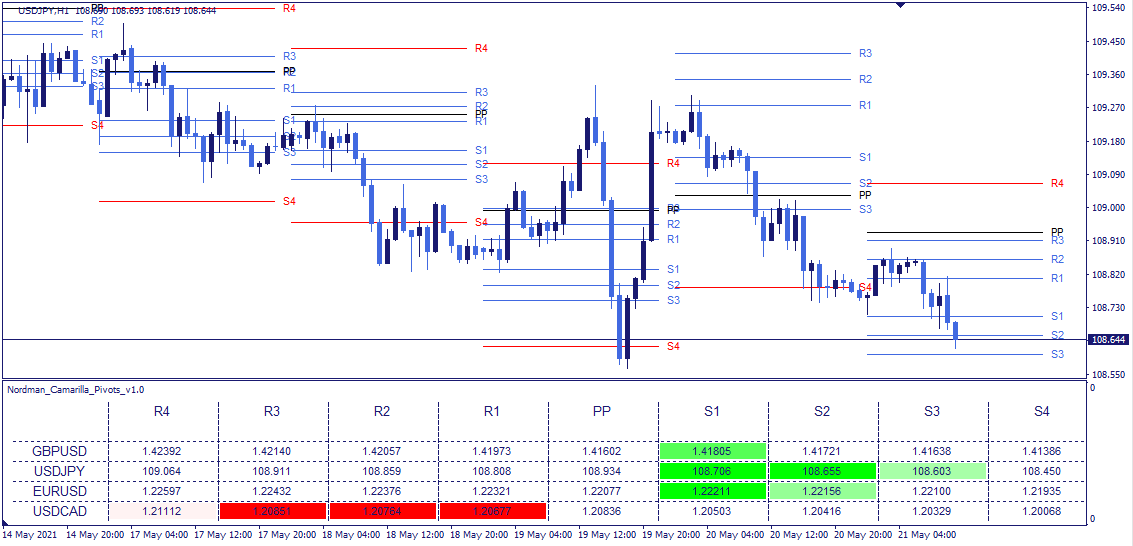
The S3/R3 and S4/R4 levels are the most structurally significant. S3 and R3 are commonly referenced as areas where price has historically shown reaction. S4 and R4 represent the outer boundaries — price moving beyond these levels has historically been associated with stronger directional conditions.
The indicator is used across several analytical approaches. The sections below describe how Camarilla levels function as structural reference points within each context.
Breakout analysis
When price moves through a Camarilla level, the indicator registers a breakout condition. The R3/S3 and R4/S4 levels are the primary reference points for this type of analysis.
When price is above R3 and moves back below it, analysts evaluate this as a potential bearish breakout condition — with S1, S2, and S3 as the next structural reference levels. R4 represents the outer boundary in this context.
When price is below S3 and moves back above it, the reverse applies — R1, R2, and R3 become the structural reference levels, with S4 as the outer boundary.
When price moves beyond R4 or S4, it exits the full Camarilla range. Historically, moves beyond these levels have been associated with sustained directional conditions. The 0.5%, 1%, and 1.5% extension levels above R4 or below S4 are used as reference points in this scenario, with R3 or S3 as the structural boundary in the opposite direction.
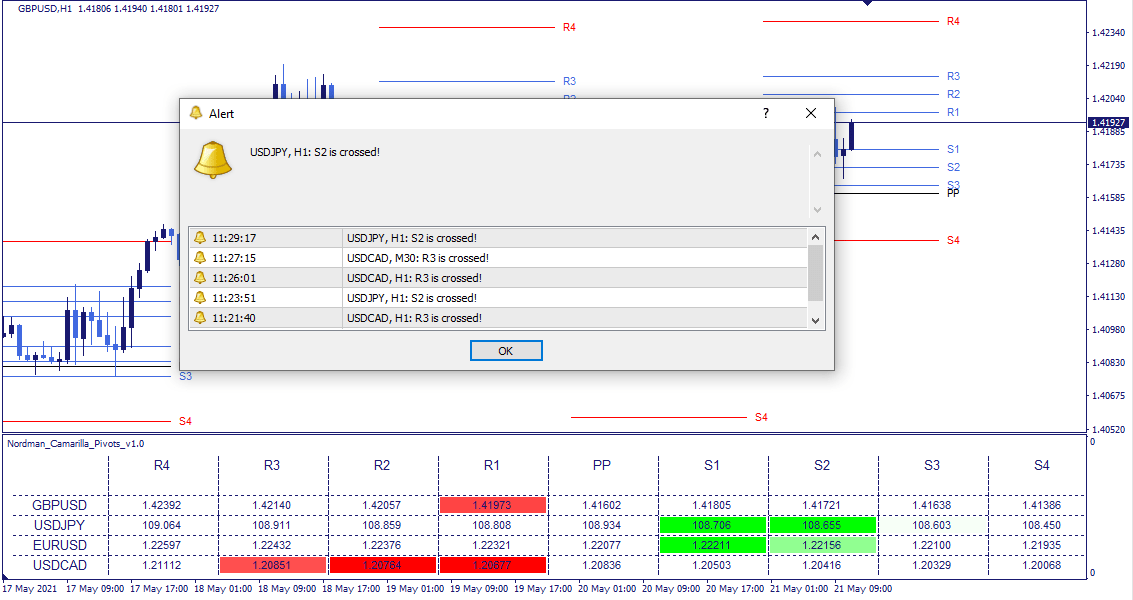
Configurable alerts can be set for each level — notifications trigger when price interacts with any of the drawn lines, removing the need for continuous manual monitoring.
Reversal analysis
The R4 and S4 levels are also used as structural reference points for evaluating potential price reversals. When price approaches R4 and shows no continuation above it, analysts evaluate this as a potential bearish condition — with S1, S2, and S3 as structural reference levels in the downward direction.
When price approaches S4 and shows no continuation below it, the reverse applies — R1, R2, and R3 become the structural reference levels.
In both cases, the outer level (R4 or S4) represents the structural boundary against which the potential reversal is evaluated. The next S or R level in the reversal direction serves as the first structural reference.
Trend context
The central Pivot Point (PP) functions as a structural midpoint between bullish and bearish conditions. When price is above PP, the structural bias is considered bullish — R1 through R4 represent the reference levels in the upward direction. When price is below PP, the structural bias is considered bearish — S1 through S4 represent the reference levels in the downward direction.
The PP level is used as the structural boundary in both cases — a move through PP in either direction shifts the structural context from one side to the other.
Exit condition reference
Camarilla levels can also function as reference points for evaluating exit conditions on existing positions. When price approaches a resistance level and fails to move through it, this may indicate that the upward move has reached a structural reference point. When price approaches a support level and shows similar behavior, the same applies in reverse.
The dashboard displays Camarilla levels and their current interaction status across all monitored assets and sessions in a single window.
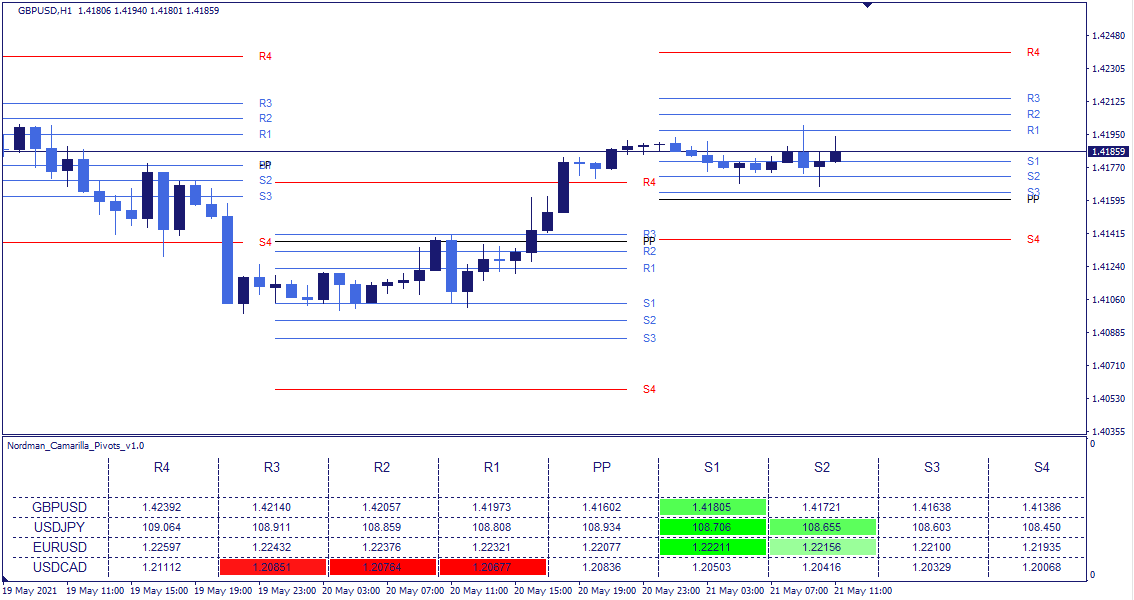
Each cell shows the current price position relative to the drawn levels. When a level is highlighted in green, price has moved through a resistance level from below. When a level is highlighted in red, price has moved through a support level from above. Color saturation decreases as the interaction becomes less recent. Clicking on any asset cell updates the chart to the corresponding instrument.
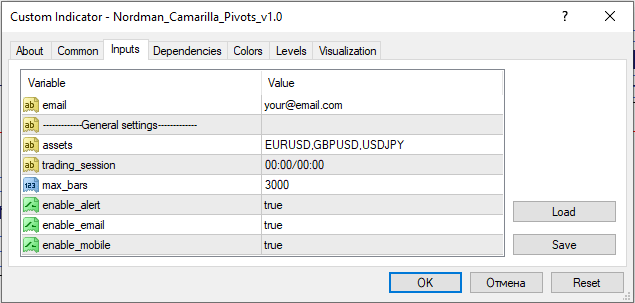
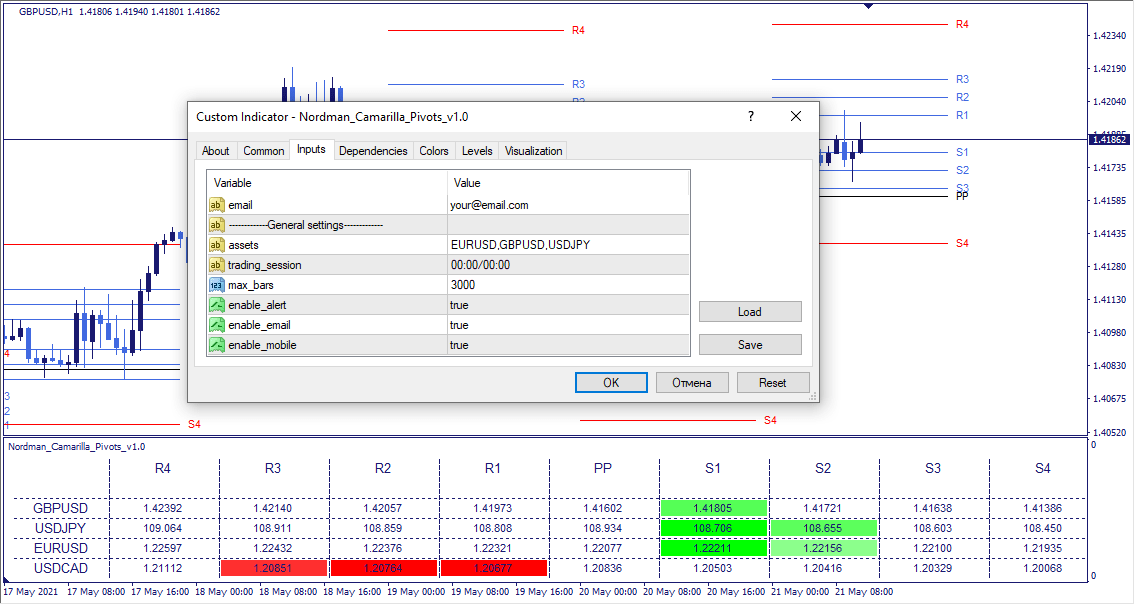
Assets — select the instruments to monitor. Any asset available in your broker’s terminal can be added or removed.
Trading session — defines the time at which Pivot Point levels are recalculated. Adjusting this parameter aligns the indicator’s session boundaries with your preferred market session.
Max bars — limits the number of bars included in the calculation. Reducing this value improves calculation speed when historical depth is not required.
Alerts — configurable notifications for level interactions, delivered as platform alerts, email messages, or mobile push notifications — each configurable independently.
Indicator Limitations
Camarilla Pivot Point levels are derived from the previous session’s price data. They represent mathematical reference points based on historical price range — they do not predict future price movement and do not guarantee that price will react at any displayed level. All identified levels should be evaluated within a broader analytical framework that considers current market structure and conditions.

We can customize this indicator to your requirements by adding new features, modifying calculation logic, or combining multiple tools into a unified solution.
We also develop automated trading strategies (Expert Advisors) based on custom logic. The system can include configurable management modules such as dynamic risk parameters, multi-stage trailing stops, additional confirmation filters, and other custom functionality based on your specifications.
The final solution is delivered with full source code and post-delivery support. Contact us for a free consultation to discuss the scope and timeline of your project.
We are committed to the ongoing development and refinement of our indicators. If you’ve spotted a bug, feel that something essential is missing, or have ideas that could make the indicator even better, just send us a message. Your feedback helps us improve and deliver tools that truly meet traders’ needs.
Nordman Algorithms is a trade name of Nordman Algorithms OÜ (Reg. No. 14435535), registered in Tallinn, Estonia.
Software Nature & User Responsibility — Nordman Algorithms provides algorithmic software tools for technical analysis. Nordman Algorithms is not a financial advisor and is not liable for any losses. All trades conducted based on the software’s output are executed at the user’s sole discretion and risk.
Visual Markers & Signal Disclosure — This software may display visual markers (such as arrows, dots, or alerts) when predefined mathematical conditions are met. These markers are provided for educational and analytical purposes only, must not be interpreted as financial guidance, and do not constitute a recommendation to buy, sell, or hold any financial instrument. Users must independently validate all visual cues within their own trading methodology.
No Financial Advice — Nordman Algorithms does not provide discretionary trading signals, investment advice, or managed signal services. Our software represents a mathematical visualization of historical and real-time data. The appearance of a visual marker does not guarantee a profitable trade or predict future market behavior.
Trading Risk Warning — Futures, Forex, and options trading involve significant risk. Risk capital is money that can be lost without jeopardizing financial security. Only risk capital should be used for trading. Past performance is not indicative of future results. View Full Risk Disclosure: https://www.nordman-algorithms.com/risk-disclosure/
ESMA Risk Warning — Financial instruments, especially those involving leverage such as CFDs and Forex, are complex and carry a high risk of rapid financial loss. Our software provides analytical outputs and visual markers based on predefined mathematical conditions and does not mitigate or reduce inherent market risks. You should carefully consider whether you understand how leveraged financial instruments work and whether you can afford the high risk of losing your capital.
CFTC Rule 4.41 — Hypothetical or simulated performance results have inherent limitations. Unlike actual performance records, simulated results do not represent real trading. Because trades have not actually been executed, these results may under- or over-compensate for the impact of market factors such as liquidity. No representation is being made that any account will achieve profits or losses similar to those shown.